6236
NEAREST DRIVER-FIFO COMBINATION MODEL
IN ONLINE MOTORCYCLE TAXI DISPATCH SYSTEM
PURBA DARU KUSUMA
Dept. of Electrical Engineering, Telkom University, Bandung, Indonesia E-mail: [email protected]
ABSTRACT
Dispatch system is one critical aspect in online motorcycle taxi system. Dispatch system affects both customer satisfaction and driver’s productivity. In online taxi system, nearest driver method is applied in most dispatch system. Meanwhile, FIFO method is applied in most taxi stands, such as in airport, railway station, etc. In this paper, we propose new dispatch system by combining nearest driver method and FIFO method. There are three combination methods. In the first method, both FIFO and nearest driver methods are weighted and then they are summed. Pickup request then will be allocated to the driver with the highest value of the summation. In the second method, pickup request will be allocated to the available driver with the highest idle time in certain broadcast area. If there are more than one drivers, the pickup request will be allocated to the nearest driver with the same idle time. In the third method, both driver’s idle time and driver-passenger distance are divided into certain classes. Each class is scored. Then, driver’s idle time score is summed with driver-passenger distance score. Pickup request is allocated to the driver who has highest score. Based on the simulation result, when the driver-passenger distance factor is dominant, weighted nearest driver-FIFO method is better than the existing nearest driver method. When the broadcast range is 0.5 kilometer, serial FIFO-nearest driver method is better than the nearest driver method.
Keywords: Motorcycle Taxi, Dispatching System, FIFO, Nearest Driver
1. INTRODUCTION
Nowadays, online motorcycle taxi service is popular in Indonesia and it started rapid growth in 2015 [1]. All of the online motorcycle taxi service providers are company, such as: Go-Jek [1], Uber [2], Grab [1,3], etc. The penetration of mobile device and Google Map service make this service possible. The increasing of online motorcycle taxi service has harmed the existence of traditional car and motorcycle taxi [1]. In online system, booking process is much easier than the traditional system by phone request. When passenger creates pickup request, the precise pickup and destination locations are sent to the system and then transmitted to the driver.
One critical aspect in online motorcycle taxi service is dispatch system [4-11,16]. By dispatch system, passenger’s pickup request will be allocated to the available driver [4]. By allocating the passenger to the correct driver, customer’s satisfaction and driver’s productivity can be maintained [4]. Nowadays, GPS has been used in taxi dispatch system [4,7,8,9,10,11,12,18] so that pickup location can be detected more precisely. In
some online motorcycle taxi systems, the dispatch result is mandatory. It means that driver has to accept the pickup request that is transmitted to him by the dispatcher or he will receive penalty.
The most common method that is adopted by online motorcycle taxi provider is nearest driver concept [4,7,12]. It means that the passenger will be picked up by the nearest driver around him. The reason is the nearer the driver to the passenger, passenger’s waiting time will be lower and driver’s pickup distance will be shorter [4]. It means that driver can reduce the wasted fuel because pickup cost is not charged to the passenger.
6237 whose location is little bit farther has bigger pickup order opportunity.
Meanwhile, in conventional taxi dispatch system, First In First Out (FIFO) model is a common method [20,21], especially in taxi stand. Taxi stand model is easily founded in airport, railway station, mall, etc. In the queue, a passenger will be allocated to the driver who joins the queue in the earliest time. This method is fair for passenger too because as far as there is taxi in the queue, passenger’s waiting time is zero. So, the research question is how to combine nearest driver model and FIFO model in online motorcycle taxi dispatching system so that there is balance situation between passenger waiting time and driver idle time.
Based on this condition, improvement of the basic nearest driver method in online taxi dispatch system is important. The online motorcycle taxi system is very popular. There are thousand drivers and million customers in this business. So, the improvement in the dispatch system can make benefit to its stakeholders. For drivers, when the idle time is reduced, the productivity and income will be increase. For passengers, if the waiting time is still low, the customer satisfaction is maintained. If both actors are satisfied, the business continuity and sustainability is guaranteed and it is good for investors. The growth and sustainability of this business may help government in campaigning public transport usage. That is why this research is important and interesting.
The main research question in this paper is how to combine the nearest driver method which is common in online taxi dispatch system with FIFO method which is common in local taxi queue system. The next question is can the combination model solve the problem that occurs in nearest driver method. In other word, the question is what kind of combination that can solve the problem in nearest driver method.
The purpose of this research is to develop the combination between nearest driver and FIFO models in online motorcycle taxi dispatch system. This proposed model then is implemented in online motorcycle taxi simulation so that the performance can be observed. Our proposed model is also compared with the existing nearest driver and FIFO model.
This paper is structured as follows. In section 1, the background and the research purpose is explained so that this research is important to be done. In section 2, some existing dispatch systems are explained. In section 3, we explained our proposed model in combining nearest driver and FIFO models. In section 4, we explain the dispatch model implementation in motorcycle taxi simulation, the discussion about the model testing result, and the research finding. In section 5, we make the conclusion and the future research potentials.
.
2. EXISTING TAXI DISPATCH SYSTEM
Dispatch system is a crucial system in taxi service. The function of this system is to allocate taxi fleet to execute pickup or booking request [4]. This system also has function to allocate fleet to area with high pickup opportunity [6]. Some achievement parameters of this system are customer satisfaction and driver productivity [4]. Customer satisfaction can be measured in passenger easiness to find taxi and passenger waiting time [4]. In the other side, driver productivity can be measured with idle time, cruising distance, vacant time, fuel cost [13], and daily revenue parameters [4,6,17,19].
The enhancement of communication technology improves the dispatch system method and infrastructure. For decades, in conventional way, dispatch system is operated by operator and the radio communication plays vital role. Passenger calls operator by phone and informs the pickup location, pickup time, and his destination. Then, operator broadcasts the pickup request to all taxi drivers in the company to find whether there are available drivers to execute this pickup request through radio communication. Then, available drivers will confirm to operator so that pickup request will be allocated to him. Operator then confirms to the passenger by phone whether there is a driver that will pick up the passenger or there is not any available driver that can pick up the request. Problem may occur when the driver come to passenger. If the pickup address is not clear, finding the pickup location will be difficult work. In this time, computer has not needed yet.
6238 driver. Usually, pickup request will be allocated to the nearest driver to minimize passenger waiting time [4].
The rise of mobile technology [9,14,15], especially Android and Google Map, makes booking request and dispatch system become much easier. In this era, online taxi system becomes popular. By this technology, the existence of operator is not needed anymore. Passenger can make pickup request through mobile application without phone call [9]. By using GPS embedded mobile phone, when passenger makes pickup request, precise pickup location and the destination is sent to the dispatch system [15]. Meanwhile, precise driver’s location and status are also transmitted regularly from driver’s mobile device. So, the dispatch process can be done automatically in central system.
In online dispatch system, there are two concepts in driver allocation. In the first concepts, the pickup order is mandatory. In this concept, when driver received pickup order, he must execute the pickup order. If he rejects the pickup order, he will get penalty from the taxi company. In this concept, pickup order is usually allocated to the nearest available driver. The purpose is to minimize the passenger waiting time and driver pickup distance. In the second concept, the pickup order is not mandatory. The passenger pickup request will be broadcasted to the drivers under the certain distance to the passenger pickup location. The driver who receives the pickup request may accept or ignore this request. Pickup request then will be allocated to the driver who accepts the request for the first time. If there is not any drivers who accept the request, then the request is fail. Driver ignores the pickup request because of some reasons, such as the transport distance is to far or the pickup or the destination location is dangerous area so that accepting this request may triggers conflict with local traditional motorcycle taxi.
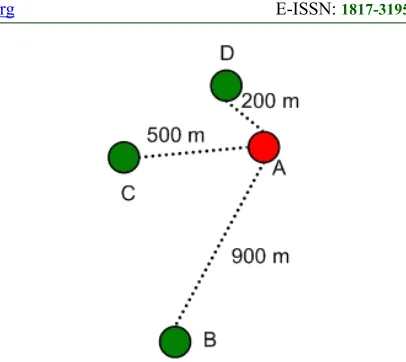
[image:3.612.316.519.74.255.2]Even nearest driver method is popular and it is proven in minimizing passenger waiting time and driver pickup distance, there is an important problem. The illustration can be seen in Figure 1. In Figure 1, there is passenger A, and three drivers: driver B, driver C, and driver D. The distance between driver and passenger A are 900 meters, 500 meters, and 200 meters consecutively. By using nearest driver method, passenger A will be allocated to driver D.
Figure 1: Nearest Driver Method Illustration
In mathematic symbol, the nearest driver method can be symbolized as follows. Suppose that there are n drivers around the passenger and they are symbolized in d. So, the set of drivers is symbolized in D and D is {d1,d2,d3,…,dn}. The distance between driver and passenger is symbolized in r. The set of distance between passenger and driver is symbolized in R. So, R is {r1,r2,…,rn}. The allocated driver is symbolized in delect. The driver allocation formula is described in Equation 1. If D is empty set which means there is not any driver around the passenger then there will be not any driver that can be allocated.
}
)
min(
|
{
d
d
D
r
D
d
elect i i i (1)
The problem is in this method, driver’s idle time is ignored. For example, if the driver idle time is symbolized with tidle and the set of driver idle time is symbolized with Tidle, then Tidle is {tidle,1, tidle,2, tidle,3, …, tidle,n}. if idle time for drivers B, C, and D are 5 minutes, 15 minutes, and 8 minutes, then the idle time for the allocated driver is 8 minutes. It is looked unfair for driver C who has been waiting for 15 minutes and is missed for the allocation. Even his idle time is double than the allocated driver (driver D), the passenger’s waiting time will not be significantly different because even the pickup distance different is double, passenger’s waiting time is not different at all because for pickup distance that is less than 1 kilometer, the passenger’s waiting time is still below 5 minutes.
6239 Figure 2. In the example above, the pickup order will be allocated to driver C. The driver allocation is described formally in Equation 2.
Figure 2: FIFO Method Illustration
}
)
max(
|
{
,
d
d
D
t
D
d
elect i i idlei (2)
In Equation 2, it can be seen that the pickup request will be allocated to the driver with the highest idle time. If there is not any driver in the queue when the pickup request occurs, the passenger must wait until there is a taxi joins the queue. This condition is possible and well managed in location such as mall, railway station, or airport because in taxi stands, the passenger comes to the taxi location. So, the distance between passenger and driver is zero.
3. PROPOSED MODEL
In this research, there are three combination methods. In the first method, both FIFO and nearest driver methods are weighted and then they are summed. The pickup request then will be allocated to the driver with the highest value of the summation. In the second method, the pickup request will be allocated to the available driver with highest idle time in certain broadcast area. If there are more than one drivers, the pickup request is allocated to the nearest driver with the same highest idle time. In the third method, the driver-passenger distance and driver’s idle time are divided into classes. Each class is scored. Then, the driver-passenger distance score is summed with driver’s idle time score. The pickup request is then allocated to the driver with the highest summation value.
In the first method, both driver-passenger distance (r) and driver idle (tidle) time are weighted. Variable wd is passenger-driver weight. Variable wt is driver idle time weight. In this method, we also define the maximum driver-passenger distance (rmax) and maximum driver idle time (tmaxidle). Variable g is the total weighted value. The method is described in Equation 3 to Equation 6. In Equation 3, it can be seen that pickup request will
be allocated to driver with highest g value. Based on equation 4, Total g value is the summation of weighted passenger-driver distance factor (gr) and weighted driver idle time factor (gt). Current time is symbolized with tcur. Driver arrival time is symbolized with tarr.
}
)
max(
|
{
d
d
D
g
D
d
elect (3)t
r
g
g
g
(4)r
r
w
g
r
r.
max (5)idle idle t t
t
t
w
g
max.
(6) t rw
w
1
(7)arr cur
idle
t
t
t
(8)The example of the first example is as follows. Suppose that we have five drivers {d1, d2, d3, d4, d5}. The driver’s idle time is {5, 10, 8, 7, 15} minutes. The driver-passenger distance is {0.5, 2, 2.5, 0.2, 1} kilometers. The rmax is set 1 kilometer. The tmaxidle is set 5 minutes. The wt is set 0.5. So, the wr is 0.5. The results are as follows. The gr set is {1, 0.25, 0.2, 2.5, 0.5}. The gt set is {0.5, 1, 0.8, 0.7, 1.5}. The g set is {1.5, 1.25, 1, 3.2, 2}. Based on the g value, the pickup request is allocated to driver d4.
In the second method, the process is divided into two steps. In the first step, system will search drivers in the broadcast area. Broadcast area is circle area with specific range (rb) that surrounds the passenger. If there are drivers in the broadcast area, then system will choose the driver with the highest idle time. If there is only one driver with highest idle time, pickup request then will be allocated to the driver and the process stops. The second step is not needed. If there are more than one drivers with same highest idle time, the process will continue to the second step. In the second step, the system will choose the nearest driver among the highest idle time drivers. This process is described in Equation 9 to Equation 11.
}
|
{
bba
d
r
r
D
(9))}
max(
|
{
maxidle
d
d
D
bat
idleD
(10) [image:4.612.314.509.174.319.2]6240 The example of the second method is as follows. There are five drivers with driver’s idle time and driver-passenger distance are as mentioned in the first example. Suppose that the broadcast area radius is 2 kilometers. So, the Dba consists of {d1, d2, d4, d5}. Based on data in Dba, driver with highest tidle value is driver d5. So, the pickup request is allocated to driver d5.
In the third method, both driver’s idle time and driver-passenger distance are divided into certain classes. The number of class is same between driver’s idle time class and driver-passenger class. For example, if the tidle is divided into five classes then r will divided into five classes too. The number of class is symbolized with n. Each class has specific discrete score. For example, if the class is divided into five classes, then the score is ranged from 1 to 5. In tidle class, highest score is for the highest tidle class. In r class, highest score is for nearest driver class. tidle score is symbolized with st. r score is symbolized with sr. Variable stot is the summation between sr and st. Pickup request is allocated to driver who has highest stot score. This method is explained in Equation 12 and Equation 13.
}
)
max(
|
{
d
d
D
s
D
d
elect tot (12)t r
tot
s
s
s
(13)Each class is separated with some thresholds. Threshold for tidle class is symbolized with Tt. Threshold for r is symbolized with Tr. For example, if the tidle class is divided into two class and the Tt is 5 minutes then if the tidle is 10 minutes then the st is 2. In the other hand, if the tidle is 3 minutes, then st is 1. This method is described in Equation 14 and Equation 15.
1 , 2 , 1 2 1 , 1,
...
,
,
n r n r r rT
r
v
T
r
T
v
T
r
v
s
(14)
1 , 2 , 1 , 2 1 , 1,
...
,
,
n t idle n t idle t t idle tT
t
u
T
t
T
u
T
t
u
s
(15)The example of the third methods is as follows. There are five drivers with tidle and r are as
mentioned in the first example. There are three classes for tidle. Tt,1 is 5 minutes and Tt,2 is 10 minutes. So, the st for d1 to d5 is {1, 2, 2, 2, 3}. Tr,1 is is 1 kilometer and Tr,2 is 2 kilometers. So, the sr for d1 to d5 is {3, 2, 1, 3, 3}. Based on Equation 13, the stot for d1 to d5 is {4, 4, 3, 4, 5}. Based on Equation 12, the pickup request will be allocated to d5.
4. DISCUSSION
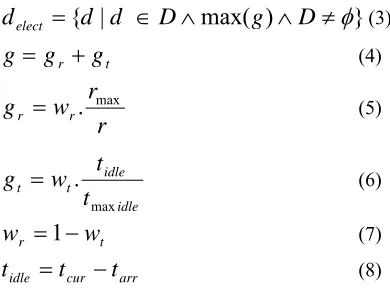
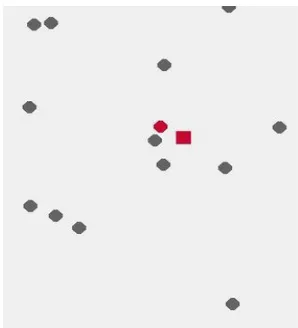
The proposed model then is implemented into motorcycle taxi dispatch simulation. The simulation is developed based on PHP language. The simulation is not time variant. The world is virtual square area. The length and width are 5 kilometers. The scenario is as follows. First, 60 drivers are created with specific location and idle time. Then 30 passengers arrive and create pickup request consecutively. The passenger arrives with specific pickup location. For driver whom is allocated to the pickup request, the driver then will be deleted from the simulation. The simulation visualization can be seen in Figure 3. Grey circle represents driver that does not get allocation. Red circle represents driver that gets allocation. Red square represents passenger.
[image:5.612.328.502.516.707.2]In this simulation, some parameters are generated randomly. Driver’s location and passenger’s pickup location follow uniform distribution. The driver’s idle time and pickup speed follow Poisson distribution. In this scenario, the average value of driver’s idle time is set 15 minutes. The average value of driver’s pickup speed is set 20 kilometers per hour.
6241 In this test, we observe three parameters: average driver’s idle time, average driver’s pickup distance, and average passenger’s waiting time. As they are mentioned in Section 2, these three parameters are critical in taxi service. Passenger waiting time is critical for customer satisfaction [4,10]. Longer passenger waiting time may reduce customer satisfaction. Meanwhile, driver’s idle time or condition that the taxi is empty [4,6,21] and driver’s pickup distance [4,8] are critical aspects for driver productivity. Longer driver’s idle time will reduce driver productivity. Longer pickup distance will reduce driver net income because the cost will increase.
The observed data is collected only based on successful pickup request. This data is compared based on five methods. The first method is nearest driver method. The second method is FIFO method. The third method is weighted nearest driver-FIFO method. The fourth method is serial nearest driver-FIFO method. The fifth method is scored driver- FIFO-nearest driver method.
[image:6.612.315.518.129.676.2]In the first test, we run nearest driver method. In the second test, we run FIFO method. There are 20 trials. The nearest driver method result is described in Table 1. The FIFO method result is described in Table 2. The nearest driver method visualization can be seen in Figure 4. The FIFO method visualization can be seen in Figure 5.
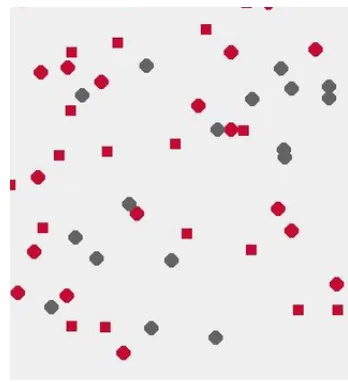
Figure 4: Nearest Driver Simulation Visualization
In Figure 4, it can be seen that the driver who get the pickup allocation is the driver who is nearest to the passenger. The red circle position is the nearest circle to the red square among all circles
in the system. Based on the visualization, the nearest driver method runs properly.
Table 1. Nearest Driver Method
Trials rpickup (km)
Tidle (minutes)
twait (minutes)
1 0.43 16 1.35
2 0.37 15.77 1.05
3 0.35 14.83 1.18
4 0.29 15.77 0.94
5 0.32 14.83 1.12
6 0.31 14.5 1.01
7 0.33 14.97 0.97
8 0.39 14.2 1.17
9 0.34 14.7 1.03
10 0.37 15.43 1.25
11 0.39 14.56 1.46
12 0.38 16.17 1.24
13 0.29 14.87 0.96
14 0.35 16.07 1.17
15 0.34 14.53 0.98
16 0.37 15.47 1.12
17 0.35 15.6 1.14
18 0.42 15.33 1.33
19 0.31 13.2 0.93
20 0.34 13.9 1.07
Average 0.35 15.04 1.12
Table 2. FIFO Method
Trials rpickup
(km) (minutes) tidle (minutes) twait
1 2.03 11.56 6.57
2 1.93 12 5.73
3 2.19 11.8 7.41
4 2.03 11.43 8.47
5 2.24 12.46 7.68
6 2.08 12.7 6.97
7 2.09 12.26 7.28
8 2.17 12.17 6.95
9 1.89 12.53 6.37
10 2.35 10.93 8.16
11 2.27 12.97 6.82
12 2.23 11.53 6.67
13 2.04 12.1 6.1
14 2.23 11.7 6.52
15 1.93 11.43 6.3
16 2.11 12.57 7.22
17 1.98 11.9 6.08
18 1.97 11.97 8.81
19 2.29 13.01 7.45
20 1.99 12.03 6.52
Average 2.10 12.05 7.01
[image:6.612.114.275.460.630.2]6242 drivers because the pickup distance is not far. Usually, the threshold is 1 kilometer. The average driver’s idle time is 15.04 minutes. This value is close to the average driver’s idle time in the system. The average passenger’s waiting time is 1.12 minutes. This value is acceptable for passenger.
[image:7.612.320.517.108.236.2]
Based on data in Table 2, the average pickup distance is 2.1 kilometers. This value is not good for driver because the pickup distance is too far. The average driver’s idle time who gets pickup request is 12.05 minutes. Even this value is below the average driver’s idle time in the system, the gap is close. It affects the passenger’s waiting time. In FIFO model, the passenger’s waiting time is almost seven times than the nearest driver model.
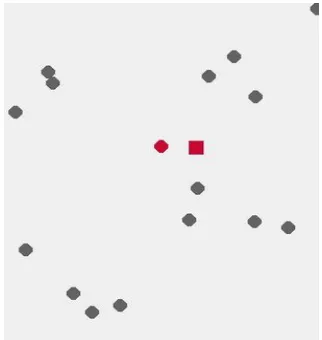
Figure 5: FIFO Simulation Visualization
Based on the visualization in Figure 5, it can be seen that in FIFO method, the driver who gets pickup allocation may be not the nearest driver to the passenger. In Figure 5, there are at least three drivers whose location is nearer to the passenger. For passenger, he will get longer waiting time. For the driver, he will travel longer pickup distance.
[image:7.612.112.278.288.471.2]
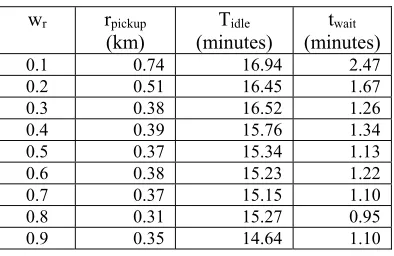
In the third test, the dispatch system uses the weighted nearest driver-FIFO method. In this test, the tmaxidle is 10 minutes. The rmax is set 2 kilometers. The wr is set from 0.1 to 0.9 with the step is 0.1. in every step, we run 10 trials. The result is shown in Table 3. The visualization can be seen in Figure 6.
Table 3. Weighted Nearest Driver-FIFO method
wr rpickup
(km) (minutes) Tidle (minutes) twait
0.1 0.74 16.94 2.47
0.2 0.51 16.45 1.67
0.3 0.38 16.52 1.26
0.4 0.39 15.76 1.34
0.5 0.37 15.34 1.13
0.6 0.38 15.23 1.22
0.7 0.37 15.15 1.10
0.8 0.31 15.27 0.95
0.9 0.35 14.64 1.10
Based on data in Table 3, it can be seen that the pickup distance decreases when the wr increases. In this model, for all wr value, the average pickup distance is below 1 kilometer. This result meets driver’s interest. It makes the passenger’s waiting time is low. The maximum passenger’s waiting time is 2.47 minutes when the wr is 0.1. After the wr value is 0.2, the passenger’s waiting time is stagnant and it is close to 1 minutes. Meanwhile, the average driver’s idle time for drivers who get the pickup request is still near the average value of all drivers’ idle time in the system.
In Figure 6, the wr is 0.9. It means that the passenger-driver distance aspect is dominant. Based on result in Figure 6, it can be seen that by the domination of the distance factor, the driver who gets pickup allocation is the driver who is the nearest driver to the passenger. Based on the visualization, the simulation runs properly.
Figure 6: Weighted Nearest Driver-FIFO Simulation Visualization
[image:7.612.341.492.483.659.2]6243 The result is shown in Table 4. The simulation visualization can be seen in Figure 7.
Table 4. Serial FIFO-Nearest Driver Method with 2 Kilometers Broadcast Range
Trials rpickup
(km) (minutes) Tidle (minutes) twait
1 1.03 11.9 3.34
2 1.09 11.5 4.27
3 1.29 11.9 3.95
4 0.98 12.73 3.11
5 1.09 12.2 3.7
6 1.14 11.6 3.59
7 1.16 10.9 3.56
8 1.19 11.4 4.21
9 1.02 12.57 2.97
10 1.04 11.57 3.62
11 0.98 12.43 3.27
12 0.89 11.33 2.76
13 1.16 11.33 3.74
14 1.08 12.2 3.6
15 1.1 11.83 3.58
16 0.98 12.33 4.78
17 1.07 12.1 3.31
18 0.99 13.4 3.27
19 1.38 12 4.33
20 1.03 10.93 3.6
Average 1.08 11.91 3.63
[image:8.612.96.294.155.410.2]Based on data in Table 4, it can be seen that the driver’s pickup distance is at the border line between near and far. The average value is 1.08 kilometers. It makes the passenger’s waiting time is low too and the value is 3.63 minutes and it is still below 5 minutes. The average driver’s idle time is 11.91 minutes and it is lower than the average driver’s idle time in the system.
Figure 7: Serial Nearest Driver-FIFO Simulation Visualization
In Figure 7, the broadcast range is 0.5 kilometers. Based on the visualization, it can be seen that the pickup request is allocated to the driver who is the near to the passenger.
To observe different condition, the broadcast range then is reduced so that its value is 0.5 kilometer. The goal is to reduce the driver’s pickup distance. The result is described in Table 5.
Table 5. Serial FIFO-Nearest Driver Method with 0.5 Kilometers Broadcast Range
Trials rpickup (km)
Tidle (minutes)
twait (minutes)
1 0.31 13.44 0.95
2 0.35 13.44 1.15
3 0.33 14.59 1.12
4 0.3 14.31 0.97
5 0.27 14.29 0.92
6 0.3 13.76 1.01
7 0.34 13.57 1.03
8 0.27 13.72 0.94
9 0.31 13.41 0.97
10 0.38 12.72 1.18
11 0.29 12.39 0.93
12 0.33 13.35 1.04
13 0.33 13.28 1.07
14 0.33 13 1.05
15 0.31 12.46 0.94
16 0.34 13.04 1.05
17 0.31 13.56 1.02
18 0.29 12.08 0.88
19 0.34 14.83 1.07
20 0.34 12.78 1.23
Average 0.32 13.40 1.03
Based on data in Table 5, the result is as follows. The average driver’s pickup distance is 0.32 kilometers. The average driver’s idle time is 13.4 minutes. The passenger’s waiting time is 1.03 minutes. So, reducing the broadcast range from 2 kilometers to 0.5 kilometer has reduced driver’s pickup distance and passenger’s waiting time significantly. In the other hand, the average driver’s idle time increases but not significant.
[image:8.612.318.517.235.492.2] [image:8.612.119.268.521.685.2]6244
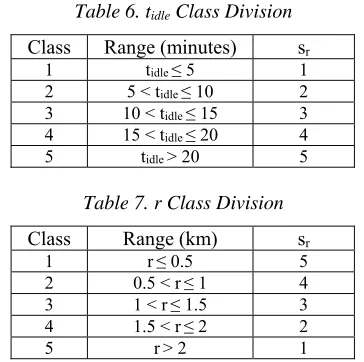
Table 6. tidle Class Division
Class Range (minutes) sr
1 tidle ≤ 5 1
2 5 < tidle ≤ 10 2
3 10 < tidle ≤ 15 3
4 15 < tidle ≤ 20 4
5 tidle > 20 5
Table 7. r Class Division
Class Range (km) sr
1 r≤ 0.5 5
2 0.5 < r≤ 1 4
3 1 < r≤ 1.5 3
4 1.5 < r≤ 2 2
5 r> 2 1
Based on data in Table 8, it can be seen that the average driver’s pickup distance is 0.53 kilometer. It is good for driver. It makes the passenger’s waiting time is low too. Meanwhile, the average driver’s idle time is near to the average driver’s idle time in the system.
[image:9.612.317.518.135.454.2]To create better result, the r class division is modified. The class width is 300 meters. The Tr class division is {0.3, 0.6, 0.9, 1.2}. The r class division is described in Table 9. The result is described in Table 10.
Table 8. Scored FIFO-Nearest Driver method
Trials rpickup (km)
Tidle (minutes)
twait (minutes)
1 0.47 14.6 1.61
2 0.41 15.7 1.36
3 0.47 16.57 1.54
4 0.65 15.3 2.05
5 0.48 15.7 1.59
6 0.54 15.27 1.67
7 0.39 16.4 1.32
8 0.58 15.7 1.91
9 0.52 15.8 1.75
10 0.59 15.9 1.83
11 0.59 16.1 1.87
12 0.54 15.9 1.69
13 0.55 15.63 1.82
14 0.58 15.93 2
15 0.44 15.73 1.43
16 0.49 15.9 1.6
17 0.61 16.2 1.99
18 0.77 16 2.57
19 0.5 16.63 1.59
20 0.47 14.87 1.53
Average 0.53 15.79 1.74
Table 9. r Class Division
Class Range (km) sr
1 r≤ 0.3 5
2 0.3 < r≤ 0.6 4
3 0.6 < r≤ 0.9 3
4 0.9 < r≤ 1.2 2
5 r> 1.2 1
Table 10. Scored FIFO-Nearest Driver method
Trials rpickup (km)
Tidle (minutes)
twait (minutes)
1 0.63 16.1 2.03
2 0.51 16.33 1.63
3 0.35 14.6 1.05
4 0.5 15.53 1.63
5 0.43 15 1.35
6 0.74 15.8 2.36
7 0.45 15.5 1.39
8 0.36 14.57 1.35
9 0.41 15.9 1.3
10 0.43 15.23 1.3
11 0.51 15.6 1.71
12 0.77 16 2.52
13 0.49 15.67 1.58
14 0.44 14.27 1.62
15 0.55 15.5 1.9
16 0.59 15.97 1.76
17 0.42 15.43 1.34
18 0.39 15.13 1.3
19 0.75 16.2 2.32
20 0.54 15.93 1.66
Average 0.51 15.51 1.66
[image:9.612.95.293.457.711.2]Based on data in Table 10, the difference is not significant. This condition occurs in these three parameters. It means that reducing class width in r class from 0.5 kilometers to 0.3 kilometers does not make significant difference.
Figure 8: Scored FIFO-Nearest Driver Simulation Visualization
[image:9.612.348.485.531.666.2]6245 nearest driver. As it is seen in Figure 7, there are several drivers whose location is near to the driver. Unfortunately, the pickup order is allocated to the further driver.
Comparing data between Table 1 and Table 2, the analysis is as follows. By using nearest driver method, the average driver’s pickup distance and the passenger’s waiting time is much better than by using FIFO model. By using nearest driver, the driver’s pickup distance is only 16.67 percents and the passenger’s waiting time is 16.04 percents than the by using FIFO method. So, the gap is very significant. In the other hand, by using FIFO method, the average driver’s idle time is 80 percents than by using nearest method. It means the gap is not significant.
Nearest driver method then is compared with weighted nearest driver-FIFO method by comparing data in Table 1 and in Table 3. When wr is 0.9, the average driver’s pickup distance is equal between nearest driver method and weighted nearest driver-FIFO method. By using weighted nearest driver-FIFO method, the average driver’s idle time is 97 percents than by using nearest driver. By using weighted nearest driver-FIFO method, the average passenger’s waiting time is 91.67 percents than by using nearest driver method. So, it can be said that when wr is 0.9, weighted nearest driver-FIFO method gives better performance than nearest driver method.
Nearest driver method is compared with serial FIFO-nearest driver method when the broadcast range is 2 kilometers by comparing data in Table 1 with data in Table 4. By using nearest driver method, the driver’s pickup distance is 32.46 percents and the passenger’s waiting time is 30.97 percents than by using serial FIFO-nearest driver method. Meanwhile, by using serial FIFO-nearest driver, the average driver’s idle time is 79.19 percents than by using nearest driver method. So, based on the driver’s pickup distance and passenger’s idle time, the serial FIFO-nearest driver is in the middle between nearest driver method and FIFO method.
When the broadcast range is reduced so that the broadcast range is 0.5 kilometer, the comparison produces different result. By using serial FIFO-nearest driver method, the driver’s pickup distance, driver’s idle time, and passenger’s waiting time is 90.48 percents, 89.13 percents, and 91.32 percents. So, when the broadcast range is 0.5
kilometers, serial FIFO-nearest driver method is better than nearest driver method.
Nearest driver method is compared with scored FIFO-nearest driver method by comparing data in Table 1 with data in Table 8. By using nearest driver method, the driver’s pickup distance, average driver’s idle time, and passenger’s waiting time are 66.16 percents, 95.21 percents, and 0.65 percents than by using scored FIFO-nearest driver method. So, nearest driver method is still better than scored FIFO-nearest driver method.
5. CONCLUSION AND FUTURE WORK
Based on the explanation in previous sections, the conclusion is as follows. All proposed models have been implemented into the motorcycle taxi dispatch simulation successfully. Comparing nearest driver method and FIFO method, it is proven that nearest driver is better in driver’s pickup distance and passenger’s waiting time significantly. Meanwhile, FIFO method is better in average driver’s idle time but the gap is not significant. Comparing nearest driver method with weighted FIFO-nearest driver method, when the driver-passenger distance factor is significant, in driver’s pickup distance and passenger’s waiting time aspects, the value is similar but weighted nearest driver-FIFO method is better than nearest driver method in driver’s idle time parameter. Comparing nearest driver method with serial FIFO-nearest driver method, when the broadcast range is 2 kilometers, nearest driver method is better than serial FIFO-nearest driver method in driver’s pickup distance and passenger’s idle time parameters. Meanwhile, when the broadcast range is 0.5 kilometers, serial FIFO-nearest driver method is better than nearest driver method. Comparing nearest driver method with scored FIFO-nearest driver method, nearest driver method is better than scored FIFO-nearest driver method.
6246 between locations is various so that the simulation may present better representation.
In the future, there are many research potentials in online motorcycle taxi dispatch system. There are more parameters that is interesting to be explored, such as driver’s performance, driver’s revenue, passenger’s maximum waiting time, driver’s maximum pickup distance, etc. Dispatch system with more than one motorcycle taxi providers in single dispatch system is a challenging research. In the real life, there are some online motorcycle taxi providers with their own dispatch method. So, the simulation that implements multi dispatch system will be interesting to be explored. The collaboration method between online and offline motorcycle taxi is needed to be developed so that the conflict among them can be minimized.
REFRENCES:
[1] I. Budiari, “2015, Year of the Rise of App=based Motorcycle Taxi”, The Jakarta Post, 2016, January 6, http://www.thejakartapost.com/news/2016/01/0 6/2015-year-rise-app-based-motorcycle- taxi. html
[2] N. Jenkins, “Uber Has Launched a Motorbike Service in Jakarta”, Time, 2016, April 13,
http://time.com/4291825/uber-motor-motorcycle-motorbike-jakarta-indonesia-gojek/ [3] F. Susanty, “Grab to Invest $700 Million in Indonesia”, The Jakarta Post, 2017, February 2, http://www.thejakartapost.com/news/2017/02/0 2/grab-to-invest-700-million-in-indonesia.html. [4] K.T. Seow, N.H. Dang, D.H. Lee, “A
Collaborative Multiagent Taxi-Dispatch System”, IEEE Transactions on Automation Science and Engineering, vol 7(3), 2010,
pp.607-616.
[5] K.T. Seow, N.H. Dang, D. Lee, “Toward An Automated Multiagent Taxi-Dispatch System”,
IEEE International Conference on Automation Science and Engineering, 2007, September
22-25, Scottsdale.
[6] F. Miao, S. Han, S. Lin, G.J. Pappas, “Robust Taxi Dispatch Under Model Uncertainties”,
Proceeding of 54th IEEE Annual Conference on
Decision and Control, 2015, December 15-18,
Osaka.
[7] Z. Liao, “Taxi Dispatching via Global Positioning Systems”, IEEE Transactions on
Engineering Management, vol 48(3), 2001,
pp.342-347.
[8] C. Qiao, M. Lu, Y. Zhang, K.N. Brown, “An Efficient Dispatch and Decision-Making Mode for Taxi Booking Service”, Proceeding of 12th
IEEE International Conference on Ubiquitous Intelligence and Computing, 2015, August
10-14, Beijing.
[9] C. Ivan, R. Popa, “A Cloud Based Mobile Dispatching System with Built In Social CRM Component: Design and Implementation”,
Computers, vol 4, 2015, pp.176-214.
[10] D. Santani, R.K. Balan, C. J. Woodard, “Spatio-Temporal Efficiency in a Taxi Dispatch System”, 2008, report.
[11] M. Maciejewski, “Online Taxi Dispatching via Exact Offline Optimization”, Logistyka, vol 4,
2014.
[12] F. Miao, S. Lin, S. Munir, J.A. Stankovic, H. Huang, D. Zhang, T. He, G.J. Pappas, “Taxi Dispatch With Real Time Sensing Data in Metropolitan Areas: A Receding Horizon Control Approach”, IEEE Transactions on Automation Science and Engineering, vol
13(2), 2016.
[13] A. Kim, M.E. Lewis, C.C. White, “Optimal Vehicle Routing with Real-time Traffic Information”, IEEE Transactions on Intelligent Transportation Systems, vol 6(2), 2005,
pp.178-188.
[14] Y. Zhao, “Mobile Phone Location Determination and Its Impact on Intelligent Transportation Systems”, IEEE Transactions on Intelligent Transportation Systems, vol 1(1),
2000, pp.55-64.
[15] Y.L. Ygnace, C. Drane, “Cellular Telecommunication and Transportation Convergence: A Case Study of Research Conducted in California and in France on Cellular Positioning Techniques and Transportation Issues”, Proceedings of 2001 IEEE Intelligent Transportation Systems, 2001,
August 25-29, Oackland.
[16] L.M. Matias, J. Gama, Michel Ferreira, J.M. Moreira, L. Damas, “Predicting Taxi-Passenger Demand Using Streaming Data”, IEEE Transactions on Intelligent Transportation Systems, vol 14(3), 2013, pp.1393-1402.
[17] M. Chen, X. Zhao, “Vacant Taxi Strategies and System Performance of Cruising Taxi Operation System”, Proceeding of International Conference on Electric Technology and Civil Engineering, 2011, April
6247 [18] B. Li, D. Zhang, L. Sun, C. Chen, S. Li, G. Qi,
Q. Yang, “Hunting or Waiting? Discovering Passenger Finding Strategies from a Large Scale Real World Taxi Dataset”, Proceeding of IEEE International Conference on Pervasive Computing and Coomunication Workshops,
2011, March 21-25, Seattle.
[19] S. Phithakkitnukoon, M. Veloso, C. Bento, A. Biderman, C. Ratti, “Taxi Aware Map: Identifying and Predicting Vacant Taxis in the City”, Proceeding of International Joint Conference on Ambient Intelligence, 2010,
November 10-12, pp.86-95, Malaga.
[20] Y. Lu, S. Xiang, W. Lu, “Taxi Queue, Passenger Queue or No Queue? A Queue Detection and Analysis System Using Taxi State Transition”, Proceeding of 18th
International Conference on Extending Database Technology, 2015, March 23-27,
Brussels.