ORIGINAL RESEARCH ARTICLE
CHARACTERIZATION OF THE ATMOSPHERE TO THE PASSAGE OF SQUALL LINES AT
DAKAR FROM 1968 TO 2006
*1
Diop Bouya,
3Sow Bamol Ali,
1Malick Wade,
1Diene Ndiaye,
2Yao Tchétché,
1Abdou Karim
Farota,
1Abdoulaye Bouya DIOP and
4Daouda Badiane
1
Laboratory of Atmospheric Sciences and Oceans (LAOS), University Gaston Berger de Saint Louis (Senegal)
2
University of Abobo-Adjame (Ivory Coast)
3
University of Ziguinchor (Senegal)
4
University Cheikh Anta Diop of Dakar (Senegal)
ARTICLE INFO ABSTRACT
By performing a composite analysis of the vertical profile of humidity, temperature and wind on the basis of radiosounding data and rain gauge Dakar Yoff (Senegal) at 14 ° 44 N and 17 ° 30 W, in the period 1968-2006, we studied exchanges water, heat and momentum within the squall line (SL) and between it and its immediate environment. A similar analysis has been performed with the re-analysis of NCEP / NCAR for the period 1981-1995 for the specific humidity at a grid point near Dakar (15° N and 17 ° 30 W). A statistical study of clouds and rain, combined with the composite analysis of moisture profile showed that the precipitations generated by the squall line (SL) are mainly from the convective part. With less than ten hours before the passage of the squall line, there is an increase in relative humidity in the lower layers of the atmosphere. The passage of this, the humidity is maximum in the layer 700-600 hPa. After its passage, humidity decreases gradually in the lower and middle layers. Analysis of the results obtained on the basic parameters of the data with NCEP / NCAR shows that the vertical distribution of the atmosphere is disturbed at the passage of a SL; the composite analysis yielded 48 temporal classes.
The state of the atmosphere during the 24 hours preceding the passage of SL is characterized by: - A net warming at 700hPa up to 6 hours before;
- A significant crowding in the layer 850-700 hPa up to 13 hours before; - A west wind at 925 hPa between 10 and 5 hours before;
- An increase in wind speed at 700hPa up to 15 hours before. During the passage of SL, the characteristics of the atmosphere are:
- A strong cooling in the layer located below 600hPa; - A noticeable humidification in the layer 850-700hPa;
- A strong east wind at 700 hPa between 4 hours and 9 hours later.
Copyright © 2019, Diop Bouya et al. This is an open access article distributed under the Creative Commons Attribution License, which permits unrestricted use, distribution, and reproduction in any medium, provided the original work is properly cited.
INTRODUCTION
Squall lines (SL) incorrectly referred to as tornadoes occur in the boreal summer in the Sahel from east to west. They generally weaken gradually, reaching the coast of West Africa (Aspliden, 1976). The disturbances are SL convective rainfall. They are as a juxtaposition of grains formed in cumulonimbus (Cb) along a north-south line.
*Corresponding author: Diop Bouya,
Laboratory of Atmospheric Sciences and Oceans (LAOS), University Gaston Berger de Saint Louis (Senegal)
A low pressure in front of the SL followed by deep Monsson, are the conditions governing its organization on a large scale (Desbois, 1988), although local conditions (high air temperature, high relative humidity level soil and a relatively calm wind) that promote the development of convection are needed (Pujol, 2011), are the conditions governing its large-scale organization (Desbois, 1988), even if local conditions that favor the development of convection are required (Pujol, 2011). On satellite imagery, the SL looks like cloud mass whose western edge is sharp and convex, the eastern edge is more diffuse. Its north-south extent is generally between 300
ISSN: 2230-9926
International Journal of Development Research
Vol. 09, Issue, 01, pp.25039-25047, January, 2019
Article History: Received 03rd October, 2018
Received in revised form 11th November, 2018
Accepted 21st December, 2018
Published online 30th January, 2019
Key Words:
Composite Analysis, Squall lines, Rain, Radiosounding, reanalysis.
Citation: Diop Bouya, Sow Bamol Ali, Malick Wade, Diene Ndiaye, et al. 2019. “Characterization of the atmosphere to the passage of squall lines at Dakar from 1968 to 2006”, International Journal of Development Research, 9, (01), 25039-25047.
and 800 km, but can reach 1500 km (John Rozbicki and George Young, 2012). Studies of (Bryan, 2012), showed 75% of rainfall in the Sahel area come from SL precipitation. In this climate zone thepeople draw their from subsistence agro-pastoral activities. This phenomenon of primary importance was the subject of numerous studies, primarily descriptive and dynamic (Lothon, 2011 and Gaye, 2005). Here we describe the vertical water structure of the atmosphere before, during and after the passage of SL. We tried to explain the transfer of water masses in the SL and between it and its immediate environment. By a composite method of analysis, we determine the average vertical profiles of moisture and the temporal structure of rain associated to334 SL, radio soundings of Dakar from 1968 to 2006 helped highlight the features of the SL water. Then we present the composite analysis, the results for a two-hour class time using radio sounding and a finer scale (amplitude of one hour) analysis using the re-analyses of NCEP from NCAR. This climatological study over several years of meteorological parameters of this climate zoneis a boon available to operational forecasters West African meteorology and researchers from the world of atmospheric physics.
MATERIALS AND METHODS
The theoretical support of the study is the composite analysis. This method has been used by (Reed, 1977) and (Burpee, 1976) and by many other authors to study the structure of easterly waves. The spatial division of the phenomenon into categories can adapt a template for each event and average these events and, even though their dimensions are different. If the phenomenon we are trying to describe has a physical reality, the results of all averages taken show the weather have a coherent structure. This method is well suited to the phenomena. We adapted this technique for the characterization of SL from setting water like several other authors (Diop, 1995), to study the energy exchange in the SL from the radiosounding of Dakar, (http://www.crh.noaa.gov/ sgf/?n=spotter_squall_lines#Squall%20Line%20), to highlight the characteristics of theSL phenomenon approaching the coast of West Africa from the analysis of the European Centre for Medium-Range Weather Forecasts (ECMWF). (Gaye, 2005), using GATE data on the Atlantic, gave a detailed overview of the structure, dynamics and life cycle of an SL and (Arnault, 2011) from two surveys launched in Korhogo in Ivory Coast has studied the vertical structure of the atmosphere before and after the passage of SL experience Deep Tropical Convection (COPT 81).
Description of the classes in the composite analysis
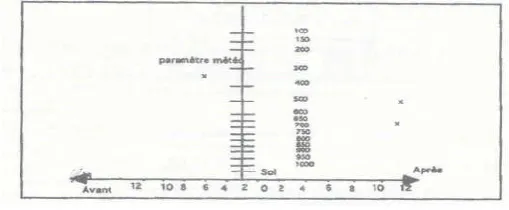
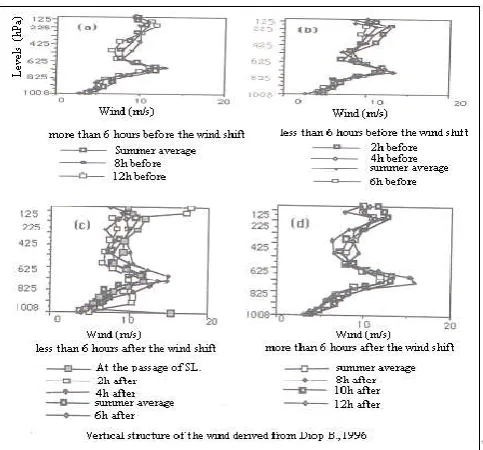
Using soundings launched between 1968 and 2006 at Dakar we have proceeded to a climatological study of the meteorological parameters (Absolute temperature, Wind speed, Wind direction, Relative Humidity) at the passage of SLs. During this period, we have two radio soundings per day, launched at 1200 TU and 0000TU. After selecting 15 pressure levels (ground, 1000, 950, 900, 850, 800, 750, 700, 650, 600, 500, 400, 300, 200, 100hPa), we performed a composite analysis by regrouping all radio-soundings in different temporal of 2-hours each, for the whole 38 years of data and at all levels. 24 hours for meteorological parameters are divided into 13 categories (class time). Classes (Figure 1) before the passage of the SL are then: 2 hours (2 hours before), -4 hours (4 hours before), 6 hours (6 hours before), -8 hours (8 hours
[image:2.595.307.562.228.333.2]before) ,-10 hours (10 hours before), -12 hours (12 hours before). The zero hour class corresponds to the passage of SL, which coincides with radio sounding. Note that in reality, the time of wind shift (which marks the arrival of SLs) is chosen as the origin of thereferencedates (Figure 1). The passages in the wake of SL are then: 2 hours (2 hours after), 4 hours (4 hours after), 6 hours (6 hoursafter), 8hours (8 hoursafter), 10 hours (10 after), 12 hours (12 hoursafter). For class i hours before the passage (i = 2, 4, 6, 8, 10, 12), we put all radiosoundings assigned in the time interval between i+1 and i-1 hour before the passage of the SL. For class j hours after passage (j = 2, 4, 6, 8, 9, 10, 12), we put all radiosoundings assigned in the time interval between j+1 and j-1 hour after the passage of the SL.
Figure 1. Marking associated with the squall line
Validity of the method: The structure of the parameters
obtained by this analysis in Figure 2 are in good agreement with the results of numerical simulation and the radar given by (Lafore, 2010). In comparing these two results we find that we have qualitatively similar profiles Figure 2, 3, 4 and 5.
RESULTS-INTERPRETATION
We identified 334 passages of SL and examined the profiles of the mean parameters of the atmosphere from the radiosounding associated with them. To study the water exchange of the atmosphere under the influence of SL, we used the relative humidity derived from radiosounding, cloud cover and rainfall data obtained from the observation notebook and monthly climatological table of the Directorate of Meteorology of Senegal. These data are combined with SL We compared the results of the specific humidity soundings from a grid point of NCEPT / NCAR near Dakar.
Relative Humidity at the ground
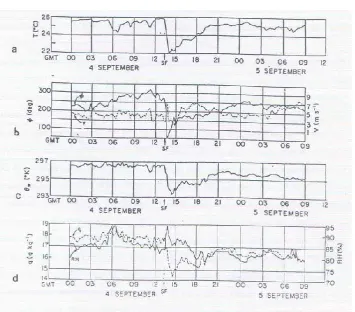
Figure (2c) shows that pre-ground atmospheric SLreveals a humidity with a peak slightly above 86%. It becomes more humid and between 0heure 4hour after wind shift associated with the LG, with values of 86-88%. The atmosphere returns to its minimum well after the transition to 10 hours with a relative humidity of about 78%. Ground relative humidity is important after the wind shift, especially in class 2 hours and 4 hours later. The evolution of the moisture is out of phase with that of the temperature state in Figure 2b.
Relative humidity in altitude
Figure 6 shows that at the time of passage of the SL there is a more humid atmosphere in very low levels (1000-800hPa) compared with the summer average. In contrast atmosphere is less between 800 and 750hPa. At other levels, the two profiles are almost the same pace.
There is a humidifier in the middle class of 800-500hPa from 4 and 6 hoursat later. There is a greater moisture in the class after two hours from 1000 to 500hPa and the presence of deep
[image:3.595.98.465.65.184.2]convection between 2:00 and 6:00. 4 hours after the lower layers are drier than the atmosphere of the class after 2 hours, only the middle and upper classes are more humid.
[image:3.595.125.481.230.542.2]Figure 2. Temporal Patterns: dew point, temperature b),crelative humidity, cloud cover d)
Figure 3. Temporal variations in space: a) temperature (° C), b) wind direction (m / s), c) the pseudo adiabatic temperature wet bulb potential (K) and d) specific humidity (g / kg) and relative (%) during the GATE experiment. SF indicates the time of passage of the front
of the SL (Gaye, 2005)
[image:3.595.188.415.596.778.2]When the wind shift we find the average summer profile (Figure 6). Layer (1000-700 hPa) of the atmosphere of the class 2 hours after the wind shift is wetter than any other. Between 800 and 700hPa class two hours later, was a reduction in moisture so there was a 700-300hPa
[image:4.595.172.426.56.213.2] [image:4.595.190.397.243.429.2] [image:4.595.134.411.458.721.2]humidification of the class after 4 hours. Between 4 hours and 6 hours after the wind shift, the humidity is higher in the 750-300hPa layer (at least between 4:00 and 2:00 for the same layer). One note that at the very moment of the wind shift the relative humidity of the air has not changed much compared to Figure 5. Crossverticaltem perature perturbation, inferred from radar observations of as quall line
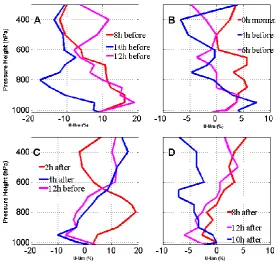
Figure 6. Profile of differences in the relative humidity of the classcompared to the average summer
the average summer. From the viewpoint of the configuration is found, the one proposed by (Lothon, 2011) and (Gaye, 2005) and we meet in the figures of (Arnault, 2011), given by the radar Dakar-Yoff in Senegal. Long before the SL (12 before) (Figure 7a) there was drying atmosphere compared to the average summer. This phenomenon is very pronounced between 800 and 750hPa. At the approach of SL (Figure 7b), there is a humidification of the atmosphere, which strengthens the layers between 1000 hPa and 800hPa, while in the lower layers drying continues. Up to 2 hours after the wind shift, the layer 1000-800hPa is very moist with a humidifier by about 10% of about halfof the absolute value of the drying in the layer 800-750hPa class 4 hours later. Between 8 hours and 12 hours after the wind shift a drying is noted with regard to thesummer average in the very low levels (1000-850hPa) and moistening between 750 and 400hPa (Figure 7c). Figure 7d shows that in class 12 hours after the wind shift there is a vertical structure of humidity similar to the pace of the class 12 hours before the passage of SL. The study of the interest to SL humidity and rainfall associated with it, requires a large-scale analysis. The lack of correlation between water vapor generated over oceans and continents available above, lead us to investigate the causes of these variations in the humidity of the atmosphere in the advection (http://ww2010.atmos. uiuc.edu/%28Gh%29/guides/mtr/svr/type/mline/sat.rxml). The flux of water vapor of interest to rain have been the subject of several studies (Defelice, 1990 and Barthe, 2011 and Druyan Leonard, 2011). The advection of water is essential for SL, which makes us say that most of the transport come from the East and is carried through the AEJ and TEJ.
The rainfall associated with squall lines
[image:5.595.306.498.344.452.2]Their measurements constitutes a basis for prediction and validation of forecasting model. The high variability of rainfall associated with the rainfall does not prevent usfrom having information on the distribution according to the different classes of temporal SL. The rainfall data that we analyzed are from the notebooks of observations of the direction of the meteorology of Dakar. They are associated with changes in the SL station Dakar-Yoff (Gooy). Figure 8 shows that most of the precipitation comes from convective SL and is concentrated in the convective part consisting of vigorous deep convective cells. The convective part of the SL takes about 2 hours on average. In this figure 8, we see that the largest cloud cover is late in relation to the convective rain.
Figure 8. Ameancloud cover before, duringand after the passage of the SL. brainassociated with the average SL
Aspects dynamic and thermal
To study the dynamic and heat transfer in the atmosphere under the influence of a squall line, we use the wind and temperature.
Wind
To address the dynamic aspect, we use the strength and direction of the wind. The average wind speed in each class is broken down into its zonal and meridian component. The observed zonal wind marked u is given by the expression 3.1:
10dd)
)(270
tan(1)/180
ffcos((arc
u
That of the meridian wind v is given by:
1/2 2 2 ) u ((ff)
v
Whereff is the wind, dd the direction given by the rose 36.
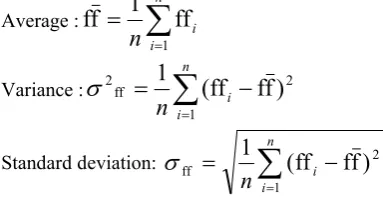
Expressions 3.3, 3.4, 3.5 show the calculations that have allowed to get the statistical values.
Average :
n i in
1ff
1
f
f
Variance :
n i in
1 2 ff 2)
f
f
ff
(
1
Standard deviation:
n i in
1 2ff
(
ff
f
f
)
1
Here n=338.
[image:5.595.46.276.593.771.2]Squall lines that we studied during the period 1968 - 2006 had the average dynamic characteristics. Recorded in Table 1. In this study period, we determine the average length of the wind shift, the average wind speed on the ground and the mean wind direction in the soil (Table 1). The results show that the disturbances are actually SL. The study of this dynamic aspect continued in altitude
Table 1. Statistics on the ground dynamic parameters as sociated with the passage of LG
Statistic Duration of thewind shift speed Direction
average 12,5 min 13m /s 10°
variance 5(min) 2 4(m /s)2 (4°)2
[image:5.595.319.546.598.630.2]Figure 9. Meantime profilesat the ground: Directiona) meridian windb) wind speedc) zonal windd)
[image:6.595.39.288.319.435.2]As we approach the SL fluctuations become more important between 600 and 200hPa (Figure 11b). We find the normal upright configuration more than 6 hours before and after the wind shift.
Figure 10. Profiles of wind speed, direction and temperatureas sociated
[image:6.595.43.285.564.789.2]The atmosphere seems more dynamically disturbed less than 6 hours after the LG as shown by the irregularity of the curves in Figure 11c. The difference between the class structures midnight and 2 hours is about 3 m / s. The vertical profile of wind direction (Figure 10c) indicates a east wind between 700 and 650hPa (flows east) and a west wind between 1000 and 800hPa (the monsoon).
Figure 11. Profiles of the wind passing SL
The meridian component is greater in the lower levels between 850 and 750 and the ground two hours after the wind shift. More than 6 hours after the passage of the SL, the atmosphere seems to return to normal summer. On the other hand, we note a rotation of the wind from west to east with the approach of SL during the transition there is a strong wind between 800 and 750 which coincide with a radiative heating (Heinrich Gustav Magnus-Tetens, 2011). Figure 10 a,b shows the presence of a prevailing wind from the southwest to the ground and in the lower layers. At altitude, between 800 and 600hPa winds are stronger (12m / s on average) above this layer there are more light winds. Figure 11c shows that of the vertical structure of the middle atmosphere in summer is almost identical to the average vertical structure of the atmosphere without the disturbance (the one where we exclude situations involving atmospheres disruption) ; it remains unchanged until the arrival of the squall lines. The remainder of this paper is made from the climatological mean summer (including disturbed situations).
Aspect heat
The temperature is directly given by the radiosounding. The dew point Td is obtained with Heinrich Gustav Magnus-Tetens Formula (Heinrich Gustav Magnus-Tetens, 2011).
Range of validity:
T measured temperature: 0 ° C <T <60 ° C
Relative humidity RH: 0.01 (1%) <HR <100 (100%) Td Dew point: 0 ° C <Td <50 ° C
) ; (
) ; (
RH T a
RH T b
Td
With:
RH T b
aT RH
T; ) ln
(
a = 17,27 et b=237,7 [°C]
Temperatures and dew points have identical time profiles on the ground (Figure 12). Figure 12 b shows a rise in temperature 2 hours before reaching a maximum at the transition from the SL and just of the wind shift with a minimum of 2 hours and 6 hours after the wind shift. The cooling ground between times zero and four hours is accompanied by a rise in relative humidity. Before the SL the difference between the temperature and dew point is fairly low, indicating high humidity.
Figure 12. Temporal Patterns ground dew point, temperature and humidity (c)
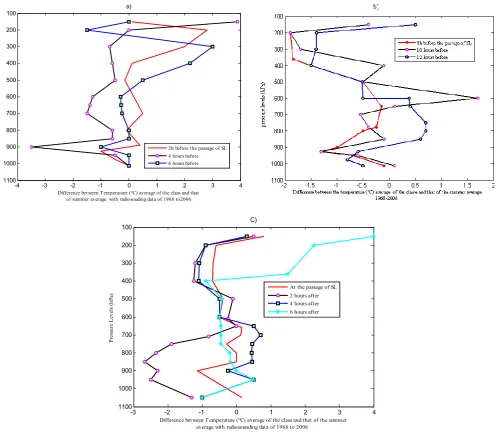
[image:6.595.315.549.611.769.2]Figure 13 a, b,c represents the vertical structures of the differences in these parameters compared to the average summer.
Between 1000 and 600hPa, we note in the zero hour classes and two hours a cooling that diminishes gradually with distance class zero. In class six hours after there is a structure quite similar to that of zero hour class between 950 and 400hPa. But it is a slice of atmosphere warmer than the summer average and the time of passage of the SL 4 hours, the layer (900-600hPa) is warmer than 6 hours, with a look almost identical to that of the average summer, but deviating by positive values between 950 and 600 hPa. More than 6 hours before the passage of the SL (Figure 13a) there is a cooling relative to the average between 950 and 800hPa, a warming in the layer (800-500hPa) and cooling between 500 and 200hPa. There is also a change from -1 to 1 degree around the average summer. Less than 6 hours before the passage of the SL (Figure 13b) we have a vertical structure of temperature that is nearly the same as the average between the ground and 600hPa. There is an increase of temperature between 500 and 200hPa. A slight warming in the 750 and 500hPa layer is obtained in the class 4 hours before we find the average structure was between 500 and 200 hPa.
Thermal fluctuations are more important for cases of more than six hours before, more than 2 hours between 950 and 600hPa.
The atmosphere within 6 hours before and after the wind shift, presents profiles that deviate from the average structure of the layer was 950-600hPa.
Profile of the atmosphere with NCEP / NCAR
To improve understanding of water exchange, thermal, and dynamic of the raining systems, type SL, we felt it necessary to use a finer time scale (of the order of hours). For this we used the data analysis re NCEP / NCAR over 15 years. We worked with the nearest point of Dakar, whose geographical coordinates are 15 ° east and 17.5 degrees north. The study data covers 51 cases of SL. We present for each level of pressure changes in various parameters according to of the class time. The values shown in Figure a, b, c, d, e are the averages of all situations. Averaged for each parameter we described the temporal variations at different levels between 24 and 24 hours after the passage of SL, we give the results for the grid point closest to Dakar. Pressure levels are 12 in
Figure 13. Difference between the average temperature of the class and that of the averagesummerof1968 to 2006 Average profilesa, b) before the passage of LG, average profile, c) after the passage of SL
-4 -3 -2 -1 0 1 2 3 4
100
200
300
400
500
600
700
800
900
1000
1100
p
res
su
re
le
v
el
s
(h
Pa)
Difference bet ween T emperature (°C) average of t he class and that of summer average with radiosouding data of 1968 to2006
a)
2h before the passage of SL 4 hours before 6 hours before
-3 -2 -1 0 1 2 3 4
100
200
300
400
500
600
700
800
900
1000
1100
Pr
e
ss
u
re
L
e
v
els
(
h
Pa)
Difference bet ween T emperature (°C) average of the class and t het of the summer average with radiosounding data of 1968 to 2006
C)
At the passage of SL 2 hours after 4 hours after
[image:7.595.53.551.96.531.2]number (1000, 925, 850, 700, 600, 500, 400, 300, 250, 200, 150 and 100hPa).
[image:8.595.36.291.122.551.2]After a composite analysis we obtained the following results
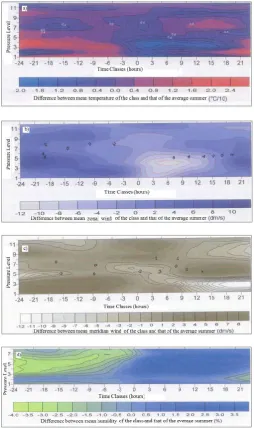
Figure 14. Profiles of the different variations of basic parameters
Results of the analysis data with composite NCEP / NCAR
With the dates of passage of SL Dakar and re-analysis NCEP / NCAR 15-Sahelian summers (1981 to 1995) to the land-sea interface, we applied a composite analysis of the basic meteorological parameters (temperature, humidity and wind). The average vertical profiles of these parameters (Figure 13) have uncovered the classical results obtained by other authors (Karan, 2010 and Lu, 1997) a decrease with altitude and temperature moisture, a west wind in the lower layers and a maximum of east wind in 700hPa representing the AEJ. Analysis of the results obtained on the basic parameters shows that the vertical distribution of the atmosphere is disturbed at the passage of a SL, the composite analysis yielded 48 temporal classes.
The state of the atmosphere in the 24 hours preceding the passage of SL is characterized by:
A net warming of around 700hPa up to 6 hours before (Figure 14 a);
A significant crowding in the layer 850-700 hPa up to 13 hours before (Figure 14 d );
A west wind at 925 hPa between 10 and 5 hours before; - An increase in wind speed is up to 15 hours before 700hPa (Figure 14 b c). At the passage of SL, the characteristics of the atmosphere are:
A strong cooling in the layer located below 600hPa; A high humidification in the layer 850-700hPa;
A strong east wind at 700 hPa between 4 hours and 9 hours later.
79 % of the rainfull come from the convective part.
DISCUSSION
(Lafore, 2010), studied the evolution between the thermodynamic mean states before and after the passage of SL during COPT81 with vertical profiles of potential temperature variations and water vapor content. He used 13 radiosoundings before the arrival of SLs and 11 radiosoundings after the passage of SL. Our results confirm for the temperature of the lower layers cooling and warming in the layer 450-250hPa. The warming in the layer 850-500hPa found by [13] does not appear in our results that show a cooling of 0.3 ° C to 850hPa. For specific humidity, found a drying between 0 and 3.5 km (approximately ground-700hPa) with a maximum of one-to-4g.kg 1km (850hPa) and a humidification between 3.5 and 11 km, either above 700hPa, with up to 5km (around 500hPa). We find a large humidification above 900hPa with up to 850hPa, draining the lower layers found by (Lafore, 2010), does not appear in our results. The results of (Lafore, 2010), also give the amplitudes of variation of relative humidity on the ground to the passage of SL 11 These amplitudes are between 13% and 32% (Tourre Yves, 1978) conducted a study of composite SLs based on the ECMWF analysis. It is a full-wave drying front (over 6 hours) followed by wetting and then drying and finally a high humidification throughout the atmosphere. Our results show a drying corresponding to negative variances before the transition and wetting corresponding to positive differences after the passage of SL. (Sow, 2005), applied the method to composite several radiosounding stations in West Africa in an area between 10 ° E and 27 ° West and between the equator and 20 ° N for the SL description of the summer 1974. Among the results of (Gamanche, 1983), who used the temperature and mixing ratio: there is a strong cooling in the layer 700-600hPa with a moistening. Warming in the upper troposphere to the front and back of the SL and warming with a drying in the lower layers in the front of SL. Cooling with a moistening in the 700-500hPa layer is reflected in our results and those of [25]with a large cold and moist layer between 900 and 500hPa.
Conclusion
authors the SL also includes stratiform part also. The state of the atmosphere within 24 hours preceding the passage of SL is characterized by a significant crowding in the layer 850-750hPa up to 13 hours before. After the passage of the SL characteristics of the atmosphere are: a strong cooling in the layer located below 600hPa; A high-humidification in the layer 850-700hPa. This composite analysis involves the interaction between scale and large-scale upper air. Observations indicate that most of the precipitation in these systems comes from tropical convective. from these results We offered to researchers of the physics of the atmosphere in this Climatological meteorological study of parameters a means of validating weather numerical models mesoscale or satellite data retrievals).
Acknowledgments
We thank the Directorate of National Meteorology of Senegal and its officials for allowing us to acquire data in this work, ACMAD and the Project "FIRMA II B", The University Gaston Berger.
REFERENCES
Arnault, J., Roux, F., Characteristics of African easterly waves associated with tropical cyclogenesis in the Cape Verde Islands region in July-August-September of 2004-2008.
Atmospheric Research, 100,61-82 .(2011)
Aspliden C.I., Y. Tourre, J.B. Sabine,: Some climatological aspects of the West African disturbance lines during GATE. Mon. Wea. Rev., 112, 1782-1794p.(1976)
B. Sow, A. Viltard, P. de Felice, A. Deme, and G. Adamou: are squall lines detected by ncep-ncarreanalyses. MeteorolAtmosPhys 90, 209–214. (2005)
Barthe, C.,Mari, C.,Chaboureau, J.P.,Tulet, P.,Roux, F.,Pinty, J. –P : Numerical study of tracers transport by a mesoscale convective system over West Africa. ANNALES GEOPHYSICAE,29,731-747.(2011)
Bryan, G. H., Hugh M.,: Sensitivity of a Simulated Squall Line to Horizontal Resolution and Parameterization of Microphysics. Mon. Wea. Rev., 140, 202–225.(2012) Burpee, R. W., Structure énérgétique des ondes d’est. La
Météorologie, numéro spécial, 137-148. (1976):
Defelice, P, Viltard, A ,Monkam, D , Ouss, C , : characteristics of north african 6-9 day waves during summer 1981 . Mon. Wea. Rev, 118, 2624-2633. (1990) Desbois M., T.Kayirango, B.Gnamien, S. Guessous and
L.Picon,: Characterization of some elements of the Sahelian Climate and their interannual variations for July 1983, 1984 and 1985 from the analysis of Meteosat ISCCP data. J.Climat, 1,867-904p.( 1988)
Diop, B., S. Fongang , D. Badiane, F. Traore : Vertical energy structure of atmosphere to the passage of the squall lines in Dakar. AIC, 7, 75-85pp. (1995).(in french)
Druyan Leonard M., : Studies of 21st-century precipitation trends over West Africa. International Journal of
Climatology, 31,1415-1424.(2011)
Gamanche, J., R. A. Houze Jr. Water budget of amesoscale convective system in the tropics. J. Atmos. Sci., 40, 1835-1850. (1983)
Gaye, A., Viltard, A., de Felice, P. Squall lines and rainfall over Western Africa during summer 1986 and 87. METEOROLOGY AND ATMOSPHERIC PHYSICS , 90,215-224.(2005)
Heinrich Gustav Magnus-Tetens http://fr.wikipedia.org/ wiki/Point_de_rosee. Last Accessed 28 December 2011. http://www.kymesonet.org/docs/jan292008.pdf.Last Accessed
29 January 2012.
January 29-30th Squall Line Impact on Kentucky Mesonet Sites Joseph Wilson, Jane
John Rozbicki and George Young:Historical Squall line Cases From the Observational Literature Compiled. http://www. ems.psu.edu/~young/rozindex.htm. Last Accessed 29 January 2012.
Karan, Haldun, Patrick J. Fitzpatrick, Christopher M. Hill, Yongzuo Li, Qingnong Xiao, Eunha Lim,: The Formation of Multiple Squall Lines and the Impacts of WSR-88D Radial Winds in a WRF Simulation. Wea. Forecasting, 25, 242–262.(2010)
Lafore, J-P : Introduction to the AMMA Special Issue on 'Advances in understanding atmospheric processes over West Africa through the AMMA field campaign' .Quarterly journal of the Royal Meteorological Society ,136,2 -7.(2010)
Lothon, M ., Campistron, B., Chong, M., Couvreux, F., Guichard, F., Rio, C.,Williams, E.,.MONTHLY Life Cycle of a Mesoscale Circular Gust Front Observed by a C-Band Doppler Radar in West Africa. WEATHER REVIEW, 139,1370-1388.(2011)
Lu, Chung; Ciesielski, Paul E.; Schubert, Wayne H.: Geostrophic and ageostrophic circulations in midlatitude squall lines. Journal of the Atmospheric Sciences; , 54 , 1218. (1997)
Marie Wix, Zachary Brown, Megan Ferris, and Stuart Foster National Weather Service Weather Forecast Office.
http://www.crh.noaa.gov/sgf/?n=spotter_squall_lines#Squa ll%20Line%20Basics.Last Accessed 29 January 2012. On Satellite Images; squall lines and mesoscale convective
systems http://ww2010.atmos.uiuc.edu/%28Gh%29/ guides/mtr/svr/type/mline/sat.rxml. Last Accessed 29 january 2012.
Pujol, O., Lascaux, F., Georgis, J.F. Kinematics and microphysics of MAP-IOP3 event from radar observations and Meso-NH simulations. Atmospheric Research, 101, 124-142.(2011)
Redelsperger , J. L., J. P. Lafore, A three dimensional simulation of tropical squall lines : convective organization and thermodynamic vertical transport. J. Atmos. Sci., 45, 1334-1356.(1988)
Reed, R. J., D. C. Norquist, E. E. Recker,: The structure and properties of African wave disturbances as observed during phase IIIof GATE. Mon. Wea. Rev., 105,317-333. , (1977) Roux,F., J. Sun,. : Single-Doppler observations of a est
African squall line on 27 6 28 May 1981 during COPT81 : kinetics, thermodynamics and water budget. Mon.Wea. Rev.,118, 1826-1854. (1990)
Tourre Yves: west-african squall lines during summer 1974. bulletin of the american meteorological society,59,1534-1534.(1978)