3780
DETERMINING THE DOMINANT ATTRIBUTES OF
INFORMATION TECHNOLOGY GRADUATES
EMPLOYABILITY PREDICTION USING DATA MINING
CLASSIFICATION TECHNIQUES
KENO C. PIAD
Associate Professor, Bulacan State University, College of Information and Communications Technology, Philippines
Email: [email protected]
ABSTRACT
Recent year’s shows major increase in the study with regards with prediction and model discovery using various types of Educational Data Mining Techniques. Classification is one of the several data mining techniques that has become an interesting topic to the researchers because of its accuracy and efficiency for classifying the data for knowledge discovery. The purpose of this paper is to predict the employability of IT graduates by to determine whether the IT graduates will land into an IT related profession or not related to IT based on the CMO.53 Series of 2006.The study aims to determine the dominant attributes using data mining algorithms under the supervised learning and compare their accuracy. Among the classification techniques used for comparison of accuracy were Naive Bayes, J48, Simple Cart, Logistic Regression and Chaid Algorithms. The researcher collected the historical data from the five year profiles of BSIT graduates from S.Y. 2011 to 2015 from the University Job Placement Office Tracer Study and combine with their academic records. The results show that 3 significant factors that have direct effect on IT employability which includes IT_Core, IT_Professional and Gender.
Keywords: Data Mining, Decision Tree, Classification Algorithm, Employability, Prediction; Analytics, Accuracy
1. INTRODUCTION
Graduates employability remains as national issues due to the increasing number of graduates produced by higher education institutions each year. In the Philippines, the Department of Labor and Employment (DOLE) cited job mismatch as one of the top factors causing many unemployed Filipinos in the recent time. According to the January 2014 Labor Force Survey, the Philippines registered an unemployment rate of 7.5 percent, while underemployment was pegged at 19.5 percent. Moreover it was registered according the Global Employment Trends report of the International Labor Organization that the Philippines registered an unemployment rate of 7.3 percent in 2013, the highest unemployment rate among members the Association of South East Asian Nations or ASEAN. These reports suggests that the country is facing a big problem regarding with unemployment to our
college graduates which may be proposed that they are lacking appropriate skills needed by employers. For this reason a comprehensive study should be taken in consideration to identify the critical factors underlying graduate employability. Hence more effective and efficient measures may be considered.
3781 Office. SQL scripts were used to generate the needed data such as student’s biographic profile and cumulative grade point average (CGPA) in there major and general education subjects which is divided in several categories according to CHED Memo 53 Series of 2006. Another data source will be coming from a developed graduate tracer. The questionnaire focuses on the employment situation of the IT graduates particularly there first job after graduation. The questionnaire developed by Commission on Higher Education (CHED) which is called the Graduate Tracer Survey Study serve as the basis in the development of the questionnaire. Only graduates of four year IT course of batch 2011 to 2015 were included in the study. The research was further delimited to student graduation within the specific five consecutive years due to curriculum updates by the college. To estimate the predictive accuracy of the result of the data mining models, training and testing datasets will be employed. Once the classifier is developed, testing datasets will be used for validation.
To construct the classifiers a popular and reliable Data Mining Tool which is Waikato Environment for Knowledge Analysis (WEKA) will be utilized. It delivers numerous classification algorithm and testing options that is straightforwardly applied to datasets. Bayes and Tree family algorithms will be used as classifier to generate data model. Most researches dealing about employability and student academic performance prediction uses the above mention classifiers (Sapaat, 2011), (Tsai,2014), and (Osmanbegović, 2014).
The major objective of study is to determine the IT graduates employability whether they will land in an IT related profession or not related to IT, based on the CHED Memorandum Order .53 Series of 2006 using selected Classification Techniques. Selection of different classification techniques used was based on the results of the previous employability prediction study (Sapaat 2011, Jantawan and Tsai 2014, Jantawan and Tsai 2013, Swadi Al-Janabi 2010, Nafi 2011).
Another significant objective of the study is to determine the critical factors that contributes to IT graduate employability.
R Research Questions
1. 1. How to describe the profile of the respondents in terms of
a. Frequency Distribution of IT Related/Not Related Employability
b. Cross Tabulation of IT Related to Gender c. Cross Tabulation of IT Related to Location 2. 2. How feature selection technique using logistic regression determines the significant attributes affecting the information technology graduates employability?
3. 3. How to determine the right classifier in predicting IT employability using different classification algorithms?
2. RELATED WORK
Nowadays many researchers are getting interested with the usefulness of information from educational systems that can be utilized in the development of educational software this is called Educational Data Mining. According to the website of the International Educational Data Mining Society (IEDMS):
“Educational data mining is an emerging discipline methods for exploring the unique types of data that come from educational settings, and using those methods to better understand students, and the settings which they learn it.”
Romero and Ventura (2007) categorize work in educational data mining into two general category: Statistics & visualization while the other one is Web mining composed of sub category such as (a) Clustering, classification, and outlier detection ; (b) Association rule mining and sequential pattern mining ; and (c) Text mining.
Another viewpoint of educational data mining is presented by Baker [in press] Data Mining for Education, which classifies work in educational data mining as follows: Prediction (Classification, Regression, Density estimation), Clustering, Relationship Mining (Association rule mining, Correlation mining, Sequential pattern mining, Causal data mining) ,Distillation of data for human judgment and Discovery with models.
3782 provided by learning software, scientific research
into learning and learners; and five
approaches/methods: prediction, clustering, relationship mining, distillation of data for human judgment and discovery with models.
On the other hand Romero, Ventura, Espejo and Hervás (2008), explained in their research the different educational objectives in using classification task. This includes discovery of similar characteristic and reactions, detecting students’ misuse or game playing, grouping the students who are failure- driven, identifying students with low motivators, and classifying students using intelligent tutoring systems.
Bangsuk Jantawan and Cheng-Fa Tsai (2014) conducted a research about factors underlying the graduate’s employability. Classification techniques were therefore applied to identify graduates employability underlying factors. To search for the most important factor for graduate employability the researchers compare the accuracy of each algorithm under Bayesian methods including Naïve Bayesian Simple, Naïve Bayesian, Averaged
One-Dependence Estimators, Averaged
OneDependence Estimators with subsumption resolution, Bayesian networks, and Naïve Bayesian Updateable. The data came from the historical database of graduate in Khon Kaen University Thailand, for the 2009 academic year. This were used to construct the graduate employability model and compare each models accuracy under Bayesian method.
Furthermore, the study was based on the three phases of data mining techniques such as data preprocessing, classification task and interpretation and evaluation. Among the six different Bayesian method, it turns out that AODEsr algorithm achieved the highest accuracy level of 98.3%. The study make used of the Waikato Environment for Knowledge Analysis (WEKA) program to create the classifiers.
Their study reveals that work experience, occupation type, and times find work have a direct effect on the employability of their graduates.
On the other hand, Job sector is ranked the highest by attribute selection based on Information Gain. It was found the most important factor in discriminating the graduate profiles to predict the graduate’s employment status. The study use classification techniques in data mining comparing
the effectiveness of Bayes algorithm versus tree-based algorithm (Sapaat et. al., 2011).
In the Philippines, enhancement of graduate employment is also carefully being studied. Researcher like Laraya (2009), studied on how human resources maybe developed and train to attain full employment. One of the specific questions points out on the factors that may determine the employability of our graduates. Thus data obtained in the study will provide recommendations that possibly be used to enhance the curriculum and programs of colleges and universities, drawing out some policy implications. Stratified technique was used to determine the sample size of the respondents. They make used of CHED’s accomplished graduate tracer instrument as the main source of data sets. SPSS was used in the data processing while frequency distribution, chi-square and cross tabulation was applied for the statistical treatment.
One of the results of the study shows that communication skills in English and skill in social and human relation are significant attributes by the graduates as positive factors in employability.
Moreover, recent study in educational data mining pertaining to dominant factor for student performance showed that the studying time, years of education, the student’s age and father’s education among the most significant predictors of grade for successfulness of a student. (Osmanbegović, Suljić and Agić, 2014).
In statistics, logistic regression, or logit regression, or logit model is a regression model
where the dependent variable
(DV) is categorical. Logistic regression measures the relationship between the categorical dependent variable and one or more independent variables by estimating probabilities using a logistic function, which is the cumulative logistic distribution.
3783 Another study concerning graduate employability also used logistic regression particulary binary logistic regression. The study found that the degree type, soft skills and social capital, efforts made by graduates in applying for jobs, and especially, the additional professional qualifications that students earned during the university career were the significant determinants of graduate employability in Sri Lanka (Chandrakumara, 2015).
This review of related literature and studies initially recognized the unemployment condition occurring in the Philippines. Moreover, identifying problems about job mismatch as one of the significant factor affecting the unemployment situation in the country. The basic foundation of this research was established by identifying important factors affecting the graduates’ employability particularly the significant attributes / predictors by the graduates as positive factors in employability. The concept of data mining and its application through educational setting such as educational data mining was also part of the baseline of the research. Also presented were the different classification tasks in data mining that has been very useful in the development of data mining models for graduates employability was discussed and compared. Furthermore, it found out that the decision trees and naive bayes algorithm are the common classification task used in graduates’ employability model and possible association techniques can be employed to real relations of attributes. Finally, the impact of the study and projected effect on the improvements of graduates’ employability through the development of a conceivable employability model.
3. METHODOLOGY
Knowledge Discovery and Data Mining (KDD) is an interdisciplinary area focusing upon methodologies for extracting useful knowledge from data. The rapid growth of data of Information System and the widespread use of databases have created an immense need for KDD methodologies.
Knowledge discovery of databases (KDD) is known for determining possible useful, potential and understandable data patterns that can be used for prediction. The knowledge discovery has nine (9) steps. One main step in knowledge discovery is the
data mining step which focused on the search of interesting pattern in the sets of data. The process of
Knowledge Discovery in Databases (KDD) is traditionally presented as a sequence of operations which when applied iteratively, lead from the raw input data to high-level, interpretable and useful knowledge. The major steps in KDD process are
typically: Selection, Pre-processing,
Transformation, Data Mining, and
Interpretation/Evaluation (Szczuka, 2012).
During the selection and pre-processing phases of the KDD cycle the original raw data pool is sampled, cleansed, normalized, formatted and stored in a convenient way. The original, raw data is first turned into target data) and then converted into pre-processed, analytic data (pre-processing) and data mining.
This study used the three phases of the data-mining techniques including data pre-processing, classification
task, and interpretation and evaluation.
A. Data Pre-Processing
The data were collected based on the five year historical profiles of 515 students randomly selected at the placement office tracer study and their specific academic records from the University Registrar through the help of their Management Information System Office. SQL scripts were used to generate the needed data such as student’s biographic profile and cumulative grade point average (CGPA). The classifiers were created by using the Waikato Environment for Knowledge Analysis (WEKA) program. The default file type for data analysis in WEKA is the Attribute-Relation File Format file type, moreover, the data can also be imported in various formats such as CSV: Comma-Separated Values (text file), CSV file, and so on.
The data was prepared to a format that a data mining tool can be recognized. Table below show the 12 attributes used for the IT Employability. The IT related
3784
Table 1: Attributes of IT Graduates Employability
Attributes Values Description
Sex
{male, female}
Gender of the graduate Location {city, municipality } location of residence of the
graduate specific_IT _professions Based on CMO 26 series 2006 specific IT professions/occupa tions right after graduation IT_Related
{ Job related to IT, Job not related to IT }
Relatedness of Job to IT Job Description {IT Software, IT Network/ Sys/ DB Admin, Other IT Related Field } Classification of the Specific IT Profession based
on the jobstreet.com
ITE Electives {1.00-1.24,
1.25-1.49, 1.50-1.74, 1.75-1.99, 2.00-2.24, 2.25-2.49, 2.50-3.00, Failed} CGPA ( Cumulative Grade
Point Average of Major and General
Education Subjects)
Free Elective
Basic ITE Core Courses ITE Professional Courses Languages & Humanities Mathematics, Natural Sciences & Technology Social Sciences &Communicatio ns
***Subjects Categorization is based on CHED Memorandum Order (CMO) No. 53; Series of 2006 “Policies and Standards for Information Technology
Education”
After determining the potential attributes, data pre-processing techniques will be used. It includes data cleaning which handle missing values, duplications and removing of outliers. The researcher will use sql script commands as a data processing technique to query relevant and potential data from databases. The raw data received from the Management Information System will be cleaned thru some most significant structured query language scripts that avoid nulls and missing values.
The potential data sets will be prepared and be transformed into a proper format that data mining tool can be recognized. The attribute were discrete into intervals with categorical or nominal attributes to prepare the data for the classification task. The generated comma serperated values will converted into an Attribute Relation File Format (ARFF)- a file which be recognized by Wakikato Knowledge Analytis (Weka) to generate data model for prediction.
The discretized values can be described as follows:
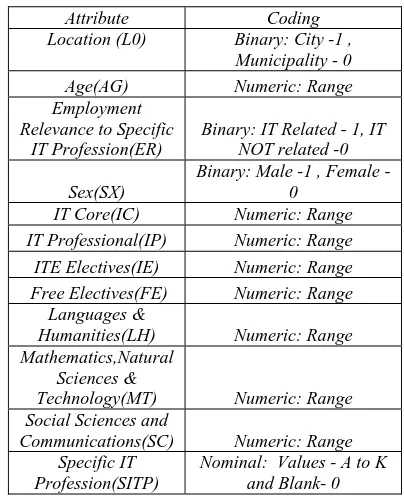
Table 2: Input Variables
Attribute Coding
Location (L0) Binary: City -1 ,
Municipality - 0
Age(AG) Numeric: Range
Employment Relevance to Specific
IT Profession(ER)
Binary: IT Related - 1, IT NOT related -0
Sex(SX)
Binary: Male -1 , Female - 0
IT Core(IC) Numeric: Range
IT Professional(IP) Numeric: Range
ITE Electives(IE) Numeric: Range
Free Electives(FE) Numeric: Range
Languages &
Humanities(LH) Numeric: Range
Mathematics,Natural Sciences &
Technology(MT) Numeric: Range
Social Sciences and
Communications(SC) Numeric: Range
Specific IT Profession(SITP)
Nominal: Values - A to K and Blank- 0
The attributes used in the study consists of demographic profile (location, age and sex ) , cumulative weighted average in their academic records based on the classification of the subjects in the CMO. 56 series of 2006 and the their response from the Tracer Survey in relationship with their employment relevance to specific IT Profession.
[image:5.612.318.520.258.508.2]3785 numeric values was coded based on their grades where grade of 5 is the highest and 1 is lowest.
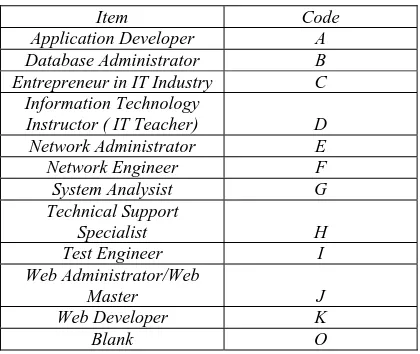
Table 3. Specific IT Profession Based on CMO. 56 S.2006
Item Code
Application Developer A
Database Administrator B
Entrepreneur in IT Industry C
Information Technology
Instructor ( IT Teacher) D
Network Administrator E
Network Engineer F
System Analysist G
Technical Support
Specialist H
Test Engineer I
Web Administrator/Web
Master J
Web Developer K
Blank O
In order to determine the specific IT Profession the researcher assigned nominal values ranging from letters A to O.
B. Classification Task
The datasets will be divided into two namely training and testing sets. The training sets will be used to generate data model to be used for prediction. The generated data model will be converted to sets of rule or equation that will be used to the testing sets. The testing sets is used to determine the acceptability of the mode based on its accuracy rate.
The training sets will use the cross validation technique to generate data model. Cross Validation technique is a strategy to avoid under fit and over fit of the model.
The purpose of a data mining tool is to generate data model using sets of data mining algorithms. To generate the data model the researcher will several classification techniques from naïve bayes and decision tree algorithm.
This study will compare the statistical predictive algorithms mentioned above. The generated data model will be converted in its corresponding rules sets or equation used for prediction.
The data is partitioned according to the best split and this in turn creates a new second partition
rule. The process goes on until there are no more splits. The resulting tree is known as a maximal tree. The rules generated from the decision tree model will be used in the prediction in the new testing sets.
The decision tree with a binary target employability status has two outcomes, YES or NO or it can be applied as 1 or 0. Input variables such as demographic graduate’s data, graduate’s grades will be examined to generate data model. Naive Bayesian classifiers use the Bayes theorem to classify the new instances of data. Naïve Bayesian is using statistical schemes of the graduates demographic data, and graduates academic grades. This is a simple probability based classifier, which assumes conditional independence of the predictor variables given the class label employment status, and Gaussian distribution of metric predictors. Naive Bayes classifiers can handle either continuous or categorical independent variables.
Logistic regression uses the Logit model. It provides an association between the independent variables and the logarithm of the odds of a categorical response variable. Since the target variable Employment Relevance to Specific IT Profession (ER) is a binary (yes/no) or coded 1 and 0 response a binary logistic regression model was used. Logistic regression analysis applies maximum likelihood estimation after transforming the dependent variable Employment Relevance into a Logit variable. Logistic regression will estimate the odds of the IT graduate whether employed or not employed in IT related profession.
C. Interpretation and Evaluation
There are two-step processes of data classification. The training sets of data will be determined by analyzing a set of training database instance until a data model will be build that describes a predetermined set of classes or concepts.
The second step is to test the data; the model is tested using a different data set that will be used to estimate the classification accuracy of the model. If the accuracy of the model is acceptable, the model can be used to classify future data instances for which the class label is not known.
3786
Table 4: The Receiver Operating Table
Predicted Class
Actual Class
yes no
yes TP FN no FP TN
The true positives (TP) and true negatives (TN) are correct classifications. A false positive (FP) occurs when the outcome is incorrectly predicted as yes (or positive) when it is actually no (negative). A false negative (FN) occurs when the outcome is incorrectly predicted as negative when it is actually positive. The true positive rate is TP divided by the total number of positives, which is TP + FN; the false positive rate is FP divided by the total number of negatives, FP + TN. The overall success rate is the number of correct classifications divided by the total number of classifications.
The training sets will use the cross validation technique to generate data model. Cross Validation technique is a strategy to avoid under fit and over fit of the model.
Percentage. To find out what part of the
population was represented out of one hundred equal parts, the percentage method is used.
Correlation is a statistical technique which can show whether or how pairs of variable are strongly related. An intelligent correlation analysis can lead to greater understanding of data.
Positive correlation exists when high score in one variable associated with high score in second variable. This is also true when low score in one variable are associated with one variable in the other, thus there is direct relationship that exists in positively correlated variables.
Negative correlation exists when high scores in one variable are associated with low score in the second variable and vice versa.
Zero correlation variables exist when scores in one variable tend to score neither systematically high nor systematically low in other variables.
Regression Analysis. This method is
concerned with the problem of estimation and forecasting. From a pool of potential explanatory factors the research may choose to pick out only
those which significantly contribute to the explanation of the criterion measured.
The researcher makes use of a well-known data mining industry-based methodology CRISP-DM (CRoss-Industry Standard Process for Data Mining)
in creating data model for employability of IT graduates for Bulacan State University. The data model is aims to identify the probability value of graduate employment of student on or before graduation. If model predicts low probability value of his employment chances based on patters or rules generated from the historical data sets then, intervention and enhancement program is a possibility. The study will determine what sets of characteristics or factors out of the given lists attributes from the tracer study has the significant effect on the employability chance of Information Technology graduates.
Sampling Technique
The researcher used purposive sampling technique to determine the sample size.
A purposive sample is a non-probability sample that is selected based on characteristics of a population and the objective of the study. A total of 515 BSIT graduates are available were processed from school year 2011-2015 taken as subject to describe and to generate prediction rules as training and testing sets of data
4. RESULTS AND DISCUSSION
The researcher explores on the potential of data mining in analyzing academic data in higher education institution. The goal of such endeavor is to find means to improve the services that these institutions provide and to enhance instruction. At present, most researches focus on retention issues
and improvement of student academic
performances. It searches for ways to improve student academic performances, retention policies to improve graduation rate and programs to increase graduates’ employability.
Answering the first research questions entails the researcher to provide necessary summative reports
regarding information technology graduates
employability.
3787 and testing sets of data. Tables below indicate the demographic and academic profile of BS Information Technology graduates of University under study from school year 2011-2015.
Table 5: Frequency Distribution of IT Related/Not Related Employability
Frequency Percent
IT Not Related 233 45.2
IT Related Career 282 54.8
Total 515 100.00
Table above indicates the frequency distribution of graduates in respect to their profession. The table indicates that there are 233 instances (45.2%) graduates where employability is not related to their degree finished particularly to the specific IT Profession that was suggested by the Commission on Higher Education in their CMO No.53 Series of 2006.
Hence, the employment rate relating to their field of specialization after graduation in the institution under study validated an imbalance result.
Table 6: Cross Tabulation of IT Related to Location
Table above reveal’s that graduates from school year 2011 to 2015 residing in municipality succeeded to land to IT Related profession than graduates located in city with 174 ( 61.70%) compare to city 108 ( 38.29%). However the data recorded that most none IT related profession are also residing in municipality with 140 instances (60.08%).
Table 7: Cross Tabulation of IT Related to Sex
Sex Total
Male Female
IT_Related NO 140 93 233
YES 124 158 282
Total 251 264 515
Table above reveals that from school year 2011-2015, female succeeded to find job specific to their IT profession than male with 158 (56.02%) compare to 124 (43.97%). The data recorded that most male are not employed in line with IT careers 140 (60.08 %).
Answering the second research questions entails the researcher to conduct feature selection technique that determines significant attributes.
[image:8.612.310.522.353.531.2]To determine the statistical significance of a predictor the p value was used. The predictor is statistically significant when a p value is less than the significance level. The p-value is the probability of observing an effect given that the null hypothesis is true whereas the significance or alpha (α) level is the probability of rejecting the null hypothesis given that it is true. In practice significance level is chosen before data collection and is usually set to 0.05
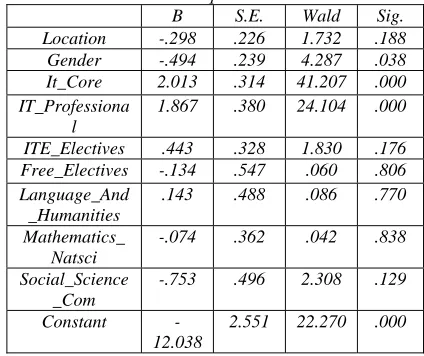
Table 8: Logistic Regression Employability Variables in the Equation
B S.E. Wald Sig.
Location -.298 .226 1.732 .188
Gender -.494 .239 4.287 .038
It_Core 2.013 .314 41.207 .000
IT_Professiona l
1.867 .380 24.104 .000
ITE_Electives .443 .328 1.830 .176 Free_Electives -.134 .547 .060 .806 Language_And
_Humanities
.143 .488 .086 .770
Mathematics_ Natsci
-.074 .362 .042 .838
Social_Science _Com
-.753 .496 2.308 .129
Constant -12.038
2.551 22.270 .000
The data reveals that three variables significantly predicts employability of IT Related Careers including the constants value namely; gender (B=-.494, p<.05), Information Technology Core Subjects (B= 2.013, p<0.05) and Information Technology Professional Courses (B = 1.867, p<0.05) Moreover, the data fit the model statistically as shown by the goodness of fit test, called Hosmer Lemeshow Test, with nonsignificant chisquare (Chisquare = 5.393, df=8, p >.05)
Table reveals that gender has a negative B. Coefficient indicating that male (coded 1) has a lower odds of having in line job opportunities after graduation. The B coefficients for IT Core and IT Professional courses are positive, indicating that the
Location Total
Municipalit y
City
IT_Related NO 140 93 233
YES 174 108 282
3788 higher the scores of the graduates in the following subjects, the higher the likelihood that they will land a job relevant to their chosen field.
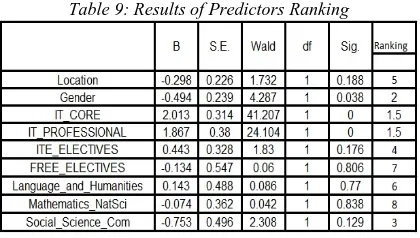
Table 9: Results of Predictors Ranking
A perusal of data in Table 11 shows the rankings of all attributes used in predicting graduate employability. The data reveals that IT_Core, IT_Professional and Gender are identified as significant predictors
[image:9.612.312.523.123.193.2]Answering the third research questions entails the researcher to test the employability data with different classification algorithms..
Table 10: Results of Different Classification Algorithm
[image:9.612.90.300.150.269.2]The table shows the accuracy results of different classification algorithm in predicting the graduate employability. From the table, it reveals that logistic regression appears to be the highest with 78.4% followed by Chaid with 76.3%, Naïve Bayes with 75.33%, J48 with 74.95% while SimpleCart with an accuracy of 73.01 percent. To compute for the error estimation rate percentage, one hundred percent minus the accuracy results will yield that logistic regression is 22.60 percent. The smaller the error estimation, the more accuracy is acceptable.
Table 11: Results of the Classification Table Using Logistic Regression
Observed Predicted IT_Related Percentage
Correct NO YES
IT_Related NO 149 84 63.9
YES 27 255 90.4
Overall Percentage 78.4
The table reveals that the data model of logistic regression recorded an accuracy rate of 78.4 overall percentage correct prediction.
5. CONCLUSION
Researchers in higher education are beginning to explore the potential of data mining in analyzing data for the purpose of giving quality service and needs of their graduates. Thus, educational data mining emerges as one tool to study academic data to identify patterns and help for decision making affecting the education. Relative to this objective, the research had proven that 45.2% of the graduates does not fall into Information Technology related fields or careers after their graduation. This scenario validates the researcher to further conduct the study to avoid misalignment of Information Technology careers. Further the study compares five algorithms under classification technique on IT employability dataset. The results show that the Logistic regression, achieved the highest accuracy of 78.4%. The second highest accuracy was achieved using CHAID algorithm with an accuracy of 76.3 %. In addition, the study shows that three possible predictors with a direct effect on IT employability are the IT_Core Subjects, IT_Professional Subjects and Gender. The system has plenty of space for further improvements that future researchers might want to follow through. The study can utilize newly acquired data to generate more rules and predict higher accuracy in IT employability. The study can use other classification algorithms to generate more accurate data model. The application of data mining in graduate employability may consider search for significant relationships such as patterns, associations and changes among variables in databases.
Algorithm Accuracy Result
Error Estimation Rate
%
Naive Bayes 75.33 24.47
J48 74.95 25.05
SimpleCart 73.01 26.99
Logistic regression
78.4 22.60
3789
REFERENCES:
[1] Agresti, A. (1996). An introduction to categorical data analysis (Vol. 135). New York: Wiley.
[2] Anurag Jindal & Er. Williamjeet Singh (2014). Data Mining in Education for Students Academic Performance: A Systematic Review. In : INTERNATION JOURNAL OF COMPUTERS AND TECHNOLOGY,pp 5020 – 5028
[3] Baker, R (2010). Data Mining for Education. To appear in McGaw, B., Peterson, P., Baker, E. (Eds.) International Encyclopedia of Education (3rd edition). Oxford, UK: Elsevier.
[4] Baker, R. S. J. D. (2010). Data mining for education. International encyclopedia of education, 7, 112-118.
[5] Baker, R., Yacef, K. (2009) The State of Educational Data Mining in 2009: A Review and Future Visions. Journal of Educational Data Mining, 1, 1, 3-17.
[6] Bangsuk Jantawan, Cheng-Fa Tsai (2014) : A
Classification Model on Graduate
Employability Using Bayesian Approaches: A Comparison. In: International Journal of Innovative Research in Computer and Communication Engineering, pp. 4584—4588 [7] Chandrakumara, D. P. S. (2015). Modeling
Graduate Employability in Sri Lanka Using Binary Logistic Regression.
[8] Chapman, P., Clinton, J., Randy, K., Khabaza, T., Reinartz, T., Shearer, C., et al. (2000). CRISP-DM 1.0 Step-by-step data mining guide. SPSS Inc.
[9] CHED Website [online]. Available:
http://www.ched.gov.ph/index.php/archive/cm o-archives/2006-ched-memorandum-orders-2/ [10]d Baker, R. S. (2010). Mining data for student
models. In Advances in intelligent tutoring systems (pp. 323-337). Springer Berlin Heidelberg.
[11]Edin Osmanbegović, Mirza Suljić, Hariz Agić (2014). Determining Dominant Factor For Students Performance Prediction By Using Data Mining Classification Algorithms .In: Vitez-Tuzla-Zagreb-Beograd-Bucharest, pp. 147-158 [12]Fayyad, U., Piatetsky-Shapiro, G., & Smyth, P.
(1996). From data mining to knowledge discovery in databases. AI magazine, 17(3), 37.
[13]Hand, D. J., & Yu, K. (2001). Idiot's Bayes— not so stupid after all?.International statistical review, 69(3), 385-398.
[14]J. M. ORILLAZA. (2014, May). Labor mismatch, or what ails the PHL jobs market
[online]. Available:
http://www.gmanetwork.com/news/story/3592 01/money/companies/labor-mismatch-or-what-ails-the-phl-jobs-market
[15]Jantawan, B., & Tsai, C. F. (2013). The Application of Data Mining to Build Classification Model for Predicting Graduate Employment. arXiv preprint arXiv:1312.7123. [16]Kadhim B. Swadi Al-Janabi (2010).Link
Analysis in Employment Data Set to Improve Learning Outcomes for IT Programmes. In: Journal of Kufa for Mathematics and Computer, pp.128 -135
[17]L.S. Affendey, I.H.M. Paris, N. Mustapha, Md. Nasir Sulaiman and Z. Muda, 2010. Ranking of Influencing Factors in Predicting Students’
Academic Performance. Information
Technology Journal, 9: 832-837.
[18]Laraya J. (2009): The Employability of Graduates : A Determinant To Full
Employment. In: Country Reports -
Enhancement of Graduate Employment - ASAIHL, pp. 19-25
[19]Nafi,M.N.A & Ghani I. (2011). Modelling Employability of Graduates Using Logistic Regression. In: Journal of Statistical Modeling and Analytics, pp. 45-51
[20]Olson, D.L and Delen,D.(2008) , Advance Data Mining Technique, Springer, ISBN 978-3-540-76916-3
[21]Romero, C., & Ventura, S. (2010). Educational data mining: a review of the state of the art. Systems, Man, and Cybernetics, Part C: Applications and Reviews, IEEE Transactions on, 40(6), 601-618.
[22]RYAN S.J.D. BAKER & KALINA YACEF (2009).The State of Educational Data Mining in 2009: A Review and Future Visions . In : Journal of Educational Data Mining, Article 1, Vol 1, No 1, Fall 2009
3790 [24]Sapaat,M.A., Mustapha, A., Ahmad, J.,
Chamili, K., & Muhamad, R.(2011). A Data Mining Approach to Construct Graduates Employability Model in Malaysia. In: International Journal on New Computer Architectures and Their Applications,pp.1086-1098