2596
ANALYSIS OF THE IMPLEMENTATION QUANTUM GIS:
COMPARATIVE EFFECT AND USER PERFORMANCE
M.TRI SATRIA JAYA1, AHMAD NURUL FAJAR2
1 Perusahaan Daerah Air Minum (PDAM) Bengkulu, Indonesia
1,2Information Systems Management Department, BINUS Graduate Program - Master of Information
Systems Management, Bina Nusantara University Jakarta, 11480 Indonesia E-mail: [email protected],[email protected]2
ABSTRACT
The purpose of this research is to analyze the effect sucess information system Quantum GIS on the user performance in the company PDAM Bengkulu City with the measurement of the system quality, information quality, use, and user satisfaction as an independent variable and user performance as the dependent variable. This research employs a qualitative analysis approach based on the Delone and McLean’s model of sucess to analyze the data which is designed to resemble the likert scale and was previously tested on the validity and realibility using SEM PLS method. The results showed that the variable system quality, information quality, the use of the system and user satisfaction affect the user performance of 0,99 or 99%. The level of influence of the largest independent variables in the successful application of Quantum GIS information systems in PDAM Bengkulu City is the user satisfaction with the highest value of the original estimate of 0.495. From the results of hypothesis testing that the system quality have a significant effect on user satisfaction and user performance. The quality of information significantly affects user use, user satisfaction and user performance and user saisfaction significantly affects user performance. While the influence of system quality and system usage is not significant to user performance. System quality is also not significant to usage.
Keywords: Information systemsQuantum GIS, user performance
1. INTRODUCTION
Shift or change the paradigm of government administration from Reinventing Government, is a shift in the identity of modern government to meet the demands of public wants and needs which is a move from of excellent service to all interests and needs of society [1].Along with the development of information technology need and the need to improve the quality of service to customers, developments of technology which is very fast currently includes the development of information technology infrastructure such as the development of hardware, software, storage technology and communication technology. Development of information system and information technology currently is very fast and users are widespread in almost every institution good government or private [2]. Institutions of PDAMs are now also implementing information and information technology systems based on Quantum GIS in service management [3]. PDAM in Bengkulu city is hopeful that the information technology and information systems based Quantum GIS can provide facilities to obtain reliable information useful to advance the company and to produce a strategic business decision
2597 researchers feel interested to know more influence the application of the system to the user’s
2. LITERATURE REVIEW
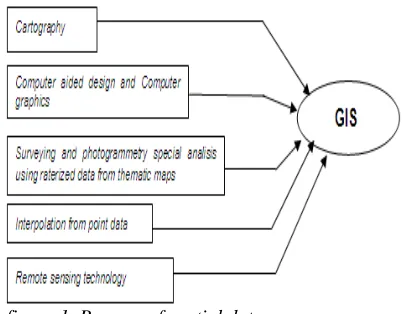
[image:2.612.96.297.377.534.2]The information system is a collection of components that collect, process, store, and provide output of any information required in business processes and applications used through software, databases and even manual processes related [7]. Geographic Information Systems (GIS) in general are specialized information systems that manage data that has spatial information. GIS is also software that can be used for inputting, storing, manipulating, presenting, and changing information about its attributes [8].GIS is used to provide value, by setting and showing data correctly, combining it with other data, analyzing data, and generating new data that is useful, in turn GIS can help in decision making [9].GIS is also the result of a combination of disciplines within some spatial data processes. This can be seen from the following picture:
figure 1. Process of spatial data
Based on the above notions, the Geographic Information System (GIS) can function as an integrated data bank, which can guide spatial and non-spatial data in an integrated database. Quantum GIS (QGIS) is a cross-platform desktop (open source) software on geographic information systems (GIS). This application can provide data, view, edit, and analytical capabilities. Quantum GIS runs on different operating systems including Mac OS X, Linux, UNIX, and Microsoft Windows. In licensing, QGIS as an application free software under GPL (General PublicLicense), can be freely modified to perform different or more specific tasks [5].
A performance measurement system is very important to know the success of the company in
2598
Figure 2. Model Delone & McLean [15]
This proposed model reflects the dependence of the six measurements of information system success. The six elements or components of the measurement of this model are:
1. System quality 2. Information quality 3. Use
4. User satisfaction 5. Individual impact 6. Organizational impact
On development there are other studies that prove and offer the development model of the success of the information system, such as Peter B. Seddon who reformulated the Delone & McLean model into two separate model variance [16]. The quality of the system based on the success model of Delone & McLean's information system is vast, such as flexibility, ease of use, response time, and reliability [17].Quality information is measuring the quality of output issued by an information system, especially in the form of reports or reports[10].Usage is often used as a benchmark in measuring a successful information system. There are several indicators in assessing the use of an information system, such as time connections on the frequency of users using the system and whether the system can facilitate users in their activities[9].User satisfaction with information systems is how users perceive an information system in real, not just the technical quality of the system. The test results conducted by user satisfaction have a significant role in the success of the information system.[19]. Of all the measurements of the success of the information system, impact is a very difficult thing to define. Impact is closely related to performance. Performance is the result or level of success of a person as a whole during a certain period in carrying out the task compared with various possibilities, such as standards of work, targets or targets that have been determined in advance or have been mutually agreed.To be able to measure how an
information system has an impact on individuals, can be seen with the productivity of users in making better decisions. Productivity is a comparison between the results that have been achieved (output) and the overall required resources (input) [15].
3. RELATED WORKS
This research can not be separated from the results of previous studies that have been done for comparison or study materials.
1. In 2009, [18] conducted research on how the influence of library information system implementation on the performance of circulation services in UGM library. The research model used is the library information system usage model, circulation service performance, and is measured based on information system characteristics according to Delone and McLean. The data collection used is through a questionnaire distributed to library staff in charge of serving circulation and other parts in charge of extending the time (overtime) in circulation services. From the results of the study identified that the use of library information systems can affect performance. 2. In 2011, [19] conducts research on whether the
frequency management information system (SIMF) can be said to be successful, and has a positive impact on performance in the Directorate General of resources and equipment of post and information technology. The research model used is the Delone and McLean model. By collecting data used structural equation models based on partial least square (PLS). From the results of the study, it was identified that the success model of the Delone and Mclean information system was not empirically proven in the case of SIMF development, because the intensity of the use of SIMF did not have a significant positive effect on individual impacts.
2599 4. In 2015, [21] conducted research on analyzing
the influence of information system quality and information quality, information system user satisfaction on individual performance. The research model used is the model of Delone and Mclean. By collecting data using questionnaires by distributing to 60 employees of PT KAI (Persero) DAOP VI Yogyakarta. From the results of the study identified that the quality of information systems positively affect the satisfaction of users of information systems, and is expected to improve employee performance.
4. RESEARCH METHODOLOGY
4.1. Theoretical Framework
The research mindset is part of the research that explains the reasons or arguments for the hypothesis, which describes the researcher's thinking process, and provides an explanation of the proposed hypothesis [22]. Based on several proposed theoretical studies, researchers assume that one of the factors that can affect the performance of users or individuals is the application of technology. The amount of benefits obtained from the use of information technology, makes technology increasingly accepted as something that must be utilized [23]. In accordance with the mission of Bengkulu city PDAM is: The creation of customer service satisfaction (Customers satisfaction). Improved quality of life of PDAM Kota Bengkulu better with attention to welfare and safety of work environment. Contributing to the development of government, social and society. Realizing PDAM Kota Bengkulu a healthy, independent, and growing. This research is a case study research using survey method through questionnaires distribution. This research is intended to be able to test the causal relationship between the success of Quantum GIS based information system, which can be decomposed into sub variables based on information system characteristics according to Delone and McLean [17].
4.2 Data Processing and Analysis Method
Research data which will then be analyzed by using descriptive analysis and structural equation model (Structural Equation Modeling) using smart PLS [27].
In SEM analsis with PLS, there are 2 things to do :
Assessing outer model or measurement model. Outer models with reflexive indicators have 3 criteria in assessing the outer model, namely convergent validity, discriminant validity, and
Composite validity. The convergent validity value for the initial stage of research and the development of the measurement scale of the loading value is quite adequate in the number 0.5 to 0.6. Discriminant validity can be assessed based on cross loading measurements with constructs. If the construct correlation with measurement items is greater than other constructs, then it can show latent constructs predicting their constructs better than other constructs [25]. The variable has good composite realibility if it has a value> 0.7 although it is not an absolute standard.
b. Outer model with formative indicator can be evaluated based on its content substantive, that is by comparing the statistical significance of weight estimation value. Formative indicators can not be analyzed by looking at t-statistics whether significant or not with the calculation of bootstrapping.
2. Assessing Inner Model
Inner model or structural model testing can be done to see the relationship between construct, significance value and R-square of research model. The structural model is evaluated by using R-square for the dependent construct. Stone-Geisser Q-square test for predictive relevance, and t test as well as the significance of the structural path parameter coefficients. In assessing the PLS model begins by looking at R-square for each dependent latent variable. Changes in R-square values can be used to assess the effect of latent independent variables on latent dependent variables whether they have substantive effects. The effect of magnitude can be calculated by the following formula:
F 2 = R² included - R² excluded 1- R² included
Information :
2600 Q-square formula:
Q2 = 1 – ( 1 – R12) ( 1 – R22 ) ... ( 1- Rp2 ) Information :
R12, R22….. Rp2 is R-square of the endogenous variable in the interpretation model Q2 is the same as the coefficient of determination on path analysis.
4.3. Hypothesis
The hypothesis is a temporary answer to the formulation of a problem that must be proven true between two variables or more according to [24]. Based on the formulation of the problem and thought, the hypotheses that will be used in this study are as follows:
H1: The quality of the Quantum GIS system has a positive and significant impact on usage.
H2: The quality of Quantum GIS system has a significant effect on user satisfaction.
H3: The quality of Quantum GIS information has significant effect on usage.
H4: Quantum GIS information quality has a significant effect on user satisfaction.
H5: Quantum GIS system quality has a significant effect on user performance.
H6: Quantum GIS information quality has a significant effect on user performance.
H7: the use of Quantum GIS system has a significant effect on user performance.
H8: Quantum GIS user satisfaction has a significant effect on user performance.
5. RESULT AND DISCUSSION
5.1. Data Analysis Research
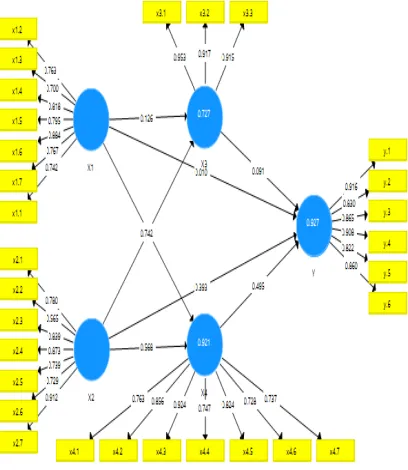
[image:5.612.326.554.44.336.2]The method of analysis is to know the shape and magnitude of the influence of independent latent construct (endogen) that is user performance to latent dependent construction (eksogen) that is system quality, information quality, usage and user satisfaction.
Figure 3. Influence Model of Implementation of Quantum GIS Information System on User Performance in PDAM Bengkulu city.
5.2. Evaluation Outer Model
Outer model evaluation (measurement model) is done using three criteria.
1. Convergent validity
The value of convergent validity is used to measure the level of reflection of the indicator interaction.
[image:5.612.326.530.473.708.2]2601 Results indicator loading factor indicators of each variable can be seen in Table 1 below
Table 1. Indicator Loading Factor Value
X1 X2 X3 X4 Y
x1.1 0,742
x1.2 0,763
x1.3 0,700
x1.4 0,818
x1.5 0,795
x1.6 0,884
x1.7 0,767
x2.1 0,780
x2.2 0,565
x2.3 0,839
x2.4 0,873
x2.5 0,739
x2.6 0,729
x2.7 0,912
x3.1 0,953
x3.2 0,917
x3.3 0,915
x4.1 0,763
x4.2 0,856
x4.3 0,924
x4.4 0,747
x4.5 0,824
x4.6 0,728
x4.7 0,737
y.1 0,916
y.2 0,830
y.3 0,865
y.4 0,908
y.5 0,822 y.6 0,860
Based on Table 1 can be seen two indicators that have a value factor loading more than 0.50. As according to [25]. if the value is <0.50 then the indicator must be issued Discriminant validity. So the indicator in this study is nothing to spend and qualify in reflecting latent constructs.
2. Discriminant Validity
Discriminant validity value is a useful coss loading factor value knowing whether the construct has sufficient discriminant, that is by comparing loading value on latent construct larger than other coss loading value.
Table 2. Coss Loading Value
X1 X2 X3 X4 Y
x1.1 0,742 0,519 0,364 0,579 0,498
x1.2 0,763 0,590 0,563 0,639 0,541
x1.3 0,700 0,521 0,441 0,591 0,554
x1.4 0,833 0,818 0,673 0,790 0,820
x1.5 0,833 0,779 0,766 0,820 0,795
x1.6 0,884 0,720 0,641 0,813 0,785
x1.7 0,767 0,663 0,627 0,705 0,617
x2.1 0,562 0,780 0,638 0,697 0,674
x2.2 0,470 0,565 0,322 0,511 0,501
x2.3 0,760 0,887 0,826 0,823 0,839
x2.4 0,834 0,873 0,750 0,827 0,844
x2.5 0,739 0,781 0,614 0,754 0,705
x2.6 0,544 0,729 0,539 0,643 0,634
x2.7 0,709 0,912 0,830 0,814 0,831
x3.1 0,762 0,764 0,953 0,838 0,789
x3.2 0,635 0,756 0,917 0,781 0,767
x3.3 0,731 0,841 0,915 0,833 0,857
x4.1 0,591 0,738 0,763 0,793 0,705
x4.2 0,772 0,793 0,934 0,856 0,815
x4.3 0,876 0,855 0,732 0,924 0,868
x4.4 0,604 0,698 0,596 0,747 0,712
x4.5 0,805 0,801 0,685 0,831 0,824
x4.6 0,793 0,662 0,585 0,728 0,652
x4.7 0,652 0,667 0,595 0,737 0,717
y.1 0,751 0,867 0,876 0,891 0,916 y.2 0,706 0,798 0,830 0,811 0,859 y.3 0,851 0,824 0,624 0,865 0,883 y.4 0,680 0,813 0,783 0,781 0,908 y.5 0,822 0,806 0,631 0,829 0,852 y.6 0,684 0,782 0,738 0,740 0,860
[image:6.612.327.539.185.658.2]2602
3. Composite reliability
[image:7.612.91.298.188.301.2]Composite Composite reliability is an index indicating the extent to which a measuring instrument can be trusted to be relied upon. A construct can be expressed reliably if the value of composite reliability> 0.6.
Table 3. Value of Composite Reliability
Cronbach's
Alpha rho_A
Compo site Reliabi
lity
Average Variance Extracted (AVE)
X1 0,895 0,908 0,917 0,613
X2 0,892 0,912 0,916 0,614
X3 0,920 0,922 0,949 0,862
X4 0,904 0,912 0,925 0,640
Y 0,934 0,935 0,948 0,752
Based on Table 3 it can be seen that the composite reliability for each variable has a value> 0.6 to indicate the stability and consistency of good indicators. This is also reinforced by the expected cronbach's alpha value of more than 0.6. These results provide evidence that composite reliability and cronbach's alpha provide values that meet the fit model criteria so that it can be declared good and can be used to test the hypothesis.
5.3. Inner Model Evaluation
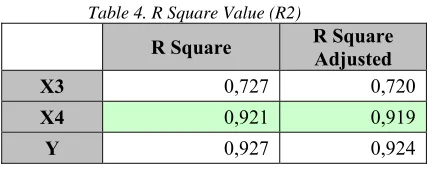
A structural model test is performed to examine the effect of latent constructs. The structural or inner model model is evaluated using the R Square (R2) value for the dependent latent variable. According to ref [28]. R Square values of 0.67 (strong), 0.33 (moderate) and 0.19 (weak). Table 4 is the result of inner model evaluation using R Square (R2).
Table 4. R Square Value (R2)
R Square R Square Adjusted
X3 0,727 0,720
X4 0,921 0,919
Y 0,927 0,924
Based on Table 4 can be seen the ability of variable quality system and quality information explain the user system variable of 0.727 or 72.7% (strong). The variable of system quality and information quality explain user satisfaction variable equal to 0,921 or equal to 92,1% (strong) and variable of system quality variable, information quality, user system and user
satisfaction explain user performance variable equal to 0,927 or equal to 92,7% (strong).
5.4. Hypothesis Testing
[image:7.612.325.535.206.474.2]Hypothesis testing is done by looking at the result of bootstrapping analysis on path coefficient, that is by comparing T-count value with T-Table. can be seen in Table 5.
Table 5. Hypothesis Testing Results
Origi nal Sam ple (O)
Sam ple Mea n (M)
Stan dard Devi ation (STD EV)
T Statis tics (|O/S TDE V|)
P Valu es
X1 ->
X3 0,126 0,123 0,110 1,146 0,252 X1 ->
X4 0,426 0,429 0,065 6,512 0,000 X1 ->
Y 0,010 0,021 0,078 0,125 0,901 X2 ->
X3 0,742 0,747 0,119 6,222 0,000 X2 ->
X4 0,568 0,565 0,069 8,234 0,000 X2 ->
Y 0,393 0,389 0,109 3,607 0,000 X3 ->
Y 0,091 0,106 0,088 1,026 0,305 X4 ->
Y 0,495 0,474 0,158 3,122 0,002
H1 : Based on Table 5 it can be seen that the effect of Quantum GIS system quality on the use indicated by the value of parameter coefficient of 0.126, where the influence is not significant with the value of hitung (statistic) is smaller than the T-table (1.146 <1.664) value greater than 0,05 that is equal to 0,252. This means the first hypothesis that the quality of the Quantum GIS system has a positive and significant effect on usage is rejected.
[image:7.612.82.296.539.624.2]2603 H3: Table 5 can be seen that the effect of Quantum GIS information quality on the use has a path coefficient value of 0.742, where the effect is significant and statistics (count) greater than T-table (6,222> 1,664) with p value smaller than 0.05 is 0.000. This means a third hypothesis which states that the quality of Quantum GIS information has a positive and significant effect on the use is acceptable.
H4: Based on the hypothesis testing that the quality of information Quantum GIS has a significant effect on user satisfaction. This can be seen from the value of path coefficient of 0.568 which states that there is a positive influence between the quality of information Quantum GIS on user satisfaction and T-statistics (T-count) of 8.234 is greater than T-table 1.664 which states the effect is significant. This means the fourth hypothesis which states that the quality of Quantum GIS information has a positive and significant effect on user satisfaction is accepted. H5: Based on Table 5 it can be seen that the effect of Quantum GIS system quality on user performance is indicated by the value of parameter coefficient of 0.010, where its influence is not significant with T-statistic value (T-statistic) is smaller than T-table (0.125 <1.664) with p value greater than 0,05 that is equal to 0,901. This means the fifth hypothesis that the quality of the Quantum GIS system has a positive and significant effect on the user's performance is rejected.
H6: Table 5 can be seen that the influence of quality information Quantum GIS on user performance has a coefficient value of 0.393 lane, where the influence is significant and T-statistics (T-count) greater than T-table (3.607> 1.664) with a smaller p value from 0,05 that is 0.000. This means the sixth hypothesis which states that the quality of the Quantum GIS information has a positive and significant effect on the user's performance is acceptable.
H7: Based on Table 5 it can be seen that the effect of using Quantum GIS system on user performance is shown with parameter coefficient value of 0,091, where its influence is not significant with T-statistic value smaller than T-table (1.026 <1.664) with p value greater than 0,05 that is equal to 0,305. This means the seventh hypothesis which states that the use of Quantum GIS system has a positive and significant effect on the user's performance is rejected.
H8: Table 5 can be seen that the influence of user satisfaction Quantum GIS on user performance has a coefficient value of 0.495 lanes, where the effect is significant and T-statistics (T-count) greater than T-table (3.122> 1.664) with smaller p value
from 0,05 that is equal to 0,002. This means the eighth hypothesis which states that Quantum GIS user satisfaction has a positive and significant effect on the user's performance is accepted.
Based on the original sample estimate value it is obtained that the highest value that affects the use of the system is on the quality of information that is equal to 0.742. It shows that the quality of information has an effect on the use of system higher than the influence between system quality to system usage (0,126). Furthermore, of the two variables that directly affect the user's satisfaction, namely the quality of the system and the quality of information, the greatest effect is the quality of information because it has the highest original sample estimate value of 0.568 compared to the system quality variable. Of the four variables that affect user performance, the most dominant with the highest value of the highest sample estimate 0.495 is user satisfaction. Thus user satisfaction is the most dominant variable in affecting the user performance of the system. While the most non-dominant variable is the quality of the system is the original smallest estimate sample is 0,010.
5.5. Research Implications
The results showed that the quality of the system does not affect the usability of the system and user performance. Usefulness of the system also has no effect on user performance. Therefore, future implications to the management of PDAM Kota Bengkulu can improve the quality of the system, especially the increased flexibility of users with Quantum GIS system online. Thus the system can be accessed anytime and anywhere by the user. Then, PDAM Kota Bengkulu should be able to improve the validity and the data so that the user does not doubt the existing data. Formulation of business strategy PDAM Kota Bengkulu in order to improve system user performance in order to prioritize utilization (usability) system. The higher the user satisfaction the higher the user's performance and the higher the utilization rate of the system, the higher the individual learning rate and affect the user's performance level.
6. CONCLUSION
Based on the results of the analysis that has been described, then the conclusion on the research as follows:
2604 system at PDAM Bengkulu City is the user satisfaction with the highest value of original sample estimate of 0.495. This result is in accordance with the findings of Setyo and Rahmawati (2015) which states that user satisfaction has a significant influence on user performance. End users of an information system can be used as a benchmark for success or failure of an information system (Doll and Tokzadeh in Delone and McLean, 1992). 2.From the results of hypothesis testing can be
concluded that the quality of the system significantly influence the user satisfaction and user performance. The quality of information significantly affects user usage, user satisfaction and user performance and user satisfaction significantly affects user performance. While the influence of system quality and system usage is not significant to user performance. The quality of the system is also insignificant to usage. This hypothesis was developed in accordance with the theory of the success model of Delone and McLean (1992) which states that a system will depend on the quality of the system itself.
3.Based on the results of the test by using SEM PLS method with SmartPLS software support, it is found that the system quality, information quality, system usage and user satisfaction variables affect the user performance of 0.99 or 99% variable in the theory of success model Delone and McLean (1992) users of Quantum GIS information systems at PDAM Bengkulu City.
Based on the conclusion of the research, the suggestions that can be given are as follows: 1.To increase the use of Quantum GIS
information system and to more satisfy the end user, Bengkulu City PDAM is suggested to further improve the quality of Quantum GIS system through increased flexibility by means of online Quantum GIS system so that the system can be accessed anytime and anywhere. Then, PDAM Kota Bengkulu can enrich existing data so that all existing data can be accessed by users.
2.In the formulation of corporate business strategy and in order to improve the performance of system users are advised to prioritize on user satisfaction and system usage (use). The higher the user satisfaction the higher the user's performance and the higher the utilization rate of the system, the higher the individual's learning level and affect the user's performance level.
3.This study is limited to the application of the Quantum GIS system impacting user performance based on Delone and McLean (1992) and is recommended for follow-up research by examining the impact of the success of Quantum GIS system in general to the company, such as water loss, finance to customer levels.
REFERENCES :
[1]. David Osborne Ted Gaebler. 2008. Mewirausahakan Birokrasi (Reinventing Government). Teruna Gravika: Jakarta.
[2]. Kadir, Abdul. 2005. Pengenalan Teknologi Informasi. Y ogyakarta : Edisi Kedua. Penerbit Andi
[3]. Triyani, Arita, Fitri.,& Rio, Ferdiansyah. (2017). Aplikasi Pemetaan Penderita Gizi Buruk di Kota Pekan Baru Menggunakan Quantum GIS. Journal Teknologi informasi dan Komunikasi. 8(2):125-136
[4]. Adam, Suseno, Ricky,Agus., 2002. Penggunaan Quantum GIS dalam sistem informasi Geografis, Bogor.
[5]. Aditya L, Ramadona, Hari, Kusnanto, 2011. Open Source GIS Aplikasi Quantum GIS Untuk Sistem Informasi Lingkungan,
[6]. Irwansyah,Edy . Sistem Informasi Geografis , Yogyakarta : Digiboks. 2013
[7]. Bb Mcleod, Raymond. (2001).Sistem Informasi Manajemen.Jakarta:PT.Prenbalindo.
[8]. Prahasta, Eddy. 2005. Sistem Informasi Geografis. Bandung: Informatika
[9].Heywood, I.C.S.C.S., 2002, Geographical Information Systems, 2nd Edition, Prentice-Hall, London.
[10]. Miller, M. David dkk. 2009. Measurement and Assessement in Teaching. New Jersey: Pearson Education Inc
[11]. Hamilton, S, and Chervany, N.L, 1981 Evaluating Information System Effectivenenss Part 1: Comparing Evaluation Approaches, MIS Quarterly.
[12]. DeLone, W. H., and Mclean, E. R. 1992. Information System Success: The Quest for the Dependent Variable, Information System Research, 3(1): 60-95.
[13]. Delone, W. H., & McLean, E. R. (2003) The Delone and mclean Model of Information Systems success: A ten-Year Update. Journal of Management Information Systems/Spring, 19(4), 9-30. http://doi.org/10.1073/pnas.0914199107 [14]. Elpez, I. and Fink, D. 2006. “Information System
Success in The Public Sector: Stakeholders Perspectives and Emerging Alignment Model”. Informing Science and Information Technology, Vol. 3. P. 219-230.
2605
Variable. Information System Research, 3(1), 60-95.
[16]. Seddon.P.B. 1997. A Respecification and Extension of The DeLone and McLean’s Model of IS Success, Information System Research, 8: 240-250.
[17]. Livari, Juhani. 2005. An empirical test of the DeLone and McLean model of information system success
[18]. Haryanta., (2009). Pengaruh Penerapan Sistem Informasi Perpustakaan (SIPUS terpadu versi 3) Terhadap Kinerja Pelayanan Sirkulasi di Perpustakaan Universitas Gadjah Mada. jurnal UGM. https://doi.org/10.22146/bip.8286 [19]. Iman, Sanjaya., & Awangga, Febian. (2011).
Pengukuran Kesuksesan Sistem Informasi Manajemen Frekuensi (SIMF) Dengan Model
Delone dan Mclean.
http://dx.doi.org/10.17933/bpostel.2011.090405 [20]. Pujo, Hari, Saputro., & A. Djoko, Budiyanto., Alb,
Joko, Santoso. (2015). Model Delone And Mclean Untuk mengukur Kesuksesan E-government Kota Pekalongan. Scientif Journal Of informatics.
[21]. Dekang, Setyo., & Dessy, Ari, Rahmawati. (2015). Pengaruh Kualitas Informasi dan Kualitas Sistem Informasi Terhadap Kepuasan serta Kinerja Pengguna Sistem Informasi.
[22]. Arikunto, Suharsimi. 1998. Prosuder Penelitian Suatu Pendekatan Praktek. Jakarta: PT. Rineka Cipta
[23]. Astuti & Dharmadiaksa . 2014. “Pengaruh Efektivitas Penerapan Sistem Informasi Akuntansi, Pemanfaatan dan Kesesuaian Tugas pada Kinerja Karyawan”. Jurnal Akuntansi Universitas Udayana, 9.2. 2014.
[24]. Ghozali, I. (2006). Structural Equation Modeling Metode Alternatif dengan Partial Least Squares (PLS). Semarang: Badan Penerbit Universitas Diponegoro
![Figure 2. Model Delone & McLean [15]](https://thumb-us.123doks.com/thumbv2/123dok_us/8899607.954381/3.612.90.298.73.244/figure-model-delone-mclean.webp)