4647
FINDING THE OPTIMAL PATH TO THE LOYAL CLUSTER
BASED ON RATE OF PROFIT
1SANG-CHUL LEE, 2KWANG-HYUK IM
1First Author: Department of Big Data Management, Korea Christian University, Seoul, Korea
2Corresponding Author: Department of Electronic commerce, Paichai University, Republic of Korea
E-mail: 1[email protected], 2[email protected]
ABSTRACT
With internet-based business, it is important to maintain existing customers, as well as to attract new ones. To maintain existing customers and enhance customer loyalty, companies should find low-loyalty clusters and change low-loyal customers into loyal customers. Based on the economic analysis of ROP (Rate of Profit), this research proposes a method for improving customer loyalty by transferring low-loyalty clusters into an optimal loyalty cluster. By confirmatory factor analysis, six items were deleted and thirteen items for four primary factors were remained. The analysis of a two-level SOM resulted in the development of ten market segments. To find the optimal (target) cluster for improving customer loyalty, this research calculates ROP based on gain and cost between the groups. This research determined the target cluster and the path to move into and proposed the strategies to change customer behavior. The proposed method may help companies identify the optimal cluster where a loyalty exceeds cost
Keywords: Market Segmentation, Self-Organizing Map, Customer Loyalty, Economic Analysis, Rate of
Profit.
1. INTRODUCTION
Market segmentation is one of the fundamental concepts of modern marketing [1]. Market segmentation is defined as the subdividing of a market into subsets of customers by Kotler (1997) [2]. Company tries to cluster similar customers into market segments with different and unique demands [3]. The attractiveness of each segment market is evaluated and the target segment market is selected.
Most of previous research has focused on developing clustering methodologies for market segmentation, such as hierarchical methods, partitive methods (e.g. K-means), and artificial neural network (e.g. SOM). After the development of diverse clustering methodologies, they have tested and compared the performance of the methodologies [4], [5], [6]. Some research has applied clustering methodologies in diverse markets [7], [8], [9], [10]. However, there is little research to suggest a method for enhancing the loyalty of clusters. No matter how sophisticated the methodologies, market segmentation would not be profitable unless they can help to maintain customers.
With market segmentation, one of primary issues for companies is to improve customer loyalty. Companies should be more concerned with maintaining existing customers than attracting new
customers [11]. Existing customers do not incur attraction costs. Through positive word of mouth (WOM), existing customers voluntarily support companies’ marketing activities [12]. More importantly, lower-loyal customers who are unsatisfied may be easy to leave the company. Companies should change low-loyal customers into loyal customers.
This research aims to propose a method for improving customer loyalty by moving customer who has low-loyalty clusters into the highest-loyalty cluster. When attempting to increase customer loyalty, companies should consider profitability that loyalty gained exceeds cost of investment [13]. In finance, companies calculate ROP (Rate of Profit), also known as ROI (Return on Investment), which is the ratio of revenue (gain) got or lost on an investment. They compare the efficiency of a lot of different investments and chose not an investment with higher revenue but a higher profit. Based on ROP, this research compares the rates of profit of different clusters to select which clusters to pursue in order to maximize profit.
4648 enhance customer loyalty. To indicate the actual clusters, this research segments online game market using a two-level Self-Organizing Map (SOM). Based on the economic analysis of profit, this research evaluates efficiency of investment, identifies the optimal cluster which maximizes profit, and finds the optimal path into the highest-loyalty cluster.
2. LITERATURE REVIEW
2.1 Clustering Methods
Market segmentation divides a whole markets into different segments within which customers have similar requirements [2]. The primary methodology for market segmentation is clustering. Several methodologies for market segmentation, such as hierarchical methods, partitive methods (e.g. K-means), and artificial neural network (e.g. SOM) have been developed.
Hierarchical methods can be further divided into agglomerative and divisive algorithms. However, the hierarchical method cannot provide a unique clustering because partitioning to cut the dendrogram is not precise. It ignores that the within-cluster distance is different for different within-clusters [14], [15].
Partitive methods divide into a predefined number of clusters by trying to minimize some criterion or error function [15]. The K-means algorithm is an iterative scheme that evolves K crisp, compact and spherical clusters in the data [16]. However, the number of clusters is predefined, but it may be part of the error function. The partitive method cannot identity the precise number of clusters [15], [16], [17].
SOM, developed by Kohonen (1990), is very suitable for clustering [18]. An ordered dimensionality-reducing mapping of the training data is implemented using SOM. It has prominent visualization properties. The input layer contains as many neurons as it has variables. The output layer has neurons that are arranged in a rectangular or hexagonal pattern, called the map [18]. The benefit of SOM is that it effectively reduces the complexity of the reconstruction task and noise. However, it is sensitive to noise and outliers. It is also difficult to set up the training parameters [15].
To address these problems, a two-level SOM is proposed by Vesanto and Alhoniemi (2000) and combined SOM and K-means [15]. Instead of clustering the data directly, in a two-level SOM, a large set of prototypes is formed. The prototypes can be interpreted as proto-clusters. It is combined to
form the actual clusters in the next phase. The same cluster as its nearest prototype is belonged to each data vector of the original data set. Because the prototypes are local averages of data, the prototypes were less sensitive than the original data. Finally, the DB (Davies-Bouldin) index is used to select the best of the different partitioning.
2.2 Performance of Clustering Methods
The primary issues of previous segmentation research have been twofold: comparing performance of methods and improving customer loyalty. First, previous researchers have compared the performance of the methodologies, because of selecting the best clustering method among many methods. Balakrishnan et al. (1996) compared a specific neural network (e.g. FSCL) with K-means [7]. Mangiameli et al. (1996) compared the methods single linkage, complete, average, centroid method, Ward's method, Kth neighbor and SOM [5]. Mingoti and Lima (2006) compared single, complete, average, Ward, K-means, fuzzy, and SOM methods [6]. In the seminal works, Vesanto and Alhoniemi (2000) compared various agglomerative and partitive (k-means) clustering algorithms with the two-level SOM method [15]. Lee et al. (2006) compared K-Means, SOM and the two-level SOM and indicated that a two-level SOM was more accurate in classification than K-means and SOM [19].
Mostafa et al. (2018) compared eight data mining classification techniques; such as expectation maximization (EM), and K-mean clustering, Bayes net, Naïve Bayes, K star, filtered classifier, decision table, J48, and JRIP to find the best result of combining clustering [20]. Imane et al. (2018) developed PCA K-Means to determine the initial centroid in K-Means using PCA factor scores [21]. Cuadros et al. (2014) developed a segmentation framework using customer lifetime value (CLV), current value, and client loyalty and to build client segments by self-organized maps [22]. Namvar et al. (2011) developed a new customer segmentation method using RFM, LTV, and demographic features by data mining tools [23]. Holmbom et al. (2011) conducted customer portfolio analysis (CPA) using SOM [24]. Yao et al. (2012) developed a framework for a visual customer segmentation and response modeling using a self-organizing map to detect changes in customer behavior during a sales campaign [25].
4649 a long term customer relationship. Liao and Chen (2004) extracted marketing knowledge patterns and rules using association rules [26]. Cho and Kim (2004) proposed a recommendation methodology using K-nearest neighbor [27]. Kuo et al. (2005) found the solution for analyzing Web browsing paths using neural network and genetic algorithm [28]. Cho et al. (2005) proposed a new methodology for enhancing the quality of recommendation using self-organizing map [29]. Min and Han (2005) suggested a method to detect a user's time-variant pattern using self-organizing map [30].
However, these researches found the target customer but did not suggest how to make the loyal customer. The ultimate purpose of segmentation is to develop a business strategy to build long term relationships. It is necessary to develop the method of changing to a loyal customer
3. METHOD AND PROCEDURE
3.1 Rate of Profit
Based on the economic analysis of ROP, this research proposes methods for finding the optimal cluster and for improving the loyalty of customers. ROP is the ratio of output (revenue) gained or lost on
an investment, relative to the amount of input (cost) invested [13]. When selecting the best choice for alternatives, companies have to consider the rate of profit because getting the higher revenue incurs the higher cost. The purpose of this study is to move low-loyalty customers into the highest-loyalty cluster. However, it takes a lot of cost to transfer them into the highest-loyalty cluster directly. They need to calculate efficiency of investment, identifies the optimal cluster which maximizes profit, and finds the optimal path into the highest-loyalty cluster.
[image:3.612.136.514.435.713.2]In ROP, output gained or lost may be referred to as money, interest, revenue/loss or gain/loss. Input invested may be referred to as the asset, capital, or cost. ROP is expressed as a percentage rather than a fraction. For the purpose of increasing customer loyalty, this research defines gain (output) as the increase/decrease in loyalty and cost (Input) as the distance between clusters. Based on SOM which visualized the distance structures and the closeness of neighboring nodes, this research hypothesizes that the longer distance may incur the more cost. This research defines cost as the distance, where it is more expensive to move a long distance [15]. Companies should maximize profit which defined as the rate of gain divided by cost.
4650
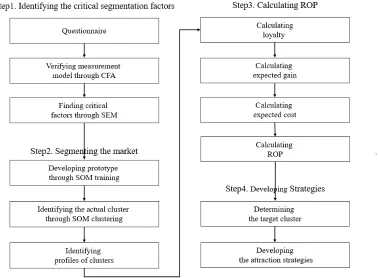
3.2 Proposed Procedure
To segment the market and develop marketing strategies, procedure is categorized into four phases in Figure 1. The first phase is to identify the critical segmentation factors. Using confirmatory factor analysis, the critical segmentation variables for clustering are identified. Regression is used to identify the primary clustering.
The second phase is to develop the actual clusters and to segment the market using a two-level SOM. The prototypes from large data set are developed in the first level. The actual clusters are developed in the second level. After segmentation, the characteristics of sub-divided clusters are recognized.
The third phase is to calculate ROP based on the loyalty and the distance between the groups. It is ideal to attract all lower loyalty group into the highest loyalty group. If the distance between groups is long, however, attraction to the highest loyalty group spends a lot of marketing costs. Therefore, managers have to consider gain versus cost. They have to select not the highest loyalty group, but the group that has the highest expected profit rate as a target cluster.
The final phase is to determine the target cluster and to develop the attraction strategies for each
group to shift a target cluster. To develop the strategies, this research identifies the gap between present group and target group. After that, companies should decide what effort to reduce the gap between the two groups.
4. SIMULATION STUDY
4.1 Identifying the Critical Segmentation
Factors
For market segmentation, companies need to identify the primary variables that represent their customers’ requirements, attitudes and habits [2]. Through review of the relevant literature, four primary factors for successful online games were found: the feedback, the design, the information, and the virtual community.
[image:4.612.137.478.423.709.2]The feedback is the response from the online games [31]. The design is defined as a design interface that makes gamers feel online games are part of the real world [32]. The information is the specificity of cues or instructions that enable players to achieve their goals [31], [33]. Virtual community is computer-mediated spaces for integration of member-generated content and communication [34].
4651 By confirmatory factor analysis, delete six items of them. Finally, there are only thirteen remaining items as a primary content of questionnaire.
4.2 Segmenting Market by Clustering
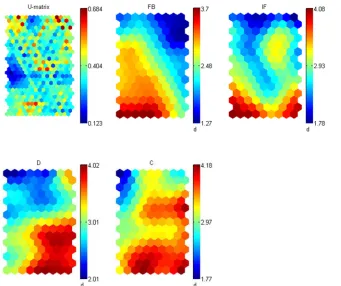
To segment the market, a two-level SOM was conducted. In the experiments, the first level was SOM training. 1704 data samples were. A SOM was trained using the training algorithm for data samples. A neighborhood width decreased linearly 5 to 1 using the Gaussian function. A map was used by 19*11 matrix and 209 prototypes were developed. The visualization of U-matrix (the Unified Distance Matrix) and component plane were shown in Figure 2. Distances between prototype vectors of neighboring map units were shown in U-matrix. The
values of the variables in each cluster were shown in component planes.
By SOM clustering in the second level, 209 SOM’s prototypes was carried out using K-means algorithm. It ran multiple times for each k. The best clustering was selected by DB index. The analysis of the DB index resulted in the development of ten market segments in Figure 3.
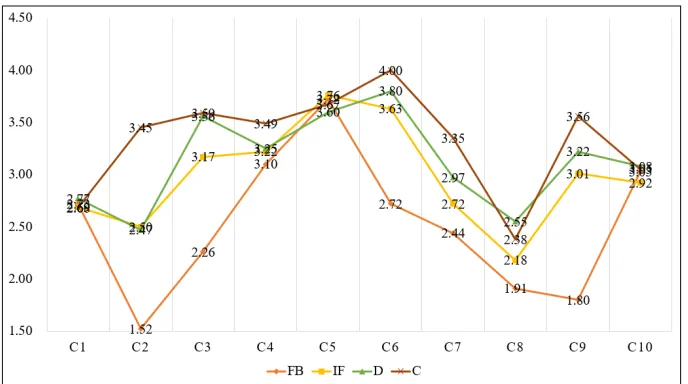
[image:5.612.110.495.66.253.2]After segmenting the markets, this research recognizes the variable characteristics of each cluster, as shown in Figure 4. According to results, the feedback was the lowest in all clusters. Cluster 1 indicated all variables were similar. In cluster 2, virtual community was higher but the feedback was the lowest. In cluster 3, the feedback was lower and the others were similar. In cluster 4, all variables were similar. In cluster 5, all variables were higher and similar. In cluster 6, the feedback was normal Figure 3: Results Of A Two Level SOM
[image:5.612.141.485.525.717.2]4652 and the others were the highest. In cluster 8, all variables were similar and lower. In cluster 10, all variables were similar and normal.
4.3 Calculating ROP
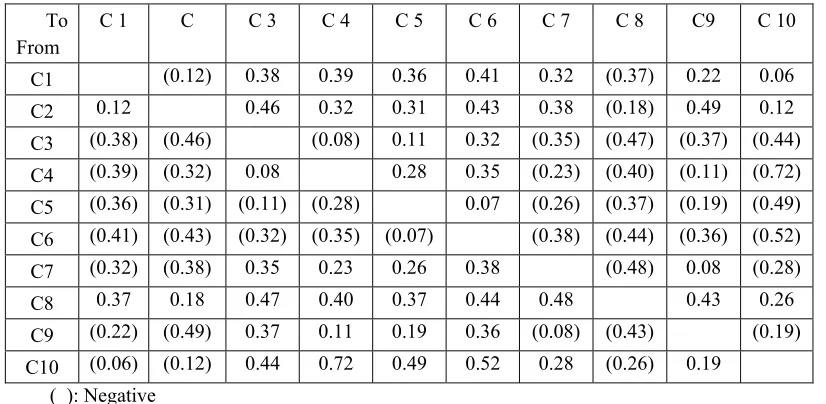
First, the loyalty of each cluster is calculated. Loyalty is estimated by revisit and WOM. Loyalty of each group is illustrated in Table 1. The analysis indicated that the ranks of the clusters are as follows: cluster 6 (4.02 average) > cluster 5 (3.94) > cluster 3 (3.76) > cluster 4 (3.69) > cluster 9 (3.54) > cluster 7 (3.48) > cluster 10 (3.28) > cluster 1 (3.24) > cluster 2 (3.07) > cluster 8 (2.86). Cluster 6 is the highest loyalty cluster.
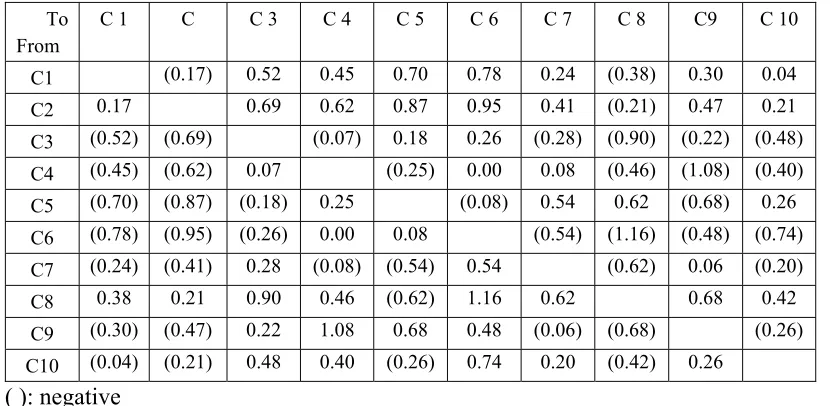
Second, gain 𝐺 , , is calculated according to the
differences in loyalty between the groups as calculated using equation (1).
𝐺
,𝐿
𝐿
(1)Here, 𝐿 represents the loyalty of groups. Gain is illustrated in Table 2.
For example, from cluster 1 to cluster 6, loyalty increases 0.78 point but to cluster 2 decreases -0.17 point. For cluster 2, the cluster increased the heighest gain is cluster 6 (0.95); from cluster 3 to cluster 6
(0.26); from cluster 4 to cluster 3(0.08) or to cluster 7 (0.08); from cluster 5 to cluster 8 (0.62); from cluster 6 to cluster 5 (0.08); from cluster 7 to cluster 6 (0.54); from cluster 8 to cluster 6 (1.16); from cluster 9 to cluster 4 (1.08); from cluster 10 to cluster 6 (0.74).
Third, cost, 𝐶 , , is calculated as the distance
between the groups using equation (2). This research measures cost as the Euclidean distance, 𝐷 𝑉 , 𝑉 , which is a distance between 𝑉 and 𝑉 using equation (3).
𝐶
,𝐷 𝑉 , 𝑉
(2)𝑉
∑
𝑋
(3)Here, 𝑉 is defined as the central (mean) value of the groups using equation. The distance may be seen in Table 3.
[image:6.612.95.510.525.728.2]The cost between cluster 1 to cluster 6 is the highest (1.95); from cluster 2 to cluster 5 (2.79); from cluster 3 to cluster 8 (1.90); from cluster 4 to cluster 8 (2.06); from cluster 5 to cluster 8 (2.93); from cluster 6 to cluster 8 (2.64); from cluster 7 to cluster 5 (1.80); from cluster 8 to cluster 5 (2.93); from cluster 9 to cluster 5 (2.10); from cluster 10 to cluster 2 (1.73).
Table 1: Loyalty of clusters
C 1 C 2 C 3 C 4 C 5 C 6 C 7 C 8 C9 C 10
Loyalty 3.24 3.07 3.76 3.69 3.94 4.02 3.48 2.86 3.54 3.28
Table 2: Gain Between The Clusters
To From
C 1 C C 3 C 4 C 5 C 6 C 7 C 8 C9 C 10
C1 (0.17) 0.52 0.45 0.70 0.78 0.24 (0.38) 0.30 0.04
C2 0.17 0.69 0.62 0.87 0.95 0.41 (0.21) 0.47 0.21
C3 (0.52) (0.69) (0.07) 0.18 0.26 (0.28) (0.90) (0.22) (0.48) C4 (0.45) (0.62) 0.07 (0.25) 0.00 0.08 (0.46) (1.08) (0.40) C5 (0.70) (0.87) (0.18) 0.25 (0.08) 0.54 0.62 (0.68) 0.26 C6 (0.78) (0.95) (0.26) 0.00 0.08 (0.54) (1.16) (0.48) (0.74) C7 (0.24) (0.41) 0.28 (0.08) (0.54) 0.54 (0.62) 0.06 (0.20)
C8 0.38 0.21 0.90 0.46 (0.62) 1.16 0.62 0.68 0.42
C9 (0.30) (0.47) 0.22 1.08 0.68 0.48 (0.06) (0.68) (0.26) C10 (0.04) (0.21) 0.48 0.40 (0.26) 0.74 0.20 (0.42) 0.26
4653 Finally, ROP of the groups is calculated. It is defined as 𝑃 , using equation (4).
𝑃
, ,, (4)
Here, 𝐺 represents gain and 𝐶 represents cost. The results can be seen in Table 4.
The ROP between cluster 1 to cluster 6 is the highest (0.41); from cluster 2 to cluster 9 (0.49); from cluster 3 to cluster 6 (0.32); from cluster 4 to cluster 6 (0.35); from cluster 5 to cluster 6 (0.07); from cluster 7 to cluster 6 (0.38); from cluster 8 to
cluster 7 (0.48); from cluster 9 to cluster 3 (0.37); from cluster 10 to cluster 4 (0.72).
4.4 Finding Optimal Path
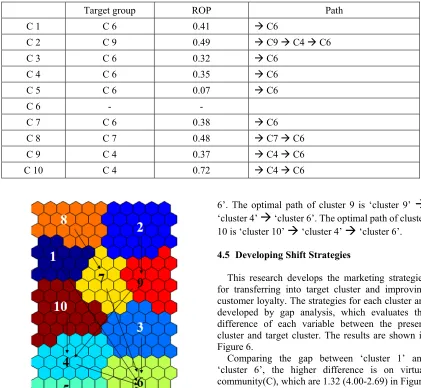
[image:7.612.97.508.123.316.2]After calculating ROP, the target clusters to move is determined. Considering ROP, the highest-profit-rate cluster is selected as optimal cluster, instead of the highest-loyalty cluster. The results are shown in Figure 5 and Table 5.
Table 4: ROP Between The Clusters
To From
C 1 C C 3 C 4 C 5 C 6 C 7 C 8 C9 C 10
C1 (0.12) 0.38 0.39 0.36 0.41 0.32 (0.37) 0.22 0.06
C2 0.12 0.46 0.32 0.31 0.43 0.38 (0.18) 0.49 0.12
C3 (0.38) (0.46) (0.08) 0.11 0.32 (0.35) (0.47) (0.37) (0.44) C4 (0.39) (0.32) 0.08 0.28 0.35 (0.23) (0.40) (0.11) (0.72) C5 (0.36) (0.31) (0.11) (0.28) 0.07 (0.26) (0.37) (0.19) (0.49) C6 (0.41) (0.43) (0.32) (0.35) (0.07) (0.38) (0.44) (0.36) (0.52) C7 (0.32) (0.38) 0.35 0.23 0.26 0.38 (0.48) 0.08 (0.28)
C8 0.37 0.18 0.47 0.40 0.37 0.44 0.48 0.43 0.26
C9 (0.22) (0.49) 0.37 0.11 0.19 0.36 (0.08) (0.43) (0.19) C10 (0.06) (0.12) 0.44 0.72 0.49 0.52 0.28 (0.26) 0.19
( ): Negative
Table 3: Distance Between The Clusters
To From
C 1 C C 3 C 4 C 5 C 6 C 7 C 8 C9 C 10
C1 1.47 1.38 1.15 1.95 1.92 0.76 1.03 1.39 0.62
C2 1.47 1.49 1.91 2.79 2.19 1.07 1.18 0.96 1.73
C3 1.38 1.49 0.90 1.57 0.80 0.81 1.90 0.60 1.09
C4 1.15 1.91 0.90 0.91 0.94 0.89 2.06 1.32 0.57
C5 1.95 2.79 1.57 0.91 1.08 1.80 2.93 2.10 1.36
C6 1.92 2.19 0.80 0.94 1.08 1.43 2.64 1.33 1.43
C7 0.76 1.07 0.81 0.89 1.80 1.43 1.30 0.78 0.71
C8 1.03 1.18 1.90 2.06 2.93 2.64 1.30 1.60 1.59
C9 1.39 0.96 0.60 1.32 2.10 1.33 0.78 1.60 1.35
[image:7.612.95.508.527.729.2]4654 Figure 5: The Optimal Path
For example of cluster 2, the optimal cluster to move is not ‘cluster 6’ (the highest-loyalty cluster), but ‘cluster 9’ (the highest-profit-rate cluster), although ‘cluster 6’ is the final target cluster. The reason is that ROP of ‘cluster 9’ is larger than that of ‘cluster 6’, respectively, 0.49 and 0.43. With regard to ROP, the path to move is ‘cluster 2’
‘cluster 9’
‘cluster 4’
‘cluster 6’. To increase customer loyalty of ‘cluster 2’, companies try to move customers in ‘cluster 2’ into ‘cluster 9’ firstly, then into ‘cluster 4 and ‘cluster 6’ step by step.The optimal path of cluster 1, cluster 3, cluster 4, cluster 5 and cluster 7 is ‘cluster 6’. The optimal path of cluster 8 is ‘cluster 8’
‘cluster 7’
‘cluster6’. The optimal path of cluster 9 is ‘cluster 9’
‘cluster 4’
‘cluster 6’. The optimal path of cluster 10 is ‘cluster 10’
‘cluster 4’
‘cluster 6’.4.5 Developing Shift Strategies
This research develops the marketing strategies for transferring into target cluster and improving customer loyalty. The strategies for each cluster are developed by gap analysis, which evaluates the difference of each variable between the present cluster and target cluster. The results are shown in Figure 6.
Comparing the gap between ‘cluster 1’ and ‘cluster 6’, the higher difference is on virtual community(C), which are 1.32 (4.00-2.69) in Figure 6(a). To develop a marketing strategy to improve virtual community, it needs to provide the guilds which were harmonized with gamers.
Comparing the gap between ‘cluster 2’ and ‘cluster 9’, the higher difference is on design (D), which is 0.75(3.22-2.47) in Figure 6(b). To develop a marketing strategy to improve design, companies could design an interface in which the game site looks real and realistic characters (Avata) and game items, which are harmonized with customers’ needs.
Comparing the gap between ‘cluster 3’ and ‘cluster 6’, the higher differences are on feedback and information, which are 0.46(2.72-2.26) and 0.46(3.63-3.17) in Figure 6(c). To develop a marketing strategy to improve feedback(FB), Table 5: Results of target group and path
Target group ROP Path
C 1 C 6 0.41 C6
C 2 C 9 0.49 C9 C4 C6
C 3 C 6 0.32 C6
C 4 C 6 0.35 C6
C 5 C 6 0.07 C6
C 6 - -
C 7 C 6 0.38 C6
C 8 C 7 0.48 C7 C6
C 9 C 4 0.37 C4 C6
[image:8.612.98.293.125.549.2]4655 companies should provide gamers with a higher level faster, items when completed their mission,.
Comparing the gap between ‘cluster 4’ and ‘cluster 6’, the higher difference is on design (D), which is 0.55(3.80-3.25) in Figure 6(d). It needs to develop a marketing strategy to improve design. Comparing the gap between ‘cluster 5’ and ‘cluster
6’, the higher difference is on virtual community(C), which is 0.33(4.00-3.67) in Figure 6(e). It needs to develop a marketing strategy to improve virtual community(C). Comparing the gap between ‘cluster 7’ and ‘cluster 6’, the higher difference is on information (IF), which is 0.91(3.63-2.72) in Figure 6(f). To develop a marketing strategy to improve
(a) Target cluster of cluster1 (b) Target cluster of cluster2
(c) Target cluster of cluster3 (d) Target cluster of cluster4
4656 information (IF), companies operate help desk, and provide how to play game.
Comparing the gap between ‘cluster 8’ and ‘cluster 7’, the higher difference is on virtual community(C), which is 0.97 (3.35-2.38) in Figure 6(g). Comparing the gap between ‘cluster 9’ and ‘cluster 4’, the higher difference is on feedback (FB), which is 1.30 (3.10-1.80) in Figure 6(h). Comparing the gap between ‘cluster 10’ and ‘cluster 4’, the higher difference is on virtual community(C), which is 0.44 (3.49-3.05) in Figure 6(i).
The difference from prior work and the contribution of this research is to propose a new method for improving customer loyalty. Previous research mainly focused on developing performance of methods did not suggest a method to make loyal customers. However, developing performance of segmentation would not be profitable unless companies can help to make loyal customers. Based on the economic analysis of ROP, especially, this research proposes a method for improving customer loyalty by transferring low-loyal customers into an
optimal loyalty cluster (the highest-profit cluster). Conclusively, the proposed method of this research was proved to be able to find the best path for loyal customers. Companies can find the path into loyal customers, as they can chose the best investment strategy using ROI in finance.
5. CONCLUSIONS
With internet-based businesses, customer defection often takes place because of the fierce competition and diversity of selection. The emphasis on maintaining existing customers has increased because the cost of maintaining existing customers is cheaper than that of attracting the new ones [11], [12]. To maintain existing customers and enhance customer loyalty, companies need market segmentation [3]. Based on the economic analysis of ROP, this research proposes a method for improving customer loyalty by transferring low-loyal customers into an optimal loyalty cluster (the highest-profit cluster).
(g) Target cluster of cluster8 (h) Target cluster of cluster9
(i) Target cluster of cluster10
4657 This research selected nineteen items for four primary factors. By confirmatory factor analysis, six items of them were deleted and thirteen items were remained. To indicate the actual clusters, this research segments online game market using a two-level SOM. The analysis of a two-two-level SOM resulted in the development of ten market segments. To find the optimal (target) cluster for improving customer loyalty, this research calculates ROP based on gain and cost between the groups. This research determined the target cluster and the path to move into and proposed the strategies to change customer behavior, as shown in section 4.4 and 4.5.
The results have several contributions and limitations. Based on economic analysis, this research proposed the methods for improving customer loyalty by transferring low-loyalty clusters into an optimal loyalty cluster. The proposed method may help companies identify the optimal cluster where a loyalty exceeds cost. Although this research is conducted on the online game market, the proposed method could be applied to other industries. However, companies are able to improve the loyalty of their customers exactly using this method with considering their market environment. With the limitations, this research simply defined gain as loyalty and cost as distance, although gain and cost may be defined as the diverse concept. In finance, gain may be referred to as money, interest, revenue or gain. Cost may be referred to as money, marketing cost, the asset, capital, or investment. In the future researches, it is need to imply the diverse concept of gain and cost.
ACKNOWLEDGEMENT:
This work was supported by the research grant of Pai Chai University in 2019.
REFERENCES:
[1] M. Wedel, and W.A. Kamakura, Market Segmentation: Conceptual and Methodological Foundations, 2nd ed., Kluwer Academic Publishers, Boston, MA, 2000.
[2] P. Kotler, Marketing Management: Analysis, Planning, Implementation and Control, 9th ed., A Simon and Schuster Co, New Jersey, 1997. [3] W. Zikmund, and M. D’amico, Effective
Marketing: Creating and Keeping Customers, West Publishing Company, St Paul, MN, 1995. [4] P.V.S. Balakrishnan, M.C. Cooper, V.S. Jacob,
and P. A. Lewis, “A Study of Classification Capabilities of Neural Networks Using Unsupervised Learning: A Comparison with
K-Means Clustering”, Psychometrika, Vol.59, NO.4, 1994, pp. 509-525.
[5] P. Mangiameli, S.K. Chen, and D. West, “A Comparison of SOM Neural Network and Hierarchical Clustering Methods”, European Journal of Operational Research, Vol.93, 1996, pp.402-417.
[6] S.A. Mingoti, and J.O. Lima, “Comparing SOM Neural Network with Fuzzy C-Means, K-Means and Traditional Hierarchical Clustering Algorithms”, European Journal of Operational Research, Vol.174, 2006, pp.1742-1759. [7] P.V.S. Balakrishnan, M.C. Cooper, V.S. Jacob,
and P. A. Lewis, “Comparative Performance of The FSCL Neural Net and K-Means Algorithm For Market Segmentation”, European Journal of Operational Research, Vol.93, 1996, pp.346-357.
[8] F. Davies, L. Moutinho, and B. Curry, “ATM User Attitudes: A Neural Network Analysis”, Marketing Intelligence & Planning, Vol.14, No.2, 1996, pp.26-32.
[9] A. Vellido, P.J.G. Lisboa, and K. Meehan, “Segmentation of The On-Line Shopping Market Using Neural Networks”, Expert Systems with Applications, Vol.17, 1999, pp.303-314.
[10] S C. Lee, Y.H. Suh, J.K. Kim, and K.J. Lee, “A Cross-National Market Segmentation of Online Game Industry Using SOM”, Expert Systems with Applications, Vol.27, No.4, 2004, pp.559-570.
[11] K. Ng, and H. Liu, “Customer retention via data mining”, Artificial Intelligence Review, Vol.14, No.6, 2000, pp.569-590.
[12] E. Trubik, and M. Smith, “Developing a model of customer defection in the Australian banking industry”, Managerial Auditing Journal, Vol.15, No.5, 2000, pp.199-208.
[13] J.A. Kregel, Rate of profit, distribution and growth: two views, Aldine Atherton, Chicago, 2006.
[14] H. Baumgartner, and C. Homburg, “Applications of Structural Equation Modeling in Marketing and Consumer Research: a review”, International Journal of Research in Marketing, Vol.13, No.2, 1996, pp.139-161.
[15] J. Vesanto, and E. Alhoniemi, “Clustering of the Self-organizing Map”, IEEE Transactions on Neural Networks, Vol.11, No.3, 2000, pp.586-600.
4658 Analysis and Machine Intelligence, Vol.24, No.12, 2002, pp.1650-1654.
[17] J. Buhmann and H. KÜhnel, “Complexity Optimized Data Clustering by Competitive Neural Networks”, Neural Computation, Vol.5, No.3, 1993, pp.75-88.
[18] T. Kohonen, “Self-organizing Map”, Proceedings of the IEEEE, Vol.78, No.9, 1990, pp.1469-1480.
[19] S.C. Lee, J.G. Gu and Y.H. Suh, “A Comparative Analysis of Clustering Methodology and Application for Market Segmentation: K-Means, SOM and a Two-Level SOM”, Lecture Notes in Artificial Intelligence (LNAI), Vol.4203, 2006, pp. 435-444.
[20] A.M. Mostafa, M. Maher and M.M. Hassan, “Enhancing clustering-based classification Algorithms in e-commerce applications”, Journal of Theoretical and Applied Information Technology, Vol.96, No.18, 2018, pp.6095-6105.
[21] B. Imane, T.A. Mohammed, and T.A. Youssef, “Determination Of Initial Centroid In K-Means Using PCA Factor Scores”, Journal of Theoretical and Applied Information Technology, Vol.96, No.19, 2018, pp.6597-6606.
[22] A.J. Cuadrosa and V.E. Domínguez, “Customer segmentation model based on value generation for marketing strategies formulation”, Estudios Gerenciales, Vol.30, No.130, 2014, pp.25-30. [23] M. Namvar, S. Khakabimamaghani and M.R.
Gholamian, “An Approach to Optimize Customer Segmentation and Profiling Using RFM, Demographic Features, and LTV”, International Journal of Electronic Customer Relationship Management, Vol.5, No.3, 2011, pp.220-235.
[24] A.H. Holmbom and T. Eklund, “Customer Portfolio Analysis using the SOM”, 19th Australasian Conference on Information Systems, Dec 2008, Christchurch, pp.412-422. [25] Z. Yao, P. Sarlin, T. Eklund and B. Back,
“Combining Visual Customer Segmentation and Response Modeling”, Neural Computing and Applications, Vol.25, No.1, 2014, pp.123-134. [26] S.H. Liao and Y.J. Chen, “Mining customer
knowledge for electronic catalog marketing”, Expert Systems with Applications, Vol.27, 2004, pp.521–532.
[27] Y.H. Cho and J.K. Kim, “Application of web usage mining and product taxonomy to collaborative recommendations in e-commerce”,
Expert Systems with Applications, Vol.26, 2004, pp.233–246.
[28] R.J. Kuo, J. L. Liao and C. Tu, “Integration of art2 neural network and genetic kmeans algorithm for analyzing web browsing paths in electronic commerce”, Decision Support Systems, Vol.40, 2005, pp.355–374.
[29] Y.B. Cho, Y.H. Cho and S.H. Kim, “Mining changes in customer buying behavior for collaborative recommendations”, Expert Systems with Applications”, Vol.28, 2005, pp.359–369. [30] S.H. Min and I. Han, “Detection of the customer
time-variant pattern for improving recommender systems”, Expert Systems with Applications, Vol.28, 2005, pp.189–199.
[31] D.S. Choi, S.J. Park, and J.W. Kim, “A Structured Analysis Model of Customer Loyalty in Online Games”, Journal of MIS Research, Vol.11, No.3, 2001, pp.1-20.
[32] W. Woodcock, Game AI: the State of the Industry, Gamasutra, http://www.gamasutra. com/features/19990820/game_ai_01.html, 1999. [33] J. S. Lewinski, Developer’s Guide to Computer Game Design, Wordware Publishing Inc, Texas, 2000.