ISSN: 1992-8645 www.jatit.org E-ISSN: 1817-3195
IMPROVEMENT INTEGRATED PERFORMANCE
MEASUREMENT SYSTEM (IPMS) FOR SMALL AND
MEDIUM ENTERPRISE IMPACT OF INFORMATION
TECHNOLOGY
1
FIRLI IRHAMNI, 2BAIN KHUSNUL KHOTIMAH, 3DEWI RAHMAWATI
1
Department of Information Systems, University of Trunojoyo Madura
2,3
Department of Informatics Engineering, University of Trunojoyo Madura
E-mail: [email protected], [email protected], [email protected]
ABSTRACT
Small and medium enterprises or SMEs are a form of business that has an important role in employment. Measuring the performance of SMEs in Indonesia is empowered by the Department of Cooperatives to determine the condition of the SMEs that are under the empowerment of relevant agencies. It can be used to improve the performance of the SMEs. This research discusses Improvement Integrated Performance Measurement System (IPMS) based on Information Technology (IT) impact. IPMS is a method of measuring the performance which involves the needs of each skill stakeholder (stakeholder requirements) on the development used IT. The weighting method to analyze variables of Key Performance Indicators (KPI) used Analytic Hierarchy Process (AHP). KPI from stakeholder that the form contains: the parent business, business units, business processes and activities. Especially the analyzing of SMEs parameters based on the role of human resources used Information Technology (IT). The parameters include financial accounting, promotion, design, sale and purchase transactions, and payroll. IPMS method combined with AHP to calculated the weighting of stakeholders. Stakeholders form consists of 10 KPI and include timely product delivery ratio, amount of new customers, amount of training conducted, defective product ratio, current ratio, debt to equity, total asset turnover, gross profit margin on sales, revenue growth rate and the number of workers who received. This research identifies four Stakeholders in SMEs who formed 10 KPI. The four stakeholders are customers, labor, investors, and community. SMEs performance results score was 135.770 of 3 KPI be marked green traffic light system. Therefore, other 9 KPI were yellow and red on a traffic light system. The value score show great performance KPI in SMEs.
Keywords: Performance Measurement Systems, SMEs, IPMS, KPI, AHP.
1. INTRODUCTION
Small and medium enterprises or SMEs are a form of business that has an important role in employment that exist in Indonesia [1]. Performance measurement needs to be done because every SME should repair or perform an evaluation of the performance [2]. It is based on the East Java provincial regulations number 6 of 2011 on the empowerment of micro, small and medium enterprises explains that in order to measure the success of the empowerment program of micro, small and medium enterprises, departments / agencies / offices shall conduct an annual evaluation according to applicable regulations. Financial performance is one important factor in the growth of SME [3]. Another research to explored the conceptions of business ethics and social responsibility of SMEs [4].
ISSN: 1992-8645 www.jatit.org E-ISSN: 1817-3195 outside the department which is to determine the
performance of SMEs which can be used as an evaluation by the department [8].
SMS implementation is mostly associated with e-commerce. Rahayu and Day [9] investigated the factors affecting SMEs in developing countries in adopting e-commerce. Customer satisfaction is a priority in e-commerce. Nurhayati et al [10] proposed software quality assurance to evaluated e-commerce customers satisfaction in requirements engineering process. Improved performance of an SME requires a variety of interests that can not be ignored. Aside from the financial aspect, there must be a system design for performance measurement that is useful to present all the activities of SMEs, both in terms of the activities that internal and external in terms of SMEs.
By utilizing information technology, the Internet can help the SMEs to expand the network [11]. The product can perform promotion strategies not only through the cast alone. SMEs can use the online media to promote it. Technologies for knowledge sharing in SMEs are Web 2.0 Technologies [12]. The cost of promotion used online media is much less costly. For the promotion of their products directly to the display is also to be balanced with the promotion online on the internet in order to be widely known. Therefore the SME entrepreneurs should be able to take advantage of this promotion through online media, because it is very effective and efficient [13].
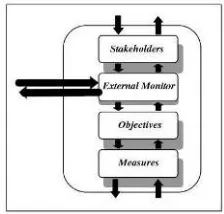
The Integrated Performance Measurement System (IPMS) method is at least some level there must be: the parent business, business units, business processes and activities. IPMS is one method of performance measurement method that involves the needs of each stakeholder and monitor the position of its competitors. At each level consists of stakeholders, external monitor, objectives and performance measurement. IPMS can be used for a wide range of measurements such: deploys policy and strategy, and obtains feedback from various levels in order to manage the performance of the business [14]. IPMS method could be combined with Analytical Hierarchy Process (AHP) to compare performance of stakeholders [15]. Critical success factor of SMEs can be identified using Key performance indicators (KPI) [16].
This research develops a performance measurement method that has an integrated approach to performance measurement system or commonly abbreviated as IPMS method using
AHP. It can produce the strategy map of SMEs. This research uses are primary and secondary data. Then the initial steps to identify stakeholders and the organizational structure of companies associated with the company objective. After that each KPI will be weighted by AHP on each KPI respectively. Using a scoring system IPMS to determine the extent of achievement of each KPI. So, final step to analyze the condition and improvement of each KPI. In preparation of criteria related to organizational structure and stakeholder Level and sub-criteria that are below the level. In order to realize the satisfaction of those stakeholders is perfect. Exactly, the management company needs to consider what strategies should be done, as well as the ability of what it must be prepared to carry it out. From some KPIs that have been designed, there are KPI omitted after being validated by the company.
2. METHODOLOGY
Performance measurement is a planned and integrated approach that is used to create a success in an organization that is characterized by an increase in the performance of those involved in such work and can develop capabilities contribute individually and in teams. Performance measurement integrated for monitor and control activities. The activities of the organization must be continuously to achieve the program, especially the lack of progress in terms of achieving long-term goals of the organization. The organization to determine the level of performance of the organization, this is done to determine the state of the organization, to determine an organization has gone well with the marked achievement of the goals of the organization which has been established or to find an organization suffered a setback with the failure to achieve goal which have been set. The measurement of organization carried out continuously generated useful form of product performance, service to customers, and also processes undertaken in carrying out such organizations. To determine the performance measurements are six categories include: Effectiveness, Efficiency, Quality, Timeliness Productivity, and Safety [17].
2.1 Integrated Performance Measurement
System
ISSN: 1992-8645 www.jatit.org E-ISSN: 1817-3195 efficient to be used as a decision support system.
[image:3.612.125.237.121.228.2]The four levels of business in the IPMS in Figure 1.
Figure 1: The division of Level Business Organization
2.2 Analytical Hierarchy Process
AHP contains a hierarchy that outlines a series of multi-criteria problems [18]. Mathematical calculations on AHP can be done with the use of a matrix. The weighting criteria are used as a solution for the decision. Step 1, made pairwise matrix for each criterion and summing the values that have been obtained from the first step for each column. Step 2, made matrix normalization, the way is to divide each column with the number of columns. Step 3, looked for weights to each criterion, this is done by summing all the values of each row of the matrix normalization has been done before then performed surgery division by the number of criteria. Step 4, performed matrix multiplication operations between the weighting for each criteria that have been calculated in step four. Step 5, the distribution of the results of the matrix with a weight value to each criterion.
There is level of consistency was 10% down, this means that the level of consistency is acceptable, but if it exceeds 10%, then the level of consistency is unacceptable and must be made taking the matrix from the beginning and perform calculations AHP until results acceptable level of consistency.
2.3 Scoring System and Traffic Light System
The performance measurement model can be combined with the model scoring system that is a model as its function to equalize the scale of the value of each indicator, so that the achievement of the every existing parameters to determine the performance of the company. Traffic Light System is then used to determine where the KPI should be improved by showing the color level. Scoring system are steps used to determine value of the achievement performance indicators have been scored system can be determined using the higher is better, lower is better, must be zero, or must be one.
Calculation of the value of the achievement of performance for each KPI is generated through to three following provisions. Higher is better is the method used if the KPI results show the higher the value the achievement of KPI has a good indication of the value and KPI scores higher. Score = (actual / target) x 100%. Lower is better is the method used if the KPI results indicate the lower the value the achievement of KPI has a good indication of the value and KPI scores higher. Score = (2- (actual / target)) x 100%. Must be zero is a method that has a value score = 100 if the actual value = 0 or score = 0 if the actual value ≠ 0. Must be one is a method that has a value score = 100, if the actual value owned = 1 or score = 0 if the actual value ≠ 1.
Scores that have been obtained be categorized into a traffic light system. Traffic light system is the mark of any indicators of performance, this marker explain the purposes of repair or is not of the performance indicators have presented in three colors signed. Color Green means the level of achievement of the performance indicators has been achieved. Limit value of the score is a score of ≥ 80. Color Yellow means the level of achievement of these indicators have been close to the target but has not reached the desired performance indicators. Thus management should try to be aware of the possibility. Limit value of the score is 56 <score <80. Color Red means the level of achievement of performance indicators below the target. This must be done immediately in order improvements in performance indicators such as indicators ykinerja established initially. Limit value of the score is a score ≤ 55.
2.4 Level of SMEs Business Organization in
Integrated Performance Measurement
System (IPMS)
ISSN: 1992-8645 www.jatit.org E-ISSN: 1817-3195
Figure 2: The division of Level Organization Bussines of SMEs
Setting goals based on priority development needs along with targets and timescales appropriate. Interest should also be based on a number of inputs that thought; stakeholder demand, the performance of a competitor's business, customer wishes and plans of competitors, the level of performance to match realistic target results. The performance level of organization of SMEs have the ability to achieve it by eliminating various existing boundaries (potential targets) and the distribution system level approach organizations can be seen each stakeholder is then identified needs and made the selection to see the similarities needs of each stakeholder. The explained the flow of existing business processes and organizational structure of SMEs in Figure 3. Figure 3 describes there are four interested stakeholders to SMEs. Of the four stakeholders, can be formed objective of each stakeholder. Objective is used to form the critical success factor (CSF). CSF is a guideline or provisions that can be used as a reference in order to achieve the desired success. CSF goal is to identify objectives more clearly and in more detail in accordance with the targets to be achieved. With the CSF, it can be established indicators of success, or commonly referred to as key performance indicators (KPI). Below is a table of CSF and KPI analysis formed.
[image:4.612.313.519.270.586.2]Figure 3: Organizational Structure of SMEs and Stakeholders Involved
Table 1: Analysis of CSF and identification of KPI
SMEs STAKEHOLDER
Stakeholder of Customer
Stakeholder of Labour
Stakeholder of Investor
Stakeholder of Society
1.Increase customer satisfaction and loyalty
1.Improving the quality of human resources 2.Improve
the quality of the product
1.Increase revenues and profits of SMEs
1.Increase efforts to employment
KPI
1.Ratio timely product of delivery 2.The
number of new customers
1.The amount of training conducted 2.The ratio
of defective products
1.Current ratio 2.Debt to
equity 3.Total asset
turn over 4.Gross
profit margin on sales 5.The level
of revenue growth
1.Total labor received
From Table 1, it can be formed 10 key performance indicators that can be identified: Customer, Labor, Investor and Society. In Stakeholder of Customers, there are some KPIs are used in measuring the performance of SMEs of Batik, among others: The ratio of on-time product delivery and the number of new customers. Stakeholder Labor also have an influence in the advancement of SMEs, KPIs are used in labor stakeholder namely: The number of training undertaken and the ratio of defective products. Business: Ministry of Small and
Medium Enterprises
Business Process: Sale Sub- Business: Part Micro and
Medium
Unit Business:Small and Medium Enterprises
Activity
Department of Cooperatives
Owner Treasurer of
SMEs Division of SMEs
Customer
[image:4.612.312.520.271.586.2]ISSN: 1992-8645 www.jatit.org E-ISSN: 1817-3195 Investors are investors who build SMEs and
financial control of the business processes that occur in SMEs. KPI measurement in the Investor stakeholders Batik SMEs, among others: Current ratio, Debt to equity, Total asset turn over, Gross profit margin on sales, and Revenue growth rate. SMEs are also influenced by the progress of the public response to the presence of the SMEs. A comparison of the performance of SMEs should be made available to the public response. Stakeholder community of KPI is established. The amount of labor of KPI is acceptable.
3. APPLICATION IPMS IN SMEs
Identification of Key Performance Indicators (KPI) set by requirements (Requirement) that have been identified through preliminary questionnaire distributed to SMEs. Having obtained the stakeholder requirements, then do benchmarking with competitors similar SMEs so that it can be seen the position of SMEs. Exactly, the performance indicators of KPI are typically used to measure various qualitative parameters contained in a company that is usually quite difficult to measure by the standard system. A metric can be considered as a KPI if it fulfills several criteria that have a threshold value, has a target, and outcome-oriented. Thus, not all of the matrix can be regarded as KPIs and used to measure the achievement of work performance of a company.
Stages in the starting method of identifying stakeholders then specify the requirement in the form based on existing stakeholders. The next step is to form objective. Objective was formed to KPI preparation in SMEs is to make the right job description and complete in accordance with the actual conditions of SMEs. Next, you need to specify the objective or purpose of each component company. Based on the objective or purpose, how created an indicator of success of each objective. This is what is usually known as KPI or Key Performance Indicators. The last step of preparation is to make the KPI Key Initiatives or Action Plan of each target that has been set figure 4. In the last step is also carried out an evaluation of the action to be performed by the owner of the company to achieve its targets. The results of these evaluations are written so that it can be formulated into a reference.
This research aims to determine the need corporate stakeholders (Stakeholder Requirement) and to improve and enhance the performance of company. The method used is the method of
[image:5.612.309.522.146.318.2]Integrated Performance Measurement Systems (IPMS) in combination with the Analytic Hierarchy Process (AHP).
Figure 4: Preparation of SMEs Hierarchy Performance
3.1 The Feature Weights Of Criteria Derived By Analytic Hierarchy Process
An initial matrix for the firm’s pairwise comparisons in which the principal diagonal contains entries of 1, as each factor is as important as itself. Table 2 shows the scale used to represent different preference degrees in this case study and Table 3 shows the resulting RIWs after the pairwise comparison of the attributes of the various criteria in each level of the hierarchy structure.
Table 2: Scale Comparison of AHP
Customer Labour Investor Society
Customer 1 3 3 9
Labour 0.333 1 3 7
Investor 0.333 0.333 1 3
Society 0.111 0.143 0.333 1
Total result 1.778 4.476 7.333 20
Customer Labour Society
1.Timely product delivery ratio 2.The
number of new customers
1.The amount of training conduct ed 2.The
ratio of defectiv
1.Curre nt ratio 2.Debt
to equity 3.Total
asset turn over 4.Gross
profit
Total labor received Invest
ISSN: 1992-8645 www.jatit.org E-ISSN: 1817-3195
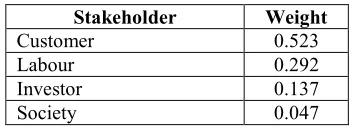
The calculation of weight use AHP. In determining the weights, the scale of comparison used in accordance with the scale of the comparison determine the objectives to be achieved then formed the KPI. KPI that have been set up arranged into a hierarchy based on stakeholder. As shown in Figure 4 and Table 4. Eigen values vector obtained by dividing the sum by the number of stakeholders [16]. The number of stakeholders is 4. Results obtained to customers amounted to 0.523 stakeholders, to labor stakeholders is 0.292. For stakeholders of investor is 0.137 and stakeholder of community of 0.047. After the calculated the eigenvalues max. Eigen value max of each stakeholder in get by dividing the value of the results of the Eigen vectors, After getting the Eigen value max for each stakeholder did the sum of all eigenvalues max, the value of the sum divided by the number of stakeholders and was called with λ max values. λ max value is 4.127. Then calculate the value of Consistent Index (CI) and the resulting value of CI is 0.042, calculate the value of Consistent Ratio (CR). The resulting value of CR is 0.047. CR value ≤ 0.1, then the weight value is consistent and the weight of each stakeholder obtained in table 5.
4. RESULTS
Stakeholders and KPIs that have been specified then calculated using the results of its performance scoring system and then be categorized into indicator lights or commonly called traffic light system.
Two SMEs (A and B) were involved in this case study. The data from January to May 2015 provided
[image:6.612.329.506.578.643.2]by the Department of Cooperatives and SMEs of Bangkalan, district in Indonesia. Figure 6 and 7 describe the actual value of SME A and B. Target value provided by Department. The actual value describes the condition of SMEs. The actual value is the value that determines whether the KPI values equal, smaller or larger than the predetermined targets. While determine the score, can choose higher or lower score. This score must accordance with the conditions of data to be processed. The next step, determine the traffic light system for KPI. This determination in accordance with the threshold value that has been given by the Department such limit values have been described in the literature review above. The next step is to determine the value of the weighted scores. This value is the value of the multiplication of the score by the weighting KPI and balanced stakeholder by stakeholder weights. Having obtained the scores weighted value of all the stakeholders, then the value of the performance of SMEs is the sum of all the weighted score of the stakeholders.
Table 5: Weight of Stakeholder
Stakeholder Weight
Customer 0.523
Labour 0.292
Investor 0.137
Society 0.047
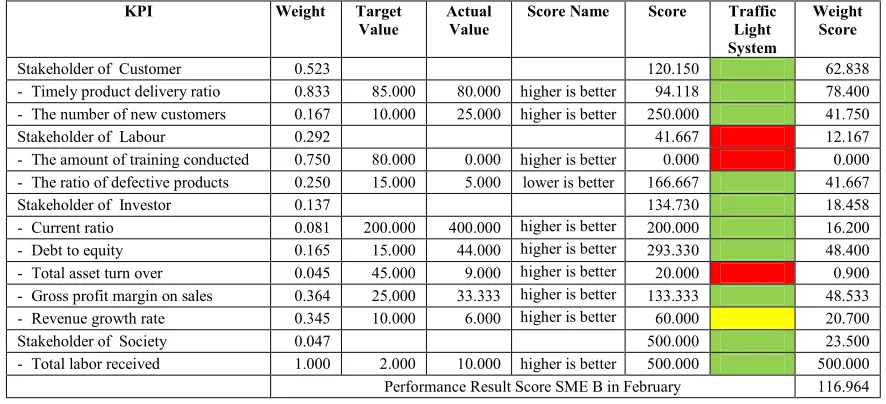
Whereas in table 7 below explain the score for SME B in February and in table 9 below explain the score for SME B from January to May. According to the table 6, the value of the performance of SME in February reached 99.580. The category of this performance is good. In February, seven KPI has reached the target system and the traffic light is
Table 3: Eigen Vector Value
Criteria Customer Labour Investor Society Number
of lines
Eigen vector
Cutomer 0.563 0.670 0.409 0.450 2.092 0.523
Labour 0.188 0.223 0.409 0.350 1.170 0.292
Investor 0.188 0.074 0.136 0.150 0.548 0.137
Society 0.063 0.032 0.045 0.050 0.190 0.047
Table 4: Value Results Matrix Multiplication
Criteria Customer Labour Investor Society Number of
lines
Eigen vector
Cutomer 1 3 3 9
X
0.523 2.239
Labour 0.333 1 3 7 0.292 1.210
Investor 0.333 0.333 1 3 0.137 0.551
ISSN: 1992-8645 www.jatit.org E-ISSN: 1817-3195 green. Two KPI nearing the target value that the
color is a yellow traffic light system, the KPI is the total asset turnover and earnings growth rates. One KPI has a score that is far from the target value so that the traffic light system of red, the KPI is the amount of training done. If the KPI is red, then it improved the performance of SMEs in the next month. Measure for improvement of KPI is the amount of training the quality of human resources owned by SME. Business of SMEs must follow its own or send workers held for training. While improvement of KPI total have all the assets owned by SMEs carefully for each period (5 months) and
calculate all gross income earned by SMEs. The score for SME A from January to May is shown in Table 8.
The result of the integration of IPMS method and AHP and traffic light systems show that some Key Performance Indicators marked with red on the side of the employees who need special attention to be repaired because they affect the performance of the company, which requires job training and improvement of service quality. More results as a whole has achieved performance expected because it is located in the green category.
Table 6: Performance Result Score SME A in February
KPI Weight Target
Value
Actual Value
Score Name Score Traffic
Light System
Weight Score
Stakeholder of Customer 0.523 108.350 56.667
- Timely product delivery ratio 0.833 85.000 85.000 higher is better 100.000 83.300
- The number of new customers 0.167 10.000 15.000 higher is better 150.000 25.050
Stakeholder of Labour 0.292 31.667 9.247
- The amount of training conducted 0.750 80.000 0.000 higher is better 0.000 0.000
- The ratio of defective products 0.250 15.000 11.000 lower is better 126.667 31.667
Stakeholder of Investor 0.137 108.515 14.867
- Current ratio 0.081 200.000 425.000 higher is better 212.500 17.213
- Debt to equity 0.165 15.000 20.370 higher is better 135.802 22.407
- Total asset turn over 0.045 45.000 35.000 higher is better 77.778 3.500
- Gross profit margin on sales 0.364 25.000 27.143 higher is better 108.571 39.520
- Revenue growth rate 0.345 10.000 7.500 higher is better 75.000 25.875
Stakeholder of Society 0.047 400.000 18.800
- Total labor received 1.000 2.000 8.000 higher is better 400.000 400.000
[image:7.612.88.531.489.691.2]Performance Result Score SME A in February 99.580
Table 7: Performance Result Score SME B in February
KPI Weight Target
Value
Actual Value
Score Name Score Traffic
Light System
Weight Score
Stakeholder of Customer 0.523 120.150 62.838
- Timely product delivery ratio 0.833 85.000 80.000 higher is better 94.118 78.400
- The number of new customers 0.167 10.000 25.000 higher is better 250.000 41.750
Stakeholder of Labour 0.292 41.667 12.167
- The amount of training conducted 0.750 80.000 0.000 higher is better 0.000 0.000
- The ratio of defective products 0.250 15.000 5.000 lower is better 166.667 41.667
Stakeholder of Investor 0.137 134.730 18.458
- Current ratio 0.081 200.000 400.000 higher is better 200.000 16.200
- Debt to equity 0.165 15.000 44.000 higher is better 293.330 48.400
- Total asset turn over 0.045 45.000 9.000 higher is better 20.000 0.900
- Gross profit margin on sales 0.364 25.000 33.333 higher is better 133.333 48.533
- Revenue growth rate 0.345 10.000 6.000 higher is better 60.000 20.700
Stakeholder of Society 0.047 500.000 23.500
- Total labor received 1.000 2.000 10.000 higher is better 500.000 500.000
ISSN: 1992-8645 www.jatit.org E-ISSN: 1817-3195
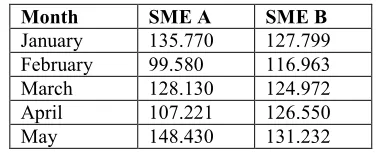
Table 10: Performance Result Score
Month SME A SME B
January 135.770 127.799
February 99.580 116.963
March 128.130 124.972
April 107.221 126.550
May 148.430 131.232
There are several results from this research. First, there are four stakeholders used in the performance measurement system of human resources among other stakeholders in the SMEs: customers, labor, investor and community.
Second, Stakeholders form of the 10 KPI include timely product delivery ratio, amount of new customers, amount of training conducted, defective product ratio, current ratio, debt to equity, total asset turnover, gross profit margin on sales, revenue growth rate and the number of workers who received.
Third, table 10 shows the results of the performance of the SME A in January was 135.770 and all the KPI are green on the traffic light system. SME A in February was 99.580 and 7 KPI are green, one KPI is red and 2 KPI are yellow on a traffic light system. SME A in March was 128.130 and 9 KPI are green and 1 KPI is yellow on a traffic light system. SME A in April was 107.221 and 8 KPI are green, one KPI is red and one KPI is yellow on a traffic light system. While SME A in May was 148.430 and all the KPI are green in traffic light system.
Fourth, the result of the performance of SME B in January 2015 was 127.799 and 8 KPI are green and 2 KPI are red on the traffic light system.
5. CONCLUSION
Based on the results of scores of SMEs, it can be made a strategy map. The strategy map is used to determine the causal relationship between stakeholders. The strategy map is analyzed by looking from the lowest level to the highest level. The lowest level has at least some influence on the performance of SMEs. The highest level has a great influence on the performance of SMEs. The lowest level in the strategy map is stakeholder community because the existing KPI on these stakeholders are KPI amount of energy received not have a relationship with other KPIs in the KPI other stakeholders. About the level of labor stakeholders, the KPI defective product ratio has an influence on the number of new customers at customer
stakeholders. If the value of the KPI scores defective product ratio increases, the value of the number of new customers KPI scores would go down because the more a product defect exists then the number of customers are drop. This is evidenced by the score of SME B in January to April 2015. While at timely product delivery ratio affect the KPI gross profit margin on sales that of the investor stakeholders. If KPI timely product delivery ratio increases, the KPI gross profit margin on sales also increased. It is the same as the score data of SME B for February to March 2015. Indicator of KPI that exist in this system affect the strategy developed by SMEs, so that the strategy used to carry out the mission which has been built and realize the vision that has been set. Map strategy of SMEs in Figure 5.
REFRENCES:
[1] International Labour Organization. Labor and social trends in Indonesia 2013.
[2] Patrizia Garengo, Stefano Biazzo and Umit S. Bititci, “Performance measurement systems in SMEs: A review for a research agenda”, International Journal of Management Reviews Volume 7 Issue 1 pp. 25–47, March 2005. [3] Nuttaneeya Ann Torugsa, Wayne O’Donohue
and Rob Hecker. “Capabilities, Proactive CSR and Financial Performance in SMEs: Empirical Evidence from an Australian Manufacturing Industry Sector”, Journal of Business Ethic, Volume 109, Issue 4, pp. 483-500, September 2012.
[4] Geert Demuijnck, Hubert Ngnodjom, “Responsibility and Informal CSR in Formal Cameroonian SMEs, Journal of Business Ethic”, Volume 112, Issue 4, pp. 653-665, February 2013.
[5] Juan Li, Ross Jeffery, Kam Hay Fung, Liming Zhu, Qing Wang, He Zhang and Xiwei Xu, 2012. A Business Process-Driven Approach for Requirements Dependency Analysis, 10th Interbational Seminar, BPM, Estonia, Springer, September.
ISSN: 1992-8645 www.jatit.org E-ISSN: 1817-3195 [7] Rami-Habib Eid-Sabbagh, Remco Dijkman
and MathiasWesk, 2012. Business Process Architecture: Use and Correctness, 10th Interbational Seminar, BPM, Estonia, Springer, September.
[8] Mehmet Demirbag and S.C. Lenny Koh. 2006. TQM and market orientation’s impact on SMEs’ performance, Industrial Management & Data Systems, Vol. 106, No. 8, pp. 1206-1228.
[9] R. Rahayu and J. Day, “Determinant Factors of E-commerce Adoption by SMEs in Developing Country: Evidence from Indonesia, Procedia - Social and Behavioral Sciences 195, p. 142 – 150, 2015.
[10] W. Nurhayati, Asma B.K., HAzlian T., B. Josiah, W. Liming, N. Sakinah, ” Software Quality Assurance – E-commerce Customers Satisfaction in Requirements Engineering Process”, International Journal of Software Engineering and Its Applications, Vol. 9, No. 3, pp. 57-70, 2015.
[11] www.markeingquery.com/social-networks-help-business-smes/
[12] Pedro Soto-Acosta, Daniel Perez-Gonzalez and Simona Pop, 2014. Determinants of Web 2.0 technologies for knowledge sharing in SMEs, Service Busines, Volume 8, Issue 3, pp. 425-43, September.
[13] Organization for Economic Co-Operation and
Development. 2004. Promoting
Entrepreneurship and Innovative SMEs in A Global Economy : Globalisation Organisation
for Economic Co-Operation and
Development, 2nd OECD Conference of Ministers Responsible for Small and Medium-Sized Enterprises (SMEs), Istanbul-Turkey, 3-5 June 2004.
[14] Umit S. Bititci, Allan S. Carrie, and Liam McDevitt, “Integrated performance measurement systems: a development guide”, International Journal of Operations & Production Management, Vol. 17 Iss: 5, pp.522 – 534, 1997.
[15] P Suwignjo, U.S Bititci, A.S Carrie. 2000. Quantitative models for performance measurement system, International Journal of Production Economics, Volume 64, Issues 1– 3, pp. 231–24, March.
[16] Al Weber. 2005. Key performance indicators, Ivara Corporation.
[17] Andersen B and Fagerhaug T., “Performance Measurement Explained”, ASQ Quality Press, Milwaukee, Wisconsin, 2002.