5285
A COMPARISON OF EVOLUTIONARY TECHNIQUES FOR
TEST CASE GENERATION AND OPTIMIZATION
1MS. NAMITA KHURANA, 2DR. RAJENDER SINGH CHHILLAR
1Research Scholar, Department Of Comp. Sc. and Applications, M.D.U, Rohtak, Haryana, India
2Professor, Department Of Comp. Sc. and Applications, M.D.U, Rohtak, Haryana, India
E-mail:- 1[email protected] , 2[email protected]
ABSTRACT
The key objective of this paper is comparative evaluation of test case generation and optimization for two bio-inspired algorithms Genetic Algorithm and Ant Colony Algorithm. These Search Optimization techniques provide the best solution. These algorithms are used to generate test paths and then optimize them. The case study is being presented using Activity Diagram on Airline Reservation System by applying both Optimization Algorithms. Activity Diagram is transformed into Activity Graph. The Nodes of the graph show a test path which is being optimized using Genetic Algorithm and Ant Colony Optimization.The study done is measured in terms of number of iterations and execution speed. The empirical results prove that the algorithm for Ant Colony Optimization shows better results as compared to Genetic Algorithm. The proposed technique gives the comparative results of bio-inspired Algorithms. The two Algorithms can be combined to get better optimization results. The proposed technique can be used to develop automated tool.
Keywords: Ant Colony Optimization, Genetic Algorithm, Test path Generation, Test case Optimization, Activity Diagram
1. INTRODUCTION
In software development life cycle, half of the total development cost is due to software testing. This cost for testing can be reduced to a large extent if the errors can be filtered at the earlier stage. It is an important part of SDLC to ensure the quality of real-time software1. For software testing
following activities are being performed: (1) Generate the test Data (2) Execution of Test Data and (3) Evaluation of test results. However it is very typical to maintain these activities manually. Automation of testing is desired to reduce the high cost and to locate the errors. The software testing is planned to remove maximum available defects
using selected test cases. Exhaustive testing cannot be performed due to time and cost constraints in software testing1.
The major testing strategies are behavioural testing and white box testing2. White box testing
also known as structural testing is a methodology of discovering the program structure and deriving the test data from internal code. Behavioural Testing or Black-box testing tests the functionality of an application without checking its internal structures. Main objective of structural testing is to test all the
code paths with available test data inputs. For path coverage in software testing, test paths are generated and then considered for generating different test scenarios. Next step is to prioritize the path and generate the test data for that path. After generating the test path test data is evaluated and test paths are prioritized [1].
The Focus of our work in this paper is comparison of ACO and GA by generation and optimization of test paths. Ant Colony Optimization (ACO) is a popular meta-heuristic technique. This technique is used for combinatorial optimization. Genetic Algorithm (GA) is heuristic search algorithm based on natural selection and genetics. The test paths are evaluated for Airline reservation system by using both Optimization techniques. optimized results are then compared to know which one is better.
5286 optimized using Ant colony Optimization. Next section 7 concludes the paper and Figure out some important issues regarding future research. Last section reveals the references used regarding the work done in the paper.
2. PREVIOUS WORK
Three different types of techniques are used for generation of test cases like code based, specification based and model based. This section explains the survey of different research papers based on test case generation with different UML diagrams and Optimization techniques.
Biswas and kaiser [3] proposed ant colony optimization algorithm. In this paper a set of optimal paths are generated and prioritized using this algorithm. In this approach test data sequence is generated within the domain to use as inputs of the generated paths.
Maheshwari and Prasanna [4] have reviewed the literature about Automatic test case Generation. The major factors involved in test case generation are UML Diagrams, different testing Types, different testing tools, different Optimization search techniques and various other approaches.
Khandai, Acharya and Mohapatra [5] have done a literature survey on test case generation techniques using different UML models. The survey is done for different UML models for concurrent and non concurrent systems.
Srivastava and Rahurama [6] presented an approach to find all optimal paths via Ant colony Optimization. The total numbers of scenarios generated are equal to the Cyclomatic Complexity. In Sharma and Kundu [7] proposed an
algorithm, in which sequence diagram is transformed into sequence graph and then use case diagram is transformed into use case graph. A System Graph is formed by integration of the two graphs. Test cases are generated using the system graph.
Whole literature survey presents either only test case generation or test case generation with optimization using any algorithm for finding optimal path. Although evolutionary algorithm have been widely used for solving different optimization problem. Here in this paper survey is done using comparative evaluation between two Evolutionary Algorithms. The comparison between the two algorithms depends on the problem. For different problems one algorithm may perform better than the other. In this paper test cases are generated for a problem by using Activity diagram which will cover operational faults at an early stage of testing and also comparative evaluation of two
evolutionary algorithms will optimize the test cases in terms of number of iterations and execution speed.
3. ANT COLONY OPTIMIZATION
This Algorithm is encouraged by the behaviour shown by Ants which are madly exploring Food. An ant lays a certain amount of pheromone trail along the path traversed while hunting for a food source. The two purposes of the Ants are fulfilled while laying the pheromone trails. First it defines a path for other randomly moving ants and also it helps the other ants to return to their original source. While returning to the original source it again lays some pheromone trails. Now, whenever a randomly moving Ant senses pheromone fragments it will expect to follow the same path and hence by positive feedback mechanism new ant also lays pheromones on the same path. The intensity of the pheromones on the path increases. Finally the path having maximum pheromone trails will be followed by the new ant. Conclusively, the convergence to the local optimal solution is avoided using the constant evaporation rate of the pheromone trail [8].
In any case an ant definitely reaches to its original source if it randomly chooses the smallest path. This shortest path will be traversed repeatedly; this will lay more pheromones trails. In result that path will become a fair choice for other ants. Thus that path will converge to the shortest path. This process of ants moving forth and back from food source and back to its colony is called Ant colony Optimization [8].
Each independent ant on being small in size, blind and frail is able to find the shortest path and they are able to search the food source. These ants use food trails pheromones and antennas to be in touch with each other.
Ant Colony Optimization is a probability based computation problem algorithm which generates solutions traversing a graph consisting of different states of system. This algorithm is used in software testing to generate test sequences. The algorithm takes a control flow graph as input and traverses nodes to find optimized paths in the graph. Here in the paper Activity Graph is used to find the optimized path.
5287 are applied to generate optimal path in Activity Graph. The optimal paths will results with minimum redundancy.
In both the algorithms, the suits of paths are prioritized in a way such that the next path can be decided for testing. The probability of finding errors in an earlier stage reduces the software development cost. Both the algorithms are applied to generate test data sequence which will be used as input for executing every path that has been generated previously. In both cases, whole path is covered through Activity Graph. Also both algorithms will generate test path as well as test data, both will ensure effective testing by prioritizing the paths and finally both will remove redundancy. In this paper, both the algorithms are compared in terms of execution speed and number of occurrences for obtaining the optimal path for the Activity Graph.
4. ACTIVITY DIAGRAM
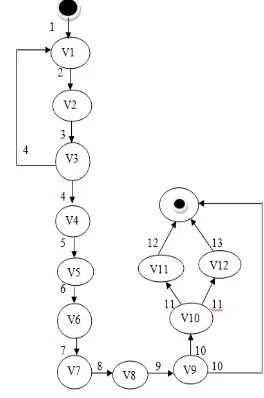
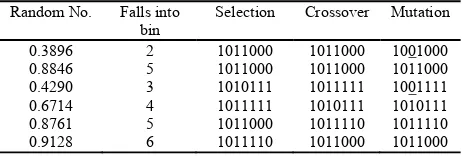
This section explains the Activity Diagram for Airline reservation system. Activity Diagram is used due to the dynamic aspects of its modeling [10]. It is basically the graphical representation of the sequence of activities. Figure1 shows the Activity Diagram for Airline reservation system and Figure 2 shows the Activity Graph for Airline reservation system.
Description:-
a. Enter arrival and departure dates in Airline Reservation System.
b. Enter personal Information and search availability.
c. Select flight and add reward points if any.
d. Hold reservation and Add payment information.
[image:3.612.314.527.85.341.2]e. Mark seats as taken and process payment and confirmation sent on E-mail.
Figure 1. Activity Diagram (AD) for Airline Reservation System
Figure 2. Activity Graph (AG) for Airline Reservation System
[image:3.612.363.495.376.575.2]5288
5. GENERATION AND OPTIMIZATION OF
TEST CASES
5.1 Genetic Algorithm for Generating
Prioritized Paths
After gathering all the information in the Activity Graph, test cases are generated. After the Generation of test cases, Optimization is done using any evolutionary algorithm. This section explains the application of Genetic Algorithm on Activity Graph for Generation and Optimization of test cases. Our proposed algorithm is as
follows[12][13]:-Algorithm 1: GEN-OPT TESTCASES
Input: - Activity Graph (AG) Output: - Optimized test cases
1. Discover all the scenarios, R= {r1, r2, r3, r4, r5…..} from start node to the end node in Activity Graph.
2. Weights are allocated to scenarios in ascending order from left to right. Individual nodes are being assigned weights as the actual weight of the sibling node is calculated from weight of the parent node. If case of any sibling having multiple parents then weight of that node is calculated by adding the weights of the parent’s node.
3. Next is to calculate the cost (x) of each scenario (path) as the cost of any path is calculated by adding the weights of all nodes on that path.
4. Genetic Algorithm is being applied to the AG.
5. Fitness value calculation
a. For each scenario calculate the value of cost(x).
b. Fitness function is applied as F(x)=x*x
c. Probability is calculated for individual as P(i)=F(x)/ƩF(x) 6. For production of new generation of
solutions best individuals are chosen from existing large initial population for mating pool.
a. Best individual’s probability range is partitioned into bins, the size of the bin depends on the relative fitness of the solution b. Random values are generated and
then checked against the bin where those values related to, selecting the individuals for the next generation.
7. Crossover operation is performed on the chromosome pairs by mating two individuals together and applying single point crossover from 4th bit from right.
8. Mutation operation is performed by mutating every third bit from left where the random number generated is less than 0.5.
9. This complete process is rehearsed till the minimization of the fitness value or the maximum number of generations is reached or all the scenarios have been traversed.
10. Test cases are optimized by generating the best scenario as output.
11. End.
5.2 Demonstration of the proposed
Algorithm (Using Genetic Algorithm):-
The Airline reservation system is used as an example. Next part shows the arithmetic representation[9][12] of Genetic Algorithm on Activity Graph for Airline Reservation System Tables 1-9.The possible scenarios generated from the above graph are:-
Scenario1:-Start:=>V1=>V2=>V3=>V4=>V5=>V6=>V7=>V 8=> V9=>end, cost=55
Scenario2:-
Start:=>V1=>V2=>V3=>V4=>V5=>V6=>V7=>V 8=> V9=>V10=>V11=>end, cost=78
Scenario3:-Start:=>V1=>V2=>V3=>V4=>V5=>V6=>V7=>V 8=> V9=>V10=>V12=>end, cost=79
Scenario4:-Start:=>V1=>V2=>V3=>V1=>V2=>V3=>V4=>V 5=> V6=>V7=>V8=>V9=>end, cost=64
Scenario5:-Start:=>V1=>V2=>V3=>V1=>V2=>V3=>V4=>V 5=>V6=>V7=>V8=>V9=>V10=>V11=>end, cost=87
Scenario6:-Start:=>V1=>V2=>V3=>V1=>V2=>V3=>V4=>V 5=>V6=>V7=>V8=>V9=>V10=>V12=>end, cost=88
5289
Table 1:- Fitness Of Initial Population
Table2:- Selection Of New Generation
Random No. Falls into bin
Selection Crossover Mutation
0.8924 6 1011000 1010111 1010111
0.7187 5 1010111 1011000 1011000
0.4376 0.6097 0.3967 3 5 2 1001111 1010111 1001110 1000111 1011111 1001000 1010111 1011111 1011000
[image:5.612.191.422.510.588.2]0.9126 6 1011000 1011110 1011110
Table 3:-Fitness Of New Generation
Sce nari o No. Chromos ome
X X*X Probabili
ty Cumulati ve Probabilit y Associat ed bin
1 1010111 87 7569 0.1561 0.1561 0-0.2
2 1011000 88 7744 0.1597 0.3158 0.2-0.4
3 4 5 1010111 1011111 1011000 87 95 88 7569 9025 7744 0.1561 0.1861 0.1597 0.4719 0.6580 0.8177 0.4-0.5 0.5-0.7 0.7-0.9
6 1011110 94 8836 0.1822 1 0.9-1
Sum 48,487
Table 4:- Selection Of New Generation
Random No. Falls into bin
Selection Crossover Mutation
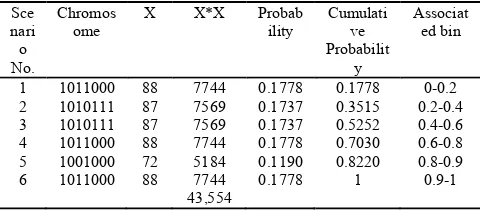
0.3896 2 1011000 1011000 1001000
0.8846 5 1011000 1011000 1011000
0.4290 3 1010111 1011111 1001111
0.6714 0.8761 0.9128 4 5 6 1011111 1011000 1011110 1010111 1011110 1011000 1010111 1011110 1011000
Table 5:-Fitness Of New Generation
Scen ario No.
Chromos ome
X X*X Probabi
lity Cumulati ve Probabilit y Associat ed bin
1 1001000 72 5184 0.1196 0.1196 0-0.2
2 1011000 88 7744 0.1787 0.2983 0.2-0.4
3 1001111 79 6241 0.1440 0.4423 0.4-0.6
4 5 6 1010111 1011110 1011000 Sum 87 94 88 7569 8836 7744 43,318 0.1747 0.2039 0.1787 0.6170 0.8209 1 0.6-0.8 0.8-0.9 0.9-1 Scen ario No. Chrom osome
X X*X Probabi
lity Cumulati ve Probabilit y Associat ed bin
1 0110111 55 3025 0.0870 0.0870 0-0.2
2 1001110 78 6084 0.1750 0.2620 0.2-0.4
3 1001111 79 6241 0.1795 0.4415 0.4-0.5
[image:5.612.183.429.620.724.2]5290
Table 6:- Selection Of New Generation
Random No. Falls into bin
Selection Crossover Mutation
0.4120 0.9265 0.7635 3 6 4 1001111 1011000 1010111 1001000 1011111 1011000 1001000 1011111 1011000
0.3127 2 1011000 1010111 1000111
[image:6.612.190.423.357.434.2]0.9745 0.6793 6 4 1011000 1010111 1010111 1011000 1010111 1011000
Table 7:-Fitness Of New Generation
Sce nari o No.
Chromos
ome X X*X Probability Cumulative
Probabilit y Associat ed bin 1 2 3 1001000 1011111 1011000 72 95 88 5184 9025 7744 0.1225 0.2133 0.1830 0.1225 0.3358 0.5188 0-0.2 0.2-0.4 0.4-0.6
4 1000111 71 5041 0.1191 0.6379 0.6-0.8
5
6 1010111 1011000 87 88 7569 7744 42,307
0.1789
0.1830 0.8168 1 0.8-0.9 0.9-1
Table 8:- Selection Of New Generation
Random No. Falls into
bin Selection Crossover Mutation
0.8635 5 1010111 1011000 1011000
0.5127 3 1011000 1010111 1010111
0.9745 6 1011000 1010111 1010111
0.8793 0.4120 0.9265 5 3 6 1010111 1011000 1011000 1011000 1011000 1011000 1011000 1001000 1011000
Table 9:-Fitness Of New Generation
Sce nari o No. Chromos ome
X X*X Probab
ility Cumulati ve Probabilit y Associat ed bin
1 1011000 88 7744 0.1778 0.1778 0-0.2
2 1010111 87 7569 0.1737 0.3515 0.2-0.4
3 1010111 87 7569 0.1737 0.5252 0.4-0.6
4 5 6 1011000 1001000 1011000 88 72 88 7744 5184 7744 43,554 0.1778 0.1190 0.1778 0.7030 0.8220 1 0.6-0.8 0.8-0.9 0.9-1
After every generation the difference between the values of chromosomes started decreasing. This shows the survival of the fittest chromosomes. The algorithm terminates with the cost value 88. By further calculations it is observed that Scenario 6 with cost value 88 is the Optimal Path traversed.
6. GENERATION AND OPTIMIZATION
OF TEST CASES (USING ANT COLONY OPTIMIZATION)
6.1 Ant colony Algorithm for Generating
Prioritized paths
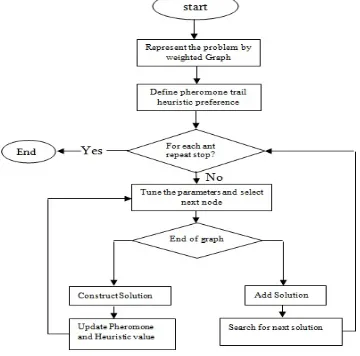
[image:6.612.186.426.485.590.2]5291 to generate paths in Activity Graph by traversing nodes. These nodes are selected based on the probability. The node having more probability will be chosen first. The probability is calculated using pheromone value (τij) and heuristic information
(ηij). The pheromone value is used by other ants to
[image:7.612.106.286.239.417.2]decide the path in future and the visibility of the path is indicated by heuristic information. Whenever an ant selects a node, two parameters, the pheromone value and heuristic information are updated. Finally all the possible paths are covered in the program module.
Figure 3:- A Standard Process Flow Of Ant Colony Optimization3
There is an ant q which is at a vertex ‘x’ and if there is another vertex ‘y’ and vertex ‘y’ is directly linked to vertex ‘x’, then there will exist a path between the vertices ‘x’ and ‘y’ i.e. (x->y). The description of all the sets and variables used in the proposed algorithm is given in Figure 3[3][6]:-
a) Node Set: N = {x,y,z,…….} represent the set of all nodes in the AG.
b) Edge Set: E = {(x,y),(y,z),….}represent all the edges in the AG.
c) Feasible Track Set: F = The direct link of current node ‘x’ and neighboring node ‘y’ is represented by {Fxy (q)}. So if there is a
connection then an edge exists from ‘x’ to ‘y’ .
If Fxy =1 then feasible path exists
between the nodes ‘x’ and ‘y’. If Fxy =0 then no feasible path
exists between the nodes ‘x’ and ‘y’.
d) Pheromone value: τ =The value of the pheromone level on the feasible path (x->y) for an ant ‘q’ is represented by
{τxy (q)}. After traversing an edge (x,y)
pheromone level ,τ is updated ,then the decision will be taken by the other Ants on the basis of this updated value.
e) Heuristic Value set : η= Thevisibility of a path (x,y) for an ant ‘q’ is being shown by {ηxy(q)}.
f) Visited status set :Vs = The information about the node ‘x’ which is already traversed by the ant q or not is represented by {Vs(x)} .
If Vs(x)=0 then ant q has not traversed vertex ‘x’ .
If Vs(x)=1 then ant q has already traversed vertex ‘x’.
g) Probability set: Probabilistic Value inspired by the
Ant behavior is the basis for selecting the path. The heuristic information ηxy (q),
feasibility of the path Fxy (q), and pheromone trace value τxy(q) of path for
ant q are used for calculating the probabilistic value of the path. The Probabilistic value of the path is associated with the two parameters α and β. Where α means pheromone value and β means heuristic value of the paths.
h) Cyclomatic Complexity (CC) : It
indicates different
possible scenarios in Activity Graph. i) Weight: Weight is used to calculate the
strength of
each path so that total number of paths can be prioritized.
Algorithm 2: For Ant ‘q’
Step1: Initialize all the parameters
1.1 Initialize Pheromone level (τ): The
pheromone level is initialized as (τ=1) for every edge in Activity Graph.
1.2 Initialize Heuristic Value (η): The heuristic value is initialized as (η=2) for every edge in Activity Graph.
1.3 Initialize Probability (P): The Probability is initialized as (P=0).
1.4 Initialize visited status (Vs): The visiting status is initialized as (Vs=0) that means Ant has not visited any state yet.
5292 for the solution which an Ant has on the basis of prior experience for that particular route. This parameter is associated with the heuristic value.
1.6 Initialize Sum: Sum represents the
Cyclomatic Complexity, which calculates the different possible scenarios in Activity Graph.
Initialize key: the value of the key is initialized as the end_node, this variable stores the value of the last node.
Step 2: Run the Algorithm 2.1 While (sum>0)
2.1.1 Initialize: x= start, weight=0, visit=0. The variable Weight is used for calculating the strength of the path, Later on the variable Strength is used for prioritizing the paths. Next variable Visit is used to discard the redundant paths.
2.1.2 Update the Visited status: If Ant has traversed any node ‘x’ then the value of the visited status of that vertex ‘x’ is updated. If the visited status for the any vertex ‘x’ is (Vs[x]=0) then it will be updated to (Vs[x]=1), also the value of variable ‘visit’ is updated to Visit=Visit+1. 2.1.3 Evaluate Feasible track set: Thefeasible path F(q) for the current vertex ‘x’ is determined, This part also evaluates the available possible routes from the current vertex ‘x’ to all the adjacent verticesusing Activity Graph. If no feasible path exists then go to step 3.
2.1.4 Observe the path: The probability of each node is calculated in the feasibility set F(q) to observe the path. Now the probability for each non-zero element belongs to feasible set F(q) is calculated, with the help of following formula.
(τxy)α * (ηxy)-β
P xy =
z
Ʃ1 ((τxz) α * (ηxz)-β )
where every z belongs to feasible set F(q). 2.1.5 Traverse to next vertex: for visiting the next vertex use the following rules:-
R1: Choose the path(xy) having maximum probability (Pxy).
R2: If Probability of two or more paths are
equal e.g., for paths xy and xz , (Pxy
= Pxz) then rule 2.1is being followed. R2.1: In case of self transition choose thatpath;
otherwise below:
R2.2 : Each feasible set node is compared with
theend node, if (feasible set node = = end_node) then chooseend_node as the next node otherwise follow rule below:
R2.3 : Select that node with visiting status,Vs=0
that means a node which has not been visited yet. Choose the nodes randomly in case two or more states are having same visited status i.e. Vs[y]=Vs[z] . 2.1.6 Update pheromone value:
Pheromone value is updated for the path (x->y) through the following rule:
(τxy) = (τxy)α + (ηxy)-β
2.1.7 Update Heuristic value:
Heuristic information for an ant is being kept up to date by the formula:
ηxy = 2* (ηxy)
2.1.8 Evaluate strength: This factor contains the values related with each path and it is calculated as:-.
weight = weight + τxy
strength [sum]=weight. start = next_vertex.
2.1.9 If (start != end_node) then go to step 2.1.3
else
if (visit = = 0) then reject the path it is superfluous path otherwise add new path. Sum=Sum-1(decrement sum by one each time).
3. END //end of Algorithm
Here Sum is being represented as Cyclomatic complexity of a method, and the value sum =0 means that all the decision nodes being traversed. In two cases algorithm can be stopped, first unavailability of feasible path for the Ant and the second when at least once, all feasible paths has been traversed.
6.2 Illustration of the proposed Algorithm (Using Ant Colony Algorithm):-
All generated paths should be tested with suitable input values so that the software defects can be removed at early phases of testing. After gathering all the information in the Activity Graph, Ant colony Algorithm is applied to generate and optimize the test cases.
The possible scenarios (paths) generated from the graph in Fig 2 are already shown in part 6(ii).
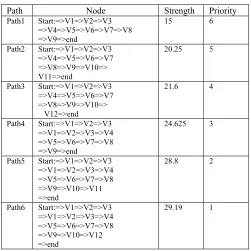
5293 to each path. Priority of the path is calculated using the parameter ‘strength’ of the path. Priority of the path is directly proportional to the strength. With increase in the value of strength, priority of the path
[image:9.612.181.432.180.431.2]will also be increased and also probability to get the desired result will also remain high for that path.
Table 10:- Path Strength Value for first Ant
Path Node Strength Priority
Path1 Start:=>V1=>V2=>V3 =>V4=>V5=>V6=>V7=>V8 =>V9=>end
15 6
Path2 Start:=>V1=>V2=>V3 =>V4=>V5=>V6=>V7 =>V8=>V9=>V10=> V11=>end
20.25 5
Path3 Start:=>V1=>V2=>V3 =>V4=>V5=>V6=>V7 =>V8=>V9=>V10=> V12=>end
21.6 4
Path4 Start:=>V1=>V2=>V3 =>V1=>V2=>V3=>V4 =>V5=>V6=>V7=>V8 =>V9=>end
24.625 3
Path5 Start:=>V1=>V2=>V3 =>V1=>V2=>V3=>V4 =>V5=>V6=>V7=>V8 =>V9=>V10=>V11 =>end
28.8 2
Path6 Start:=>V1=>V2=>V3 =>V1=>V2=>V3=>V4 =>V5=>V6=>V7=>V8 =>V9=>V10=>V12 =>end
29.19 1
For path1 Ant ‘q’ is being kept at start node by the tester and it keeps on moving and updating the values. After node 9 it go for the end node. For path 3, Ant ‘q’ is being kept at node start, generate the possible set for start node F(start) = moving on to node ‘9’, during the movement towards end node it updates the parameters. Next it will choose vertex V10 again it is a decision node, ant can go for V11or V12 both are having equal probability and same visited status P(p10-11) = P(p10-12 ). These two are the path1 and path2. In both the cases, ant will choose V9, V10 and then end node. For path 4, Again Ant is being kept at the source node and then move to the next node 1and then node 2 as a decision node is available at node 3,
Ant has two paths F[3]={1,4} either back to node1 or to node 4 and both are having equal probability P(p3-1)=P(p3-4). Ant while moving update all the values as per the Algorithm. At vertex 9 there are two ways F[9] = {10,end} to go. Both paths having equal probability and same visited status P (p9-10) = P (p9-end). From V9,
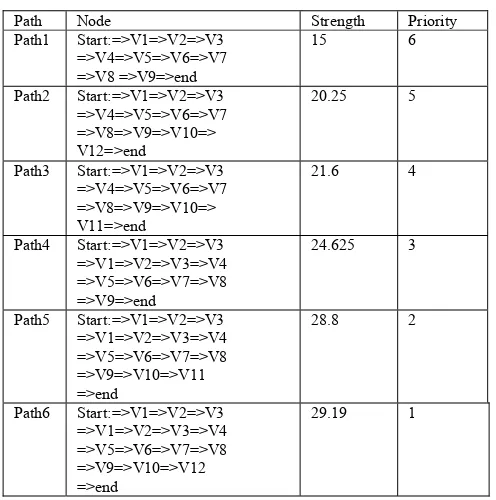
5294
Table 11:- Path Strength Value for second Ant
Path Node Strength Priority
Path1 Start:=>V1=>V2=>V3 =>V4=>V5=>V6=>V7 =>V8 =>V9=>end
15 6
Path2 Start:=>V1=>V2=>V3 =>V4=>V5=>V6=>V7 =>V8=>V9=>V10=> V12=>end
20.25 5
Path3 Start:=>V1=>V2=>V3 =>V4=>V5=>V6=>V7 =>V8=>V9=>V10=> V11=>end
21.6 4
Path4 Start:=>V1=>V2=>V3 =>V1=>V2=>V3=>V4 =>V5=>V6=>V7=>V8 =>V9=>end
24.625 3
Path5 Start:=>V1=>V2=>V3 =>V1=>V2=>V3=>V4 =>V5=>V6=>V7=>V8 =>V9=>V10=>V11 =>end
28.8 2
Path6 Start:=>V1=>V2=>V3 =>V1=>V2=>V3=>V4 =>V5=>V6=>V7=>V8 =>V9=>V10=>V12 =>end
29.19 1
The proposed approach calculates the strength and then priority of that path. Strength is calculated according to the ant colony algorithm. Strength not only depends on the updated pheromone value, it also depends on the updated heuristic value.
The proposed algorithm is good 1) at removing redundant paths 2) it prioritizes the paths 3) covers full path 4) capable of finding errors at earlier stage of testing.
7. CONCLUSION AND FUTURE WORK
This paper presents Generation and Prioritization of test cases using two different algorithms Genetic Algorithm and Ant Colony Optimization. Both these algorithm are evolutionary search based algorithms. Both the algorithms are applied on the same example. The performance of both the algorithms has been studied and the results showed that Genetic Algorithm captures more number of iterations as compared to Ant colony optimization. Ant Colony Optimization gives fast results in lesser time as Compared to Genetic Algorithm. Also in G.A there is a need to select Fitness function, Best value for Chromosome population, probability for Crossover and Mutation operators. In ACO the pheromone value and heuristic value need to be updated but still ACO takes less number of iterations as
compared to G.A. In all cases Ant Colony Optimization is better as compared to Genetic Algorithm in reference to number of occurrences and execution speed. Two Algorithms can be combined to get best results and performance in Future. The limitation of this work is that Comparison between evolutionary algorithms depends on the problem. It will vary from one problem to another. Probably one evolutionary algorithm gives good results for one problem and not for another one.
REFERENCES
[1] D. Kundu , M. Sharma , D. Samanta ,R. Mall “System testing for object-oriented systems with test case prioritization”, Journal of Software Testing, Verification and Reliability, Willey online Library,2009,volume 19, pp. 297-333.
[2] A. Aditya, P. Mathur , Foundation of software testing, First Edition, Pearson Education, 2007.
[3] S. Biswas , M.S. Kaiser and S.A Mamun, “Applying Ant Colony Optimization in software Testing to Generate Prioritized Optimal Path and Test Data” Bangladesh 2015
5295 [5] M. Khandai, A.A. Acharya, D.P. Mohapatra
“A Survey on Test Case Generation from UML Model” International Journal of Computer Science and Informational Technologies,2011, 2(3), pp. 1-8.
[6] P.R. Srivastava, K.M Baby, G. Raghurama “An approach of Optimal Path Generation using Ant Colony Optimization” IEEE INDIA 2009
[7] M. Sharma, D. Kundu, R. Mall, “Automatic Test Case Generation from UML Sequence Diagrams” the proceeding of IEEE conference on software maintenance @2007.
[8] S. Singh, Y. Yogesh, A. Kaur , B. Suri “Test case prioritization using Ant colony Optimization” , ACM SIGSOFT Software Engineering Notes, 2010, 35(4) pp. 1-7. [9] Ajay K. Jena, Santosh K. Swain, Durga K.
Mohapatra, “Test case generation and prioritization based on UML Behavioral Models”, Journal of Theoretical and applied Information Technology, Vol 78, No. 3,pp. 336-352.@2015
[10] D. Kundu and D. Samant. “A Novel Approach to Generate Test Cases from UML Activity Diagrams” Journal of Object Technology, 2009, 8(3), pp. 65-83.
[11] Phill Mcminn, “Search based software test data generation: A Survey” Journal of Software Testing, Verification and Reliability, Willey online Library, Volume 14, issue 2, June 2004,pp. 105-156.
[12] N. Khurana, R.S Chhillar “Test case generation and Optimization using UML models and Genetic Algorithm” Procedia Computer Science, Elsevier Volume - 57, pp, pages 996-1004. (ICRTC 2015)