IJPSR (2017), Volume 8, Issue 8 (Research Article)
Received on 23 January, 2017; received in revised form, 18 March, 2017; accepted, 22 March, 2017; published 01 August, 2017
CHARACTERIZATION AND VALIDATION OF IMPURITIES RELATED TO
PHARMACEUTICAL BULK DRUG (API) BY USING SOME ANALYTICAL TECHNIQUES
Champa P. Maurya 1 and Manohar V. Lokhande *2
Department of Chemistry 1, Jagdish Prasad Jhabarmal Tibrewala University, Jhunjhunu - 333001, Rajasthan, India.
Department of Chemistry 2, Sathaye College, Vile Parle (E), Mumbai - 400057, Maharashtra, India.
ABSTRACT: Active Pharmaceutical Ingredient (API) of pharmaceutical bulk drug, four impurities were identified and were detected by a newly developed Reverse phase high performance liquid chromatographic (HPLC) method. The R.S.D.’s for SM-I, SM-II, SM- III and SM were found to be 1.48%, 1.71%, 1.67%, 6.37% respectively. These values are within the acceptance criteria of 10%.The limit of quantification values for SM-I, SM-II and SM-III were found to be 0.006 %, 0.006 %, and 0.006 % w.r.t. analyte concentration (500 μg /cm3
), respectively. For determining method accuracy, known as unclean LOQ, the specified limit of 80%, 100% and 120% of the SM bulk sample (test preparation) was pointed. For confirming method precision six different test preparations of samples of SM were analyzed. Identified impurities were characterized by LC/MS/MS method. Identified impurities were unknown. Structural determination of such impurities was carried out by LC/MS/MS using electro spray ionization source and an ion trap mass analyzer. Structural identification by using nuclear magnetic resonance (NMR) and infrared (IR) spectroscopy. The method was validated according to ICH guidelines with respect to Specificity, Precision, Accuracy, Linearity and Robustness.
INTRODUCTION: Sulfa methoxypyrazine (SM) such as N1 - (3-Methoxypyrazin – 2 - yl) Sulphanilamide is a long-acting sulfonamide which has been used orally for the treatment of respiratory and urinary tract infections 1. It gives the combination with pyrimethamine 2, 3 in the treatment of malaria. It has also been given in the ratio 4 parts of Sulfa methoxypyrazine to 5 parts of trimethoprim as a combination with uses similar to those of co-trimoxazole 4.
QUICK RESPONSE CODE
DOI:
10.13040/IJPSR.0975-8232.8(8).3325-40
Article can be accessed online on: www.ijpsr.com
DOI link: http://dx.doi.org/10.13040/IJPSR.0975-8232.8 (8).3325-40
A few bio-analytical techniques were reported in the literature for the quantitative determination of Sulfa methoxypyrazine (SM) concentration in biological fluids using liquid chromatography and mass spectroscopic method 5, 6, 7. However, so far there is no published report, describing the complete characterization of related impurities in Sulfa methoxypyrazine as active pharmaceutical ingredient (API). Some part of the paper is reported by using LC/MS/MS and isolation/synthesis of related substances in Sulfa methoxypyrazine Active Pharmaceutical Ingredient 8.
Impurity profile of a drug substance is critical for its security valuation and manufacturing process. It is required to identify and characterize the impurities in the pharmaceutical bulk drugs, if
Keywords:
Impurities, HPLC,
LCMS/MS/MS, NMR and Validation
Correspondence to Author: Dr. Manohar V. Lokhande
Associate Professor, Department of Chemistry, Sathaye College, Vile Parle East, Mumbai - 400057, Maharashtra
State, India.
impurities are present above then the acceptable limits of 0.1 % 9. The present study deals with the identification and structural explanation of the process related impurities, which were found in the pharmaceutical bulk drugs Sulfa methoxypyrazine. Though, different methods of synthesis of Sulfa methoxypyrazine are reported, the selected route was safe, feasible & economical 10. However, the literature survey does not give any details regarding these impurities. Impurity profiling of drugs is the most important issue in the modern pharmaceutical analysis 11, 12 for developing process technology to manufacture high purity drug substance. During process development studies, four impurities were detected in both crude and pure samples of SM using a newly developed gradient reversed phase HPLC method. This paper also deals with the analytical method validation of a new HPLC method for quantitative determination of these impurities.
MATERIALS AND METHODS:
Materials: Samples of API were obtained from pharmaceutical laboratories, Chemical Research Division, Mumbai, India. HPLC grade CH3CN and
perchloric acid (70%) were purchased from Merck India Limited. Chloroform(d) and DMS (d) (for NMR) were purchased from Aldrich Company.
Methods: High Performance Liquid
Chromatography: The Samples were analyzed on Alliance 2690 HPLC (Waters, Milford, MA, USA) system equipped with 2487 UV\detector. A Unisphere C18 column (150 mm x 4.6 mm i.d. 5 μm) was used for chromatographic separation. The mobile phase consisting of A: 1 cm3 perchloric acid (70%) in 1000 cm3 of water and B: acetonitrile, with timed gradient programmer Tmin /A: B:
T0/85:15; T10/85:15; T30/50:50; T40/85:15;
T45/85:15 with flow rate of 0.8 ml per minute were used. The column oven temperature was maintained at 30 °C. The injection volume was 20μL and the detector wavelength was fixed at 270 nm.
Liquid Chromatography-Tandem Mass
Spectrometry (LC/MS/MS):The MS and MS/MS studies were performed on LCQ Advantage (Thermo Electron, San Jose, CA) ion trap mass spectrometer. The source voltage was maintained at 3.0 kV and capillary temperature at 250 °C.
Nitrogen was used as both sheath and auxiliary gas. The mass to charge ratio was scanned across the various range. MS/MS studies were carried out by keeping normalized collision energy at 25-30% and an isolation width of 6 amu. The HPLC consisted of an Agilent-1100 series quaternary gradient pump with a degasser, an auto sampler and column oven. A C18 column (ProntoSIL Kromabond column 150 mm x 4.6 mm i.d. 5 μm) was used for separation. The mobile phase consisting of A: 1 cm3 Trifluoracetic acid in 1000 cm3 water and B: acetonitrile, with timed gradient programme
Tmin/A: B: T0/85:15; T10/85:15; T30/50:50;
T40/85:15; T45/85:15 with flow rate of 0.8 ml per minute were used.
NMR Spectroscopy: 1H and 13C NMR spectra of the synthesized/isolated impurities were recorded on Bruker 400MHz instrument. The 1H and 13C chemical shift values were reported on the δ scale (ppm) relative to CDCl3 (7.26 ppm).
Preparative Liquid Chromatography: Impurities were isolated from the bulk sample using Waters Auto purification system consisting of 2525 binary gradient pump, a 2487UV detector and 2767 sample manager (Waters, Milford MA, USA). A Peerless Basic C18 column (150mm×21.2mm i.d., particle size 5μm) was used for the separation. The mobile phase was consisted of a mixture of water and acetonitrile in the ratio of 85:15 and was pumped at flow rate 25 cm3 /min. The detection was monitored at 270 nm.
Preparation of Solutions for Validation of HPLC Method: The test preparation solution of 500 μg/cm3
of SP bulk drug sample were prepared by using the diluents (mixture of 0.1% perchloric acid (75%) in water and acetonitrile, ratio is 85:15. A stock solution of mixture of impurities were prepared by dissolving 0.5mg/cm3 each of SM-I, SM-II, SM-III and SM. From this stock solution, a standard solution containing 0.5μg/cm3 each of SM-I, SM-II, SM-III and SM were prepared. This standard solution was also used for checking system suitability parameters.
RESULTS AND DISCUSSIONS:
0.54 and 1.34 with respect to principle peak. The target impurities under study are marked as Sulphanilamide used as a starting material, SM-I, SM-II, and SM-III, respectively. The typical chromatogram of crude SM sample highlighting the retention time of impurities.
Identification of Impurities by LC/MS/MS: The previous work of characterization is ideological to produce the mass data for the parent drug molecule so that, it may be easily compared and achieve, the process related impurities may be formed during the synthetic reaction. The spectra of SM exhibits a protonated molecular ion peak [M+H]+ 281 (Fig. 1) (molecular mass of SM is 280) in electro spray ionization in positive mode, the most plausible position of protonation was at NH2 and NH. The
MS/MS spectrum taken for the protonated SM molecule showed prominent peak at 156 (Fig. 2) which is due to NH-SO2 bond giving rise to
C6H6NO2S+ probable fragmentation are shown in
[image:3.612.313.567.108.234.2](Fig. 3).
FIG. 1: PLAUSIBLE SCHEME FOR FRAGMENTATIONS OF SM
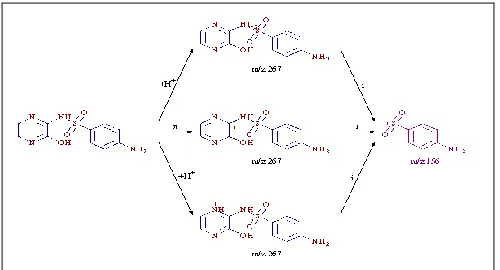
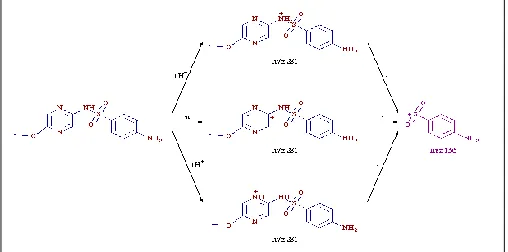
SM-I showed a protonated molecular ion peak [M+H]+ 267 having molecular mass of 266, which under goes fragmentation to form C6H6NO2S+ for
156 by loss of C4H5N3O ion.
FIG. 2: PLAUSIBLE SCHEME FOR FRAGMENTATIONS OF SM-I
SM-II similarly showed [M+H]+ of 251 for molecular mass of 250 and a loss of C4H5N3•+
[image:3.612.49.299.364.493.2]giving daughter ion of mass 156.
FIG. 3: PLAUSIBLE SCHEME FOR FRAGMENTATIONS OF SM-II
SM-III, which is an isomer, showed similar fragmentation that of SM. From all the mass fragmentation as discussed above, showed similar daughter ions of 156 for C6H6NO2S+ which
revealed that these impurities are structurally similar.
SM-I: showed a protonated molecular ion peak [M+H]+ 267 having molecular mass of 266, which under goes fragmentation to form C6H6NO2S+ for
156 by loss of C4H5N3O ion.
SM-II: similarly showed [M+H]+ of 251 for molecular mass of 250 and a loss of C4H5N3 •+
giving daughter ion of mass 156.
SM-III: which is an isomer, showed similar fragmentation that of SM (Fig. 4). Since all the mass fragmentation as discussed above, showed similar daughter ions of 156 for C6H6NO2S+
indicated that such impurities are structurally similar. SM-III and SM were having same molecular mass and may be Regio isomer of each other; later it was fixed to confirm the structure by NMR. Hence NMR of all the impurities and the product was carried out for comparison and further confirmation of structure.
[image:3.612.49.299.591.726.2]FIG. 4: PLAUSIBLE SCHEME FOR FRAGMENTATIONS OF SM-III
Analytical Method Validation by HPLC: The validation study allowed the assessment of the process for its appropriateness for routine analysis. The new advanced system for SM and its related impurities was validated according to ICH guidelines 9. The validation study was accepted for the analysis of SM-I, SM-II and SM-III. The system appropriateness parameters obtained for related substance process are given (Fig. 5). Forced degradation studies were also performed (Acid, Base) for SM bulk drug sample to demonstrate the stability indicating power of the newly developed HPLC method.
S
M
P
-I
3
.4
8
1
S
M
P
-I
I
7
.5
3
6
S
M
P
1
3
.7
8
9
S
M
P
-I
II
-
1
8
.0
1
0
AU
-0.005 0.000 0.005 0.010 0.015 0.020 0.025 0.030 0.035 0.040 0.045 0.050 0.055 0.060
Minutes
0.00 2.00 4.00 6.00 8.00 10.00 12.00 14.00 16.00 18.00 20.00 22.00 24.00 26.00 28.00 30.00 32.00 34.00 36.00 38.00 40.00 42.00 44.00
FIG. 5: CHROMATOGRAM OF SYSTEM SUITABILITY SOLUTION
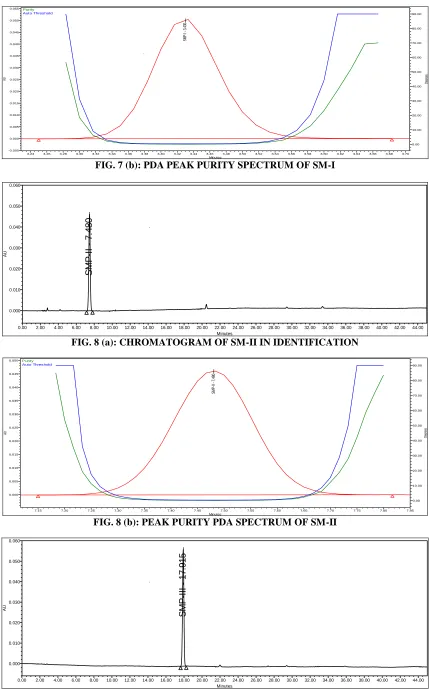
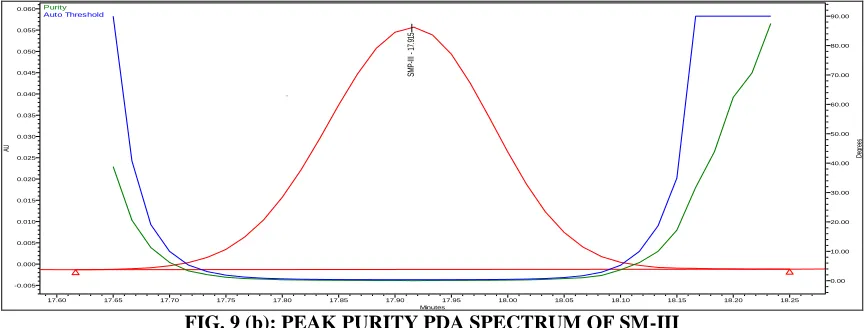
[image:4.612.48.302.56.182.2]Specificity: Specificity is the capacity of analytical process to found the amount of analyte response in the existence of its potential impurities and degradants. To specificity the HPLC technique for the determination of injecting individual impurity samples, wherein no interference was observed for any other components. The chromatograms were checked for the presence of any extra peak. Peak purity of these samples under stressed conditions was verified using a PDA detector. The purity of the principle and other chromatographic peaks was found to be acceptable. This study confirmed the stability indicating power of the HPLC method.
FIG. 6: A TYPICAL CHROMATOGRAM OF SM SAMPLE
S
M
P
I
3
.4
3
0
AU
0.000 0.010 0.020 0.030 0.040 0.050 0.060
Minutes
[image:4.612.92.525.404.739.2]SM
PI
3
.4
30
Purity Auto Threshold
AU
D
eg
re
es
-0.005 0.000 0.005 0.010 0.015 0.020 0.025 0.030 0.035 0.040 0.045 0.050 0.055
0.00 10.00 20.00 30.00 40.00 50.00 60.00 70.00 80.00 90.00
Minutes
3.24 3.26 3.28 3.30 3.32 3.34 3.36 3.38 3.40 3.42 3.44 3.46 3.48 3.50 3.52 3.54 3.56 3.58 3.60 3.62 3.64 3.66 3.68 3.70
FIG. 7 (b): PDA PEAK PURITY SPECTRUM OF SM-I
S
M
P
-II
- 7
.4
8
0
AU
0.000 0.010 0.020 0.030 0.040 0.050 0.060
Minutes
0.00 2.00 4.00 6.00 8.00 10.00 12.00 14.00 16.00 18.00 20.00 22.00 24.00 26.00 28.00 30.00 32.00 34.00 36.00 38.00 40.00 42.00 44.00 FIG. 8 (a): CHROMATOGRAM OF SM-II IN IDENTIFICATION
S
M
P
-II
-
7.
48
0
Purity Auto Threshold
AU
D
eg
re
es
0.000 0.005 0.010 0.015 0.020 0.025 0.030 0.035 0.040 0.045 0.050
0.00 10.00 20.00 30.00 40.00 50.00 60.00 70.00 80.00 90.00
Minutes
7.15 7.20 7.25 7.30 7.35 7.40 7.45 7.50 7.55 7.60 7.65 7.70 7.75 7.80 7.85
FIG. 8 (b): PEAK PURITY PDA SPECTRUM OF SM-II
S
M
P
-III
1
7
.9
1
5
AU
0.000 0.010 0.020 0.030 0.040 0.050 0.060
Minutes
[image:5.612.91.520.48.738.2]SM
P-III
-
17
.9
15
Purity Auto Threshold
AU
D
eg
re
es
-0.005 0.000 0.005 0.010 0.015 0.020 0.025 0.030 0.035 0.040 0.045 0.050 0.055 0.060
0.00 10.00 20.00 30.00 40.00 50.00 60.00 70.00 80.00 90.00
Minutes
17.60 17.65 17.70 17.75 17.80 17.85 17.90 17.95 18.00 18.05 18.10 18.15 18.20 18.25
FIG. 9 (b): PEAK PURITY PDA SPECTRUM OF SM-III
Precision: The ability of the method to precisely quantify impurities was determined by calculating the relative standard deviation (RSD) for response (peak area) of each impurity in the standard solution (a mixture of impurities) a copy of the injections. The R.S.D.’s for SM-I, SM-II, SM and SM-III were found to be 1.48%, 1.71%, 6.37% and
1.67%, respectively. These values are within the acceptance criteria of 10%. For confirming method precision six different test preparations of samples of SM were analyzed. The determined R.S.D. of these results was found to be under acceptable limit.
S
M
P
-I
3
.5
02
S
M
P
-I
I
-
7.
60
3
S
M
P
1
3.
93
9
S
M
P
-I
II
1
8.
11
1
AU
0.000 0.010 0.020 0.030 0.040 0.050
Minutes
0.00 2.00 4.00 6.00 8.00 10.00 12.00 14.00 16.00 18.00 20.00 22.00 24.00 26.00 28.00 30.00 32.00 34.00 36.00 38.00 40.00 42.00 44.00
Name Retention Time Area % Area Height
SM-I 3.502 15391 15.99 2474
SM-II 7.603 26782 27.82 2414
SM 13.939 22083 22.94 1256
SM-III 18.111 32027 33.26 3043
FIG. 10(a): CHROMATOGRAM OF MIX STANDARD SOLUTION (INJECTION-01) IN PRECISION
S
M
P
-I
3
.5
0
5
S
M
P
-I
I
-
7
.6
0
5
S
M
P
1
3
.9
3
8
S
M
P
-I
II
1
8
.1
0
4
AU
0.000 0.010 0.020 0.030 0.040 0.050
Minutes
0.00 2.00 4.00 6.00 8.00 10.00 12.00 14.00 16.00 18.00 20.00 22.00 24.00 26.00 28.00 30.00 32.00 34.00 36.00 38.00 40.00 42.00 44.00
Name Retention Time Area % Area Height
SM-I 3.505 15340 15.89 2496
SM-II 7.605 26965 27.93 2434
SM 13.938 22220 23.02 1265
SM-III 18.104 32019 33.17 3066
[image:6.612.90.524.54.218.2]S
M
P
-I
3
.5
0
2
S
M
P
-I
I
-
7
.5
9
7
S
M
P
1
3
.9
2
1
S
M
P
-I
II
1
8
.0
8
1
AU
0.000 0.010 0.020 0.030 0.040 0.050
Minutes
0.00 2.00 4.00 6.00 8.00 10.00 12.00 14.00 16.00 18.00 20.00 22.00 24.00 26.00 28.00 30.00 32.00 34.00 36.00 38.00 40.00 42.00 44.00
Name Retention Time Area % Area Height
SM-I 3.502 15422 15.99 2494
SM-II 7.597 26795 27.78 2423
SM 13.921 22164 22.98 1260
SM-III 18.081 32056 33.24 3057
[image:7.612.66.529.57.384.2]FIG. 10 (C): CHROMATOGRAM OF MIX STANDARD SOLUTION (INJECTION-03) IN PRECISION
TABLE 1: EVALUATION DATA OF PRECISION STUDY
No. of injection SM-I SM-II SM SM-III
1 15391 26782 22083 32027
2 15340 26965 22220 32019
3 15422 26795 22164 32056
4 15371 26767 22466 32124
5 15477 26920 22080 32148
6 15351 26613 22066 32095
Mean 15392 26807 22179.83 32078.17
SD 50.8960 124.6900 152.3528 52.6704
%RSD 0.33% 0.47% 0.69% 0.16%
TABLE 2: SYSTEM SUITABILITY REPORT IN PRECISION
Component Tailing factor Theoretical plates % RSD
SM-I 1.10 8547 1.48
SM-II 1.02 13763 1.71
SM 0.98 17644 1.67
SM-III 1.06 86953 6.37
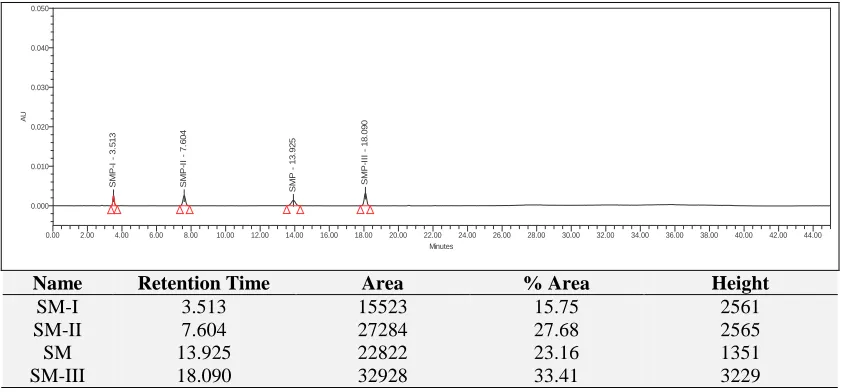
Accuracy: For determining method accuracy, known as unclean LOQ, the specified limit of 80%, 100% and 120% of the SM bulk sample (test
preparation) was spiked into. The unclean recovery was calculated individually.
S
M
P
-I
3
.5
1
3
S
M
P
-I
I
-
7
.6
0
4
S
M
P
1
3
.9
2
5
S
M
P
-I
II
1
8
.0
9
0
AU
0.000 0.010 0.020 0.030 0.040 0.050
Minutes
0.00 2.00 4.00 6.00 8.00 10.00 12.00 14.00 16.00 18.00 20.00 22.00 24.00 26.00 28.00 30.00 32.00 34.00 36.00 38.00 40.00 42.00 44.00
Name Retention Time Area % Area Height
SM-I 3.513 15523 15.75 2561
SM-II 7.604 27284 27.68 2565
SM 13.925 22822 23.16 1351
[image:7.612.96.517.529.725.2]SM-III 18.090 32928 33.41 3229
S
M
P
-I
3
.4
8
9
S
M
P
1
3
.9
0
6
2
5
.9
9
5
2
6
.4
7
9
2
8
.1
1
7
3
0
.0
2
9
AU
0.000 0.010 0.020 0.030 0.040 0.050
Minutes
0.00 2.00 4.00 6.00 8.00 10.00 12.00 14.00 16.00 18.00 20.00 22.00 24.00 26.00 28.00 30.00 32.00 34.00 36.00 38.00 40.00 42.00 44.00
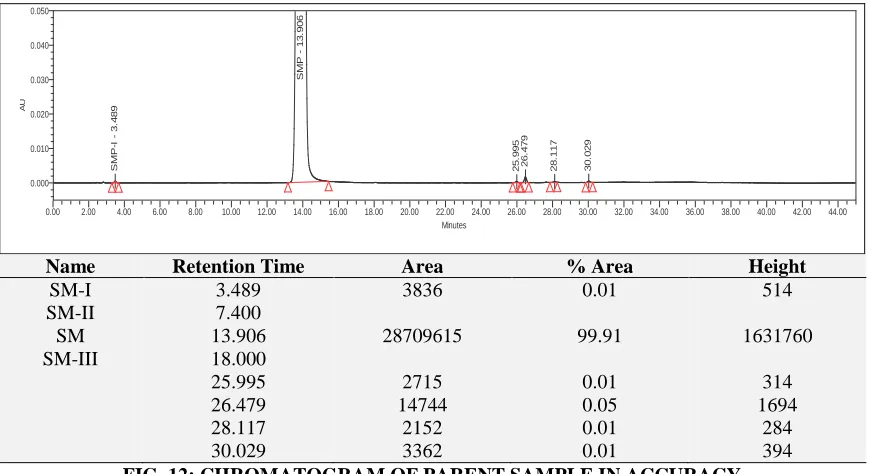
Name Retention Time Area % Area Height
SM-I 3.489 3836 0.01 514
SM-II 7.400
SM 13.906 28709615 99.91 1631760
SM-III 18.000
25.995 2715 0.01 314
26.479 14744 0.05 1694
28.117 2152 0.01 284
30.029 3362 0.01 394
[image:8.612.90.525.53.290.2]FIG. 12: CHROMATOGRAM OF PARENT SAMPLE IN ACCURACY
TABLE 3: ACCURACY OF IMPURITIES
Amount added (μg/cm3
) Amount recovered (μg/ cm3) Recovery (%) Mean
At LOQ level
SM-I 0.0315 0.0279 88.67 104.22
0.0315 0.0339 107.67
0.0315 0.0366 116.33
SM-II 0.0309 0.0342 113.67 112.45
0.0309 0.0337 109.00
0.0309 0.0354 114.67
SM-III 0.0303 0.0333 110.00 107.78
0.0303 0.0316 104.33
0.0303 0.0330 109.00
At 80% level
SM-I 0.4200 0.4012 95.53 98.48
0.4200 0.4158 99.00
0.4200 0.4238 100.90
SM-II 0.4120 0.4098 99.48 99.38
0.4120 0.4051 98.33
0.4120 0.4133 100.33
SM-III 0.4040 0.4073 100.83 100.86
0.4040 0.4080 100.98
0.4040 0.4071 100.78
At 100% level
SM-I 0.5250 0.5144 97.98 101.17
0.5250 0.5396 102.78
0.5250 0.5394 102.74
SM-II 0.5150 0.5081 98.66 98.28
0.5150 0.5061 98.26
0.5150 0.5043 97.92
SM-III 0.5050 0.5075 100.48 99.87
0.5050 0.5019 99.40
0.5050 0.5036 99.72
At 120% level
SM-I 0.6300 0.5844 92.76 96.78
0.6300 0.6191 98.27
0.6300 0.6256 99.30
SM-II 0.6180 0.6018 97.38 97.56
0.6180 0.6060 98.05
SM-III 0.6060 0.5996 98.95 98.61
0.6060 0.5961 98.37
0.6060 0.5969 98.50
Limit of Detection (DL) and Limit of Quantification (QL): Detection limit and quantitation limit for all impurities was estimated by signal to noise (S/N) method. The limit of detection values for SM-I, SM -II and SM -III were 0.002 %, 0.002 % and 0.002 % w.r.t. analyte
concentration (500 μg /cm3
) respectively. The limit of quantification values for I, II and SM-III were found to be 0.006 %, 0.006 %, and 0.006 % w.r.t. analyte concentration (500 μg /cm3
), respectively.
S
M
P
-I
3
.4
9
5
S
M
P
-I
I
-
7
.5
6
0
S
M
P
1
3
.9
2
3
S
M
P
-I
II
1
8
.0
6
7
AU
0.000 0.010 0.020 0.030 0.040 0.050
Minutes
0.00 2.00 4.00 6.00 8.00 10.00 12.00 14.00 16.00 18.00 20.00 22.00 24.00 26.00 28.00 30.00 32.00 34.00 36.00 38.00 40.00 42.00 44.00
Name Retention Time Area % Area Height
SM-I 3.495 277 15.22 49
SM-II 7.560 460 25.22 42
SM 13.923 523 28.69 41
SM-III 18.067 563 30.87 46
FIG. 13: CHROMATOGRAM OF LOQ STANDARD SOLUTION
S
M
P
-I
3
.4
9
2
S
M
P
-I
I
-
7
.5
6
0
S
M
P
1
3
.9
0
4
S
M
P
-I
II
1
8
.0
6
4
AU
0.000 0.010 0.020 0.030 0.040 0.050
Minutes
0.00 2.00 4.00 6.00 8.00 10.00 12.00 14.00 16.00 18.00 20.00 22.00 24.00 26.00 28.00 30.00 32.00 34.00 36.00 38.00 40.00 42.00 44.00
Name Retention Time Area % Area Height
SM-I 3.492 317 21.74 54
SM-II 7.560 363 24.87 34
SM 13.904 199 13.60 22
SM-III 18.064 581 39.79 52
FIG. 14: CHROMATOGRAM OF LOD STANDARD SOLUTION
Linearity: On drawing a plot at six concentration levels in triplicate, covering a range of LOQ to 150%, linear calibration plots were achieved. For SM-I, the corresponding regression equation was y
= 28876x+348.97, with correlation coefficient (r) is 0.9996. For SM-II, corresponding regression
equation was y = 52747x−0.2397, with correlation
TABLE 4: LINEARITY TABLE FOR SM-I IMPURITY
Level Conc.(ppm) Mean Area Req area
LOQ% 0.0315 1064.33 1259
50% 0.2500 7716.33 7568
80% 0.4200 12739.00 12477
100% 0.5250 15579.67 15509
120% 0.6300 18237.33 18541
150% 0.7875 23105.33 23089
Correlation coefficient =0.9996 0.9996
Slope =28876.00 28876.00
Intercept =348.97 348.97
Linearity study for SMP-I
y = 28876x + 348.97
0.00 5000.00 10000.00 15000.00 20000.00 25000.00
0.0000 0.2000 0.4000 0.6000 0.8000 1.0000
Concentration
A
re
a
R
e
s
p
o
n
s
e
FIG. 15: LINEARITY CURVE FOR SM-I IMPURITY
TABLE 5: LINEARITY TABLE FOR SM-II IMPURITY
Level Conc.(ppm) Mean Area Regg area
LOQ% 0.0309 1064.33 1630
50% 0.2575 13742.67 13582
80% 0.4120 22331.00 21731
100% 0.5150 27975.67 27164
120% 0.6180 32023.67 32597
150% 0.7725 40313.67 40747
Correlation coefficient =0.9990 0.9990
Slope =52746.63 Intercept =-0.24
Linearity study for SMP-II
y = 52747x - 0.2397
0.00 5000.00 10000.00 15000.00 20000.00 25000.00 30000.00 35000.00 40000.00 45000.00
0.0000 0.2000 0.4000 0.6000 0.8000 1.0000 Concentration
A
re
a
R
e
s
p
o
n
s
e
FIG. 16: LINEARITY CURVE FOR SM-II IMPURITY
TABLE 6: LINEARITY TABLE FOR SM-III
IMPURITY
Level Conc.(ppm) Mean Area Freq area
LOQ% 0.0303 1791.33 2373
50% 0.2525 16582.33 16587
80% 0.4040 26540.33 26279
100% 0.5050 34512.67 32740
120% 0.6060 38447.33 39202
150% 0.7575 48201.00 48893
Correlation coefficient = 0.9983 Slope =63972.03
Intercept =434.54
Linearity study for SMP-III
y = 63972x + 434.54
0.00 10000.00 20000.00 30000.00 40000.00 50000.00 60000.00
0.0000 0.2000 0.4000 0.6000 0.8000 Concentration
A
re
a
R
e
s
p
o
n
s
[image:10.612.37.570.53.472.2]e
FIG. 17: LINEARITY CURVE FOR SM-III IMPURITY
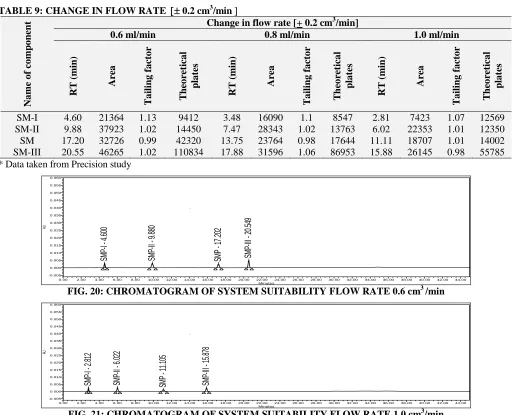
Robustness: In all the deliberately varied chromatographic conditions (column temperature, flow rate and column make), the chromatogram for
[image:10.612.46.565.549.715.2]system suitability solution for related substance showed no significant change in system suitability parameters.
TABLE 8: CHANGE IN COLUMN TEMPERATURE 3 °C
Na
me
o
f
co
mp
o
nent
Change in column temperature [+ 3°C]
27°C 30°C 33°C
RT
(
min
)
Area Tailin
g
fa
ct
o
r
T
heo
re
tica
l pla
tes
RT
(
min
)
Area Tailin
g
fa
ct
o
r
T
heo
re
tica
l pla
tes
RT
(
min
)
Area Tailin
g
fa
ct
o
r
T
heo
re
tica
l pla
tes
SM-I 3.61 15883 1.11 8234 3.48 16090 1.1 8547 3.41 15713 1.11 8721
SM-II 7.98 27718 1.03 13475 7.47 28343 1.02 13763 7.17 27990 1.03 13560
SM 14.42 24269 0.98 22606 13.75 23764 0.98 17644 13.35 23696 0.99 15303
SM-III 18.53 33571 0.99 93277 17.88 31596 1.06 86953 17.46 32934 1.00 73604
SM PI 3 .6 11 SM P-II - 7 .9 82 SM P 1 4.4 23 SM P-III - 1 8.5 29 AU -0.005 0.000 0.005 0.010 0.015 0.020 0.025 0.030 0.035 0.040 0.045 0.050 0.055 0.060 Minutes
0.00 2.00 4.00 6.00 8.00 10.00 12.00 14.00 16.00 18.00 20.00 22.00 24.00 26.00 28.00 30.00 32.00 34.00 36.00 38.00 40.00 42.00 44.00
FIG. 18: CHROMATOGRAM OF SYSTEM SUITABILITY AT COLUMN TEMPERATURE 27 °C
SM PI 3 .4 10 SM P-II - 7 .1 73 SM P 1 3.3 49 SM P-III - 1 7.4 56 AU -0.005 0.000 0.005 0.010 0.015 0.020 0.025 0.030 0.035 0.040 0.045 0.050 0.055 0.060 Minutes
0.00 2.00 4.00 6.00 8.00 10.00 12.00 14.00 16.00 18.00 20.00 22.00 24.00 26.00 28.00 30.00 32.00 34.00 36.00 38.00 40.00 42.00 44.00
[image:11.612.89.523.55.333.2]FIG. 19: CHROMATOGRAM OF SYSTEM SUITABILITY AT COLUMN TEMPERATURE 33 °C
TABLE 9: CHANGE IN FLOW RATE 0.2 cm3/min
Na me o f co mp o nent
Change in flow rate [+ 0.2 cm3/min]
0.6 ml/min 0.8 ml/min 1.0 ml/min
RT ( min ) Area T a ilin g f a ct o r T heo re tica l pla tes RT ( min ) Area T a ilin g f a ct o r T heo re tica l pla tes RT ( min ) Area T a ilin g f a ct o r T heo re tica l pla tes
SM-I 4.60 21364 1.13 9412 3.48 16090 1.1 8547 2.81 7423 1.07 12569
SM-II 9.88 37923 1.02 14450 7.47 28343 1.02 13763 6.02 22353 1.01 12350
SM 17.20 32726 0.99 42320 13.75 23764 0.98 17644 11.11 18707 1.01 14002
SM-III 20.55 46265 1.02 110834 17.88 31596 1.06 86953 15.88 26145 0.98 55785
* Data taken from Precision study
SM PI 4 .6 00 SM P-II - 9 .8 80 SM P 1 7.2 02 SM P-III - 2 0.5 49 AU -0.005 0.000 0.005 0.010 0.015 0.020 0.025 0.030 0.035 0.040 0.045 0.050 0.055 0.060 Minutes
0.00 2.00 4.00 6.00 8.00 10.00 12.00 14.00 16.00 18.00 20.00 22.00 24.00 26.00 28.00 30.00 32.00 34.00 36.00 38.00 40.00 42.00 44.00
FIG. 20: CHROMATOGRAM OF SYSTEM SUITABILITY FLOW RATE 0.6 cm3 /min
SM PI 2 .8 12 SM P-II - 6 .0 22 SM P 1 1.1 05 SM P-III - 1 5.8 78 AU -0.005 0.000 0.005 0.010 0.015 0.020 0.025 0.030 0.035 0.040 0.045 0.050 0.055 0.060 Minutes
[image:11.612.50.563.328.743.2]0.00 2.00 4.00 6.00 8.00 10.00 12.00 14.00 16.00 18.00 20.00 22.00 24.00 26.00 28.00 30.00 32.00 34.00 36.00 38.00 40.00 42.00 44.00
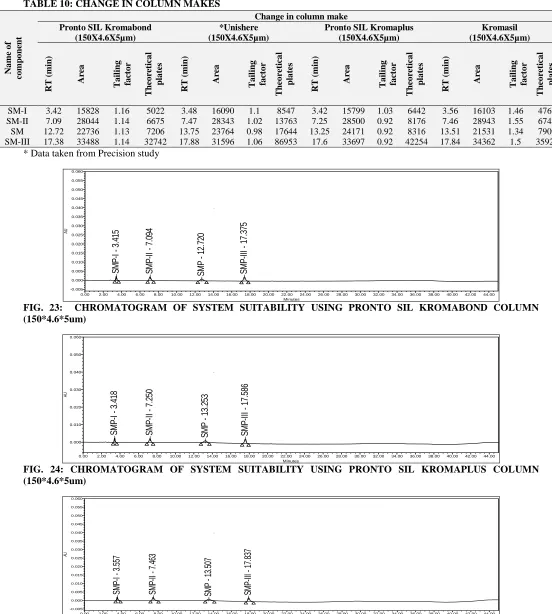
TABLE 10: CHANGE IN COLUMN MAKES
* Data taken from Precision study
S M P I 3 .4 15 S M P -II - 7 .0 94 S M P - 1 2.7 20 S M P -III - 1 7.3 75 AU -0.005 0.000 0.005 0.010 0.015 0.020 0.025 0.030 0.035 0.040 0.045 0.050 0.055 0.060 Minutes
0.00 2.00 4.00 6.00 8.00 10.00 12.00 14.00 16.00 18.00 20.00 22.00 24.00 26.00 28.00 30.00 32.00 34.00 36.00 38.00 40.00 42.00 44.00
FIG. 23: CHROMATOGRAM OF SYSTEM SUITABILITY USING PRONTO SIL KROMABOND COLUMN (150*4.6*5um) S M P I 3 .4 18 S M P -II - 7 .2 50 S M P 1 3.2 53 S M P -III 1 7.5 86 AU 0.000 0.010 0.020 0.030 0.040 0.050 0.060 Minutes
0.00 2.00 4.00 6.00 8.00 10.00 12.00 14.00 16.00 18.00 20.00 22.00 24.00 26.00 28.00 30.00 32.00 34.00 36.00 38.00 40.00 42.00 44.00
FIG. 24: CHROMATOGRAM OF SYSTEM SUITABILITY USING PRONTO SIL KROMAPLUS COLUMN (150*4.6*5um) SM PI 3 .5 57 SM P-II - 7 .4 63 SM P 1 3.5 07 SM P-III - 1 7.8 37 AU -0.005 0.000 0.005 0.010 0.015 0.020 0.025 0.030 0.035 0.040 0.045 0.050 0.055 0.060 Minutes
0.00 2.00 4.00 6.00 8.00 10.00 12.00 14.00 16.00 18.00 20.00 22.00 24.00 26.00 28.00 30.00 32.00 34.00 36.00 38.00 40.00 42.00 44.00
FIG. 25: CHROMATOGRAM OF SYSTEM SUITABILITY USING KROMASIL C18 COLUMN (150*4.6*5um)
Solution Stability: The solution stability of SM sample and its related impurities was carried out by leaving both solutions in tightly capped HPLC vials
at 25 °C for 16 hours in an auto sampler. No significant changes were observed in the area of impurities in standard solution after 16 hours.
Na m e o f co m p o n en t
Change in column make Pronto SIL Kromabond
(150X4.6X5µm)
*Unishere (150X4.6X5µm)
Pronto SIL Kromaplus (150X4.6X5µm) Kromasil (150X4.6X5µm) RT (m in) Ar ea Ta il in g fa cto r Th eo re tica l p la te s RT (m in ) Ar ea Ta il in g fa cto r Th eo re tica l p la te s RT (m in ) Ar ea Ta il in g fa cto r Th eo re tica l p la te s RT (m in ) Ar ea Ta il in g fa cto r Th eo re tica l p la te s
SM-I 3.42 15828 1.16 5022 3.48 16090 1.1 8547 3.42 15799 1.03 6442 3.56 16103 1.46 4768
SM-II 7.09 28044 1.14 6675 7.47 28343 1.02 13763 7.25 28500 0.92 8176 7.46 28943 1.55 6742
SM 12.72 22736 1.13 7206 13.75 23764 0.98 17644 13.25 24171 0.92 8316 13.51 21531 1.34 7909
S
M
P
-I
3
.5
0
2
S
M
P
-I
I
-
7
.6
0
3
S
M
P
1
3
.9
3
9
S
M
P
-I
II
1
8
.1
1
1
AU
0.000 0.010 0.020 0.030 0.040 0.050
Minutes
0.00 2.00 4.00 6.00 8.00 10.00 12.00 14.00 16.00 18.00 20.00 22.00 24.00 26.00 28.00 30.00 32.00 34.00 36.00 38.00 40.00 42.00 44.00
Name Retention Time Area % Area Height
SM-I 3.502 15391 15.99 2474
SM-II 7.603 26782 27.82 2414
SM 13.939 22083 22.94 1256
SM-III 18.111 32027 33.26 3043
FIG. 26: CHROMATOGRAM OF MIX STANDARD FRESHLY PREPARED IN SOLUTION STABILITY [0 HRS]
2
.8
3
6 SMP
-I
3
.5
2
0
3
.9
7
1
S
M
P
1
3
.9
9
3
2
6
.0
3
7
2
6
.5
2
7
2
8
.1
6
9
3
0
.0
7
8
AU
0.000 0.010 0.020 0.030 0.040 0.050
Minutes
0.00 2.00 4.00 6.00 8.00 10.00 12.00 14.00 16.00 18.00 20.00 22.00 24.00 26.00 28.00 30.00 32.00 34.00 36.00 38.00 40.00 42.00 44.00
Name Retention time Area % Area Height
2.836 2028 0.01 349
SM-I 3.520 29907 0.10 4502
3.971 5546 0.02 755
SM-II 7.400
SM 13.993 28550955 99.79 1602137
SM-III 18.000
26.037 3084 0.01 340
26.527 14625 0.05 1588
28.169 1898 0.01 253
[image:13.612.68.537.65.492.2]30.078 3422 0.01 381
FIG. 27: CHROMATOGRAM OF TEST SOLUTION IN SOLUTION STABILITY [AFTER 16 HRS]
Isolation and structural elucidation of SM-I : During the synthesis of SM i.e. from SCP to SM due to the basics condition of the reaction mass there is hydrolysis of methoxy group taking place which give rise to SM-I impurity which is then isolated by preparative HPLC (described in Section 2.3.6). 95% of chromatographic purity found.1H and 13C NMR spectral data (refer Table 11) the proposed structure was confirmed. The MS / MS spectrum of the isolated Faux direct infusion mode using a combination of MS / MS spectrum was the same as the match SM-I (Refer Fig. 28 and 29).
Synthesis and structural elucidation of SM-II: Since SM-II cannot be isolated from the reaction mixture SM synthesis, it was synthesized independently. Due to the presence of 2-chloropyrazine as an impurity in 2,3-
dichloropyrazine used as raw material in synthetic route of SM there is formation of SM-II which remains unreacted and get carry forward to SM final. This impurity was prepared synthetically by using the same synthetic route as that of SM but instead of 2,3-dichloropyrazine the starting material used was 2-chloropyrazine (Fig. 30). The chromatographic purity was found to be 97%. 1H and 13C NMR spectral data (refer to Table 11) confirmed the proposed structure. Direct infusion of the compound synthesized from unclean condition using MS / MS spectrum was a match to the MS/MS spectrum of SM-II.
synthesized by using 2,6-dichloropyrazine instead of 2,3-dichloropyrazine in synthetic process of SM (Fig. 31). The chromatographic purity was found to be 96%. 1H and 13C NMR spectral data (refer to
Table 11) confirmed the proposed structure. Direct infusion of the compound synthesized from unclean condition using MS / MS spectrum was a match to the MS/MS spectrum of SM-III.
FIG. 28: MASS SPECTRUM OF SM P, (b) ms/ms SPECTRUM OF SM
FIG. 29: (a) MASS SPECTRUM OF SM – I, (b) ms/ms SPECTRUM OF SM -I
FIG. 30: (a) MASS SPECTRUM OF SM-II, (b) ms/ms SPECTRUM OF SM-II
[image:14.612.95.519.116.733.2]TABLE 11: NMR DATA OF SM-I, II, III AND SM N N N H S O O NH2 O H 1 2 3 4 5 3 4 6 7 8 13 12 11 10 9 14 15 SM N N N H S O O NH2 CH3 1 2 3 4 5 3 4 6 7 8 13 12 11 10 9 14 SM-I N N N H S O O NH2 1 2 3 4 5 3 4 6 7 8 13 12 11 10 9 SM-II N N N H S O O NH2 1 2 3 4 5 3 4 6 7 8 13 12 11 10 9 O H 14 15 SM-III Posi tion Integr ation δ ppm Multipli city J(H)z 13C &ppm Integ ration δ ppm Multipl icity J(H)z 13C& ppm Integra tion δ ppm Multip licity J(H)z 13C& PPM Inter griti on
δ ppm Multip
licity J(H)z
13C & ppm
1 2Ha 6.01 Brs - 2Ha 4.39 Brs 2Ha 6.08 Brs 2Ha 6.08 Brs
2 - - - 153.3 - - 151.6 153.8 151.6
3 2Ha 6.57 d(8.8) 112.6 2Ha 6.61 d(8.8) 116.6 2Ha 6.58 d(8.8) 153.9 2Ha 6.56 d(8.8) 116.6
4 2H 7.67 d(8.8) 130.2 2Ha 7.81 d(8.8) 128.1 2Ha 7.58 d(8.8) 129.8 2Ha 7.55 d(8.8) 128.1
5 - - - 125.6 - - 129.1 124.5 129.7
6 - - - -
7 1Hb 10.34 Brs - 1Hb 11.7 Brs 1Hb 11.0 Brs 1Hb 11.11 Brs
8 - - - 149.9 - - 152.7 7.8 154
9 1Ha - d(1.2) 138.8 1Ha - 145.7 1Ha 7.8 7.8 1Ha 8.32 d(1.2) 123
10 - - - 7.8
11 1Ha 7.71 S 133.9 1Ha 6.05 d(4.3) 125.5 1Ha 1Ha 8.18 s 132.4
12 1Ha 7.71 S 133.6 1Ha 6.9 d(4.3) 125.5 1Ha 1Ha 8.18 s 161.1
13 - -- - -- - -
14 - - - - 1Hb 8.44 Brs
15 2Hb 3.89 S 54.1 - - 3H 3.73 S 3.73 55.9
s-singlet, d-doublet, brs-broad singlet. a Refer the structural formula in Figure.b1H-1H coupling constants
CONCLUSION: The present study details the identification and determination of structure of four process related impurities are found in the product (SM). Reverse phase HPLC using a gradient of a newly developed method, the impurities were detected in samples of crude and refined SM during process development studies. An exhaustive study was carried out LC / MS / MS for the identification of impurities using. The spectroscopy using different technologies and their synthesis was followed by characterization. For a quantitative estimate of the contaminants in the paper elaborates on a new HPLC method validation. The specificity of the HPLC method was confirmed by injecting samples of individual impurity and it was observed that there was no interference for any of the components.
The ability of the method to precisely quantify impurities was determined by calculating the relative standard deviation (RSD) for response (peak area) of each impurity in the standard solution (a mixture of impurities) a copy of the injections. For determining method accuracy, known as unclean LOQ, the specified limit of 80%, 100% and 120% of the SM bulk sample (test preparation) was spiked into. Signal to noise (S/N)
method was used for Detection limit (DL) and quantitation limit (QL) for all impurities. On drawing a plot at six concentration levels in triplicate, covering a range of LOQ to 150 %, linear calibration plots were achieved. The stability of solution of SM sample and its related impurities was determined by placing both solutions in tightly capped HPLC vials at 25 °C for 16 hrs in an auto sampler. There are no significant changes were noted in the area of impurities in standard solution after 16 hours. But in sample solution area of SM-I have been increased and one unknown impurity at RRT 0.28 is generated after 16 hours. From stability data generated it is concluded that standard solution is stable for 16 hours and sample solution should be prepared freshly.
ACKNOWLEDGEMENT: The authors are
thankful to Mukesh Kumar Gupta, Nitin Rathod from IPCA Laboratories and M.R. Chaudhary for their help and co-operations.
CONFLICTS OF INTEREST: Nil
REFERENCES:
1. Schwenger EM, Tejani AM and Loewen PS: Probiotics for
preventing urinary tract infections in adults and children. Cochrane Database System Reviews 2015; 23 (12):1-18
2. Penali L and Jansen FH: Single-day, three-dose treatment
methoxypyrazine/pyrimethamine to cure Plasmodium falciparum malaria. International Journal Infectious Diseases 2008; 12(4): 430-437.
3. Duke O, Yusuf A and Claire N: Derivatized Electrodes in
the Electro analysis of
Pyrimethamine/2-Sulfanilamido-3-Methoxypyrazine (Metakelfin) and Lumefantrine/
Artemeter (Coartem). Journal of chemical and chemical engineering 2014; 8: 215-225
4. Sweet man SC: The Complete Drug Reference.
Pharmaceutical Press, London, 36th edition 2009.
5. Storme ML, Jansen FH, Goeteyn W and Bocxlaer JVF:
Simultaneous quantitative analysis of the antimalarials pyrimethamine and sulfa methoxypyrazine in plasma samples using liquid chromatography/tandem mass
spectrometry., Rapid Communication of Mass
Spectrometry 2006; 20: 2947-54.
6. Dua VK, Sarin R, Gupta NC and Sharma VP: Sulfalene
concentrations in plasma and blood cells of Plasmodium
falciparum malaria cases after treatment with metakelfin
using high-performance liquid chromatography. Journal of Chromatography-B and Biomedical Sciences Applications 1998; 714: 390-98.
7. Narasimha R, Devanna KN and Suresh Reddy KVN:
Method Development and Validation Study for
Quantitative Determination of 3-Ethynylaniline Content in
Erlotinib by Liquid Chromatography–Tandem Mass Spectrometry. Indian Journal of Advances in Chemical Science 2016; 4(2): 208-213.
8. Lokhande MV, Gupta MK and Rathod NG:
Characterization and Quantitative Determination of Process Related Impurities in Sulfa methoxypyrazine By Some Analytical Techniques. International Journal of Medicine and Pharmaceutical Sciences, 2013; 3(4): 37-48.
9. ICH Q3D Guideline, Impurities in New Drug Substances,
Step- 5 version 2014.
10. Turin VG, Oranto G: Buracchi, United States Patent
4299962.1981.
11. Thummala V, Raghava R, Noru AK, Seshadri RK,
Annarapu MR, and Ivaturi MR: Development and Validation of a Stability-Indicating RP-HPLC Method for Simultaneous Estimation of Dextromethorphan Impurities
in Pharmaceutical Formulations. Chromatography
Research International 2013; 2013:1-12.
12. Primer: Pharmaceutical impurities analysis solution,
Agilent technology 2015.
13. Blessy M, Patel RD, Prajapati PN and Agarwal YK:
Development of forced degradation and stability indicating studies of drugs—A review. Journal of Pharmaceutical Analysis 2014; 4(3): 159–165.
All © 2013 are reserved by International Journal of Pharmaceutical Sciences and Research. This Journal licensed under a Creative Commons Attribution-NonCommercial-ShareAlike 3.0 Unported License.
This article can be downloaded to ANDROID OS based mobile. Scan QR Code using Code/Bar Scanner from your mobile. (Scanners are available on Google
Playstore)
How to cite this article:
Maurya CP and Lokhande MV: Characterization and validation of impurities related to pharmaceutical bulk drug (API) by using some
![TABLE 8: CHANGE IN COLUMN TEMPERATURE 3 °C Change in column temperature [+ 3°C]](https://thumb-us.123doks.com/thumbv2/123dok_us/8878092.944946/10.612.46.565.549.715/table-change-column-temperature-c-change-column-temperature.webp)
![FIG. 27: CHROMATOGRAM OF TEST SOLUTION IN SOLUTION STABILITY [AFTER 16 HRS]](https://thumb-us.123doks.com/thumbv2/123dok_us/8878092.944946/13.612.68.537.65.492/fig-chromatogram-test-solution-solution-stability-hrs.webp)
