3069
MALWARE VISUALIZATION TECHNIQUE:
A SYSTEMATIC REVIEW
1,3ABDALRAHMAN ALFAGI, 2,3AZIZAH ABD MANAF, 2AZIDA ZAINOL, 2ALAA
ABDULSALAM ALAROOD
1Faculty of Information Technology, University of Al Zawia, Libya 2 Faculty of Computing and Information Technology, University of Jeddah
Jeddah, Saudi Arabia
3 Advanced Informatics School, Universiti Teknologi Malaysia
Kuala Lumpur, Malaysia
E-mail: 1[email protected], 2[email protected], 3[email protected], 4[email protected]
ABSTRACT
Recently, there has been a massive increase in number of malware types which poses a severe threat to smart devices and to internet security. Thus, different techniques have been applied to detect, classify and identify malware. Among those techniques, visualization becomes the most attractive and popular. Visualization techniques have been applied to view static data, monitor network traffic or managing networks to detect and visualize the behavior of the malware. Addressing malware visualization techniques are of prime importance for protecting smart devices, monitoring network traffic or securing internet and digital resources. Although there are some literature review papers on malware detection techniques, none of them are addressed in a Systematic Literature Reviews (SLR) which details a range of related work, provides a systematic and rigorous approach to illustrate the current trend of malware detection techniques. In contrast, this paper followed general guidelines for conducting SLR to illustrate the malware visualization technique and its applications, statistically showing the most common malware types and extracted features that used to identify the malware. In this paper, an advanced search has been performed in most relevant digital libraries to obtain potentially relevant articles published until the end of 2016. About 80 primary studies (PSs) have been identified based on inclusion and exclusion criteria. The analytical study is mainly based on the PSs to achieve the papers’ objectives. The results illustrate the importance of visualization techniques and which are the most common malware as well as the most useful features.
Keywords: Malware Detection, Malware Visualization, Malware Visualization Technique, Systematic
Literature Review, Malware Classification
1. INTRODUCTION
Malware is referred to numerous names such as Malicious software, Malicious Code (MC) and Malcode that disrupt or destroy ordinary operations without the knowledge of the owner [1]. Malwares can be divided into several categories, such as viruses, worms, Trojans, spywares and adware’s, Rootkits, etc. [2], [3]. Malware causes the most common incidents ranged from; gather sensitive information [4], perform malicious activities and gain access [5], gives a malicious party remote access [6] to the financial loss [7]. Different techniques have been deployed to detect, identify and classify the malware. According to [2], [3], [8] the malware detection techniques can be
categorize to Signature-Based, behavior-Based, Analysis-Based, anomaly-Based and visualization-Based. Malware visualization is a field that focuses on detecting, classifying and representing malware features in a form of visual cues that could be used to convey more information about a particular malware [9].
3070 images. Malware threat scenarios are rapidly changed in the last years with the creation of new attacks techniques. Consequently, the severity of malwares on the operations of systems is also increased. In addition, malware detection techniques also have seen a change and increased. Therefore, it is important to systematically review the existing malware visualization techniques to highlight the most usage techniques during the years. In addition, it is important to address the most common and extracted features that used by the malware visualization techniques.
2. RELATED WORK
There are several literature review papers (to the best of our knowledge only few review papers detailed in table 1 appendix A) that provide a literature review on malware detection techniques. A survey on heuristic malware detection techniques [2] discussed the state of the art heuristic malware detection methods and briefly overview various features used in these methods such as API Calls, OpCodes, N-Grams etc. and discuss their advantages and disadvantages. In a review on feature selection in mobile malware detection [12], 100 research works published between 2010 and 2014 with the perspective of feature selection in mobile malware detection we reviewed and available features into four groups, namely, static features, dynamic features, hybrid features and applications metadata. The review of the mobile malware detection approaches [13] provided a comprehensive review and comparison of the most recent (dated mostly 2011 -2013) approaches to mobile malware detection. Another Review of Free Cloud-Based Anti-Malware Apps for Android [14] evaluated the effectiveness of ten popular free cloud-based anti-malware apps using a
known Android malware dataset. A study of the rise of “malware”: Bibliometric analysis of malware study [15] presented a comprehensive evaluation of malware research practices published between 2005 and 2015 in North America, Asia and other continents. However, none of them is a systematic literature reviews which details a range of related work, provides a systematic and rigorous approach to illustrate the current trend of most used detection techniques among above-mentioned techniques.
Moreover, [16] stated that a significant amount of work has been published in this area, but slight work has been done to study the emerging of visualization techniques, which encouraged authors to conducting this work. According to [17] focused on significant resources and types of features that are important to analyze malware activities and common visualization techniques that are currently used as well as methods to choose the right visualization technique in order to analyze the security events effectively. Consequently, a study by [18] reviewed malware detection methods used Opcode, control flow graph (CFG) and API call graph whereas our study focuses on extensive systematic literature review on malware detection techniques which the findings are different from the existing works.
In contrast to the existing literature reviews, this work followed the general guidelines of [19] for conducting Systematic Literature Review (SLR) which details a range of related work to provide a systematic and rigorous approach to illustrate the current trend of malware detection techniques.
[image:2.612.98.479.538.700.2]3. RESEARCH METHOD
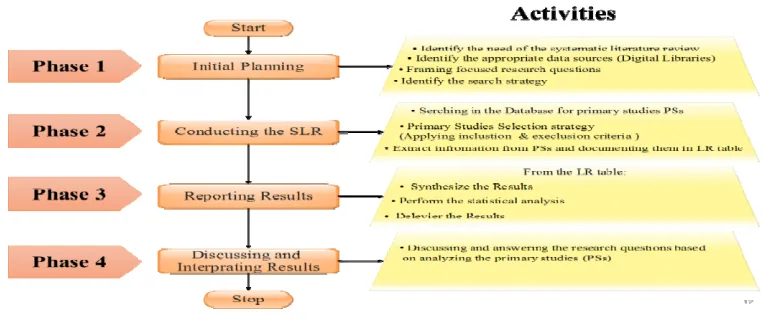
3071 For performing SLR four phases have been performed; initial planning, conducting SLR, reporting the result, and discussing and interpret the results. Figure 1 graphically illustrates the involved phases as well as the activities of each phase. At first phase, the authors identify the need of the SLR, the appropriate digital resource, then framing focused research questions using recent criteria called Population, Intervention, Comparison, Outcome, and Context (PICOC) used by [19]. Then, in the second phase, the authors searched the databases for obtaining the primary studies, after that the obtained primary articles are evaluated for relevance and quality, then extracted data from the primary studies. After that, the results are synthesized, analyzed and reported. Finally, the authors discussed and interpreted the result.
3.1 Research Questions
The main objectives of this paper are to systematically answer the following Research Questions (RQs):
RQ1: What are the malware visualization techniques and applications?
RQ2: What types of malware and features that are mostly reported and investigated? The first (RQ1) is motivated by the desire of exploring the malware detection techniques as well as to illustrate the visualization techniques and their applications. whereas, the second (RQ2) is motivated by the desire of exploring the most common type of malware as well as to explore the extracted features that used by the visualization techniques for malware detection, classification and identification.
3.2 Searching Strategy
For gathering the most related primary studies (PSs) and to obtain a comprehensive list of articles in the field, the authors searched 8 academic and scientific digital libraries include ScienceDirect, Scopus, IEEE, Web of Science and other academic digital libraries. More specifically, the authors selected academic digital libraries that contain peer reviewed journal articles, conference proceedings, and book chapters, overlap in content as tiny as possible, and libraries that appear in other reviews on malware detection and visualization techniques.
Different academic tools such as google scholar engine, MS excel, MS word and EndNote X7.5 were used for gathering, documenting, analyzing the list of relevant and related articles by
performing an automatic search in most identified resources using appropriate search string, keywords and their synonyms. The search considered all yeas from 2009 through the 2016 to cover a wider range of publication years. The main output of this activity is a comprehensive list of related work. For an advance search the key words are used, and they extracted based on the following:
The major terms extracted from the research questions.
Alternative spellings and synonyms of the major terms.
Research keywords that appeared the existing literature review.
Boolean (AND) was used to connect the major research terms and Boolean (OR) used to connect alternative spellings and synonyms of the keywords.
To search in advanced way, some general search strings are used such as: visualization techniques, malware detection technique, malware type, extracted features, detection technique, malicious code detection, malware classification, malware survey.
3.3 Primary Study Selection
3072
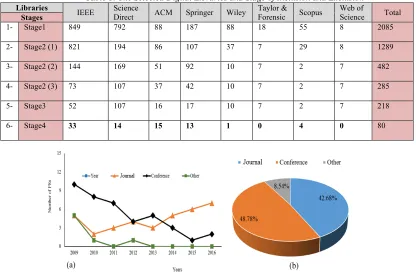
Table 1: The Selected Digital Libraries and Stage of Inclusion and Exclusion
Libraries IEEE Science
Direct ACM Springer Wiley Taylor & Forensic Scopus Web of Science Total Stages
1- Stage1 849 792 88 187 88 18 55 8 2085
2- Stage2 (1) 821 194 86 107 37 7 29 8 1289
3- Stage2 (2) 144 169 51 92 10 7 2 7 482
4- Stage2 (3) 73 107 37 42 10 7 2 7 285
5- Stage3 52 107 16 17 10 7 2 7 218
6- Stage4 33 14 15 13 1 0 4 0 80
1) Stage 1: At this stage we identified the potentially relevant articles by searching in all digital libraries on all articles that are relevant to Malware detection technique, Data Visualization technique, malware classification, malware type,
extracted features and malware survey. The
result is presented in row one where 2085 articles have been obtained.
2) Stage 2: At this stage, we included articles that satisfied the following three criteria:
Titles should contain Malware OR/AND malicious software OR/AND the synonym.
The result is presented in row two.
Abstracts should contain Malware OR/AND
Detection, classification or visualization. The
result is presented in row three.
Keywords should contain Malware, Visualization, Security data visualization, malicious software, dynamic analysis, static analysis, information system security or detection. The result is presented in row four.
3) Stage 3: At this stage we excluded articles that are not an English text. The result is presented in row five.
4) Stage 4: In this stage articles that are not accessed in full text are excluded. The result is presented in row six. All these stages are implemented to filter the first obtained list. The filtering processes are performed on the title, abstract and keywords. Then, the articles of final comprehensive list of PSs are downloaded in a full text, classified based on the name of digital library and stored in the Endnote.
3.4 Information extraction and synthesized
Extracting and synthesized information is the final stage in the reviewing protocol, whereby the relevant information from each article that counted in the final comprehensive list of PSs is extracted and synthesized. For this purpose, a Literature Review Table (LRT) with several columns is designed which includes not limited to the author, year, title, detection technique, the extracted feature and the method of analyzing or visualizing the
3073 result (Appendix B table 1). This table is used to statistically answer the RQ1. In addition, the table having the following columns; author, year, title, type of malware that have been focused on as well as the families that have been discussed, the extracted features that are used to visualize malware or the feature selection method and the data source. The table is used and analyzed statistically to deliver the main objectives of this SLR
.
4. RESULT
This section provides an overview on the malware detection techniques and then answering the RQs based on analyzing the 80 PSs that identified in accordance to review protocol.
4.1 Overview of the PSs
This section provides an overview on the related articles that published through the years 2009 to 2016. Because of searching strategy, a total of 2524 articles were collected. After applying inclusion and exclusion criteria only 80 articles were considered as the PSs in this SLR. The rest were excluded because the inclusion criteria were not satisfied therefore they excluded besides the
articles that were not available in a full text. Figure 2 (a) illustrates the growth of the published PSs in the field (Journal, conferences and overall) in lines tend. Whereas Figure 2 (b) shows a pie chart of the published PSs in conferences and journals respectively in a pie chart of the published PSs in conferences and journals respectively in a percentage. As shown in Figure 2 (a) the beginning of publication in the field starts strongly at 2009 where more than 9 related articles were found. The publication in conferences slightly goes down during the years whereas the journals more attention for the field. It is obviously seen that, after 2013 the publications in journals rapidly growth meanwhile conferences and other publication such as workshops and books go down. Moreover, Figure 2 (b) illustrates in a percentage the number of published articles in journals and conferences. Almost the half (48%) of PSs were published in conferences while only (42%) were published in journals. Noticeably, there is a slight difference between the percentage of published articles in journals and the percentage of published articles in conferences. This slight difference indicates the importance of extracting information from both journals and conferences to achieve the objectives of this SLR.
4.2 RQ1 : What are the malware visualization techniques and applications?
Before reviewing the PSs, we have focused on the basic definitions of malware and visualization technique. Malware is stands for malicious software. However, many PSs considered any code or program running behind the scenes and without the knowledge of the owner (person or entity) is a malicious software. According to [12] there are countless number of malwares spread every year rise with malicious activities, such as stealing users data, sending premium messages and making phone call to premium numbers that users have no knowledge and harm or damage different operating systems. For answering this RQ, we have reviewed all PSs with focusing on the most common
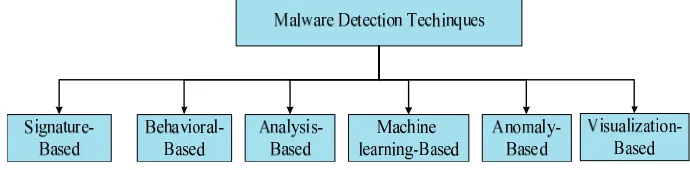
[image:5.612.129.474.611.696.2]analytics techniques that are applied to detect, classify and identify the malware. Also, we have focused on the data visualization techniques, visualization techniques categorization, and visualization techniques applications. All of this information is extracted and documented in LRT1 that created at section 3.4. Based on the LRT1 the following results are delivered and then discussed. In addition, different detection techniques are applied to detect, classify and identify the malwares. To the best of our knowledge and based on reviewed surveys detection techniques can be categorized in different categories from different points of view. In this SLR, the categorization of malware detection techniques is based on the method of detection as shown in Figure 3.
3074 There are a variety of malware detection technique as shown in the figure 3 while malware issues still reported by security projects and specialists. Based on the statistical analysis of LRT1, we have visualized in a line trend the most existing techniques as shown in Figure 4 to illustrate the used malware detection technique in lines trend since 2009 until 2016.
The figure 4 clearly shows that during the years, visualization technique is the highly used among other techniques. It is evidently that, the visualization is important and useful method in
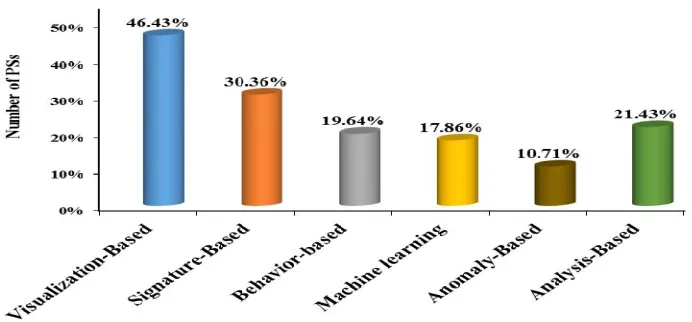
analyzing malicious software as well. Visualization technique is developed to accelerate the analysis progress [21]. However, [9], [10], [16] stated that, visualization techniques are applied to detect and visualize the behavior of the malware so recently. It focuses on representing malware features in a form of visual that could be used to convey more information about a particular malware. To illustrate the percentage of usage of each detection technique, a column pars has been drown as shown in Figure 5.
Besides, the indication that extracted from the above figure about the usability and effectiveness of visualization techniques. The authors in [2] stated that signature based and behavioral methods that shown in the second and third column bar respectively are unable to detect protected malware, so a novel method which can efficiently detect
malware is absolutely required otherwise the visualization techniques still the best solution.
[image:6.612.157.455.262.383.2]Overall, malware is a serious issue in private or public sectors. Different techniques have been applied to detect, classify and identify malware. Among several detection techniques, visualization-based technique becomes the most
Figure 4: Line Trend for Malware Detection Techniques during the Recent Years
[image:6.612.121.467.425.586.2]3075 attractive one. Malware visualization is a field that focuses on detecting, classifying and representing malware features in a form of visual that could be used to convey more information about a particular malware. Regardless the visualization methods whether if graph, map, etc. most of them have been used to visually detect, classify or identify malware. However, the answer of this RQ illustrates with strong evidence the usefulness of visualization techniques not only in detecting malware but also in several other applications.
4.3 RQ 2 : What types of malware and features that are mostly reported and investigated?
As reported by [2], [3], [8], malware has different type and each type has a family. Therefore, this RQ aims to exploring the most common type of malware as well as providing brief description for each type in term of capability. Besides that, this RQ aims to illustrate with example the families of most common malwares to provide the reader with brief knowledge on the malware types and families. Another purpose of this RQ, which is illustrating the most useful features that could be extracted and considered as an effective information in detecting malware. However, regarding this we focused more on the extracted features that are useful for malware visualization. To answer this RQ, we have divided it to two parts. At the first part we reviewed all PSs with focusing on the most common type of malware and families. During this part, the LRT is filled with the related information. At the second part, we have reviewed the articles information about the common and useful features that are used as a data sources for the visualization techniques. As confirmed by many PSs, there are many types of Malware. However, grouping or categorizing malware types could be done based on functionality, behavior, platform or capability. In contrast to previous related work, this paper also focused on the type of malware that mostly investigated and reported to provide the reader with brief description and capability of each one.
Based on the PSs, Adware, Trojan, Backdoor, virus, Worm, Botnet, rootkits, MouaBad, Privacy leakage, Spyware, Phishing Apps, Privilege escalation, Backdoor, Macro and many others are the most reported and discussed malwares. However, Trend Micro Encyclopedia web site and some other security projects such as Internet security threat report, Annual Cyber Threat Reports, Open Web Application Security Project (OWASP), Web Application Attack Report
(WAAR) and Symantec provide more details and knowledge about malware. In this SLR, most of PSs [22], [23], [24], [25] reported and discussed specific malwares namely; viruses, worms, Trojan, spyware, adware and rootkits.
5. DISCUSSION
This section discusses and interprets the results reported in Section 4
.
5.1 Malware Detection Techniques (MDT) and Visualization Techniques Related to RQ1
In this SLR, based on 80 articles different malware detection techniques have been explored including Signature-Based, Behavior-Based, Analysis-Based, Anomaly-Based and Visualization-Based. The results illustrate that the most visualization technique is the most used method. This method is the most common due to the verities of its applications besides the following advantages:
The visualization technique can be easily automated and used to analyze a large number of malware [10].
Visualization-based techniques have demonstrated great utility in analyzing malicious software [26].
Using visualization of program execution for studying and monitoring program execution has been used in the past with good results [21].
Visualization techniques not require unpacking or decryption as well as can apply widely used image processing techniques like textures analysis [27].
In addition, there are different visualization techniques can be used easily by expertise it the field or even who have few knowledge about it. Many visualization techniques such as images, graphs, plots, maps, and others are effective method to detect malware with several visualizing methods. Finally, as illustrated by Figure 5, visualization techniques still the best solution among the rest.
5.2 Malware Types and Features Extraction Related to RQ2
3076
6. CONCLUSION
Systematic Literature review aims to identify, assess and combine the evidence from primary research studies using an explicit and rigorous method. In this work, SLR conducted to systematically investigate the current state of knowledge about Malware detection techniques, data visualization and malware features. 80 primary studies have been identified in accordance with our review protocol and published between 2009 to the end of 2016. The major contributions of this paper can be concluded as:
Detailing an obvious range of related work, search strategy and study selection for relevant articles in the field of malware visualization techniques
A systematic, evidence-based, and rigorous approach in conducting and reporting the result of the research question.
Providing a list of related studies (in Appendix A & B) that simplify the effort of searching and benefits the researchers and practitioners who intend to retrieve a relatively comprehensive collection of relevant articles.
A lack of SLR in the field encourages the authors to continue the evaluation and improvement of this approach.
Acknowledgments. The authors would like to
express greatest appreciation to Advanced Informatics School (AIS), Universiti Teknologi Malaysia (UTM) for financial support, University of Jeddah, Saudi Arabia and University of Al Zawia, Libya.
REFRENCES:
[1] Y. Zhang, Y. Xiao, K. Ghaboosi, J. Zhang, and H. Deng, “A survey of cyber crimes,” Secur. Commun. Networks, vol. 5, no. 4, pp. 422–437, 2012.
[2] Z. Bazrafshan, H. Hashemi, S. M. H. Fard, and A. Hamzeh, “A survey on heuristic malware detection techniques,” in The 5th Conference on Information and Knowledge Technology, 2013, pp. 113–1120.
[3] M. La Polla, F. Martinelli, and D. Sgandurra, “A Survey on Security for Mobile Devices,” IEEE Commun. Surv. Tutorials, vol. 15, no. 1, pp. 446–471, 2013.
[4] G. Meng et al., “Mystique: Evolving
Android Malware for Auditing Anti-Malware Tools,” in Proceedings of the 11th ACM on Asia Conference on Computer and Communications Security, 2016, pp. 365– 376.
[5] S. Vemparala, F. Di Troia, V. A. Corrado, T. H. Austin, and M. Stamo, “Malware Detection Using Dynamic Birthmarks,” in Proceedings of the 2016 ACM on International Workshop on Security And Privacy Analytics, 2016, pp. 41–46.
[6] D. Dang-Pham and S. IPittayachawan, “Comparing intention to avoid malware across contexts in a BYOD-enabled Australian university: A Protection Motivation Theory approach.,” Comput. Secur., vol. 48, pp. 281–297, 2015.
[7] G. Meng, Y. Xue, Z. Xu, Y. Liu, J. Zhang, and A. Narayanan, “Semantic modelling of Android malware for effective malware comprehension, detection, and classification,” in Proceedings of the 25th International Symposium on Software Testing and Analysis, 2016, pp. 306–317. [8] N. Idika and A. P. Mathur, “A survey of
malware detection techniques,” West Lafayette, 2007.
[9] S. Z. M. Shaid and M. A. Maarof, “Malware behavior image for malware variant identification,” in 2014 International Symposium on Biometrics and Security Technologies (ISBAST), 2014, pp. 238–243.
[10] K. Han, J. H. Lim, and E. G. Im, “Malware analysis method using visualization of binary files,” in Proceedings of the 2013 Research in Adaptive and Convergent Systems, 2013, pp. 317–321.
[11] A. R. A. GRÉGIO and R. D. C. DOS SANTOS, “Visualization techniques for malware behavior analysis.,” in Proc. SPIE 8019, Sensors, and Command, Control, Communications, and Intelligence (C3I) Technologies for Homeland Security and Homeland Defense X, 2011.
[12] A. Feizollah, N. B. Anuar, R. Salleh, and A. W. A. Wahab, “A review on feature selection in mobile malware detection.,” Digit. Investig., vol. 13, pp. 22–37, 2015. [13] S. Anastasia and G. Dennis, “Review of the
3077 [14] W. Jason and R. C. Kim-Kwang, “Review
of Free Cloud-Based Anti-Malware Apps
for Android,” in IEEE
Trustcom/BigDataSE/ISPA, 2015, pp. 1053–1058.
[15] M. F. AbRazak, N. B. Anuar, R. Salleh, and A. Firdaus, “The rise of ‘malware’: Bibliometric analysis of malware study,” J. Netw. Comput. Appl., vol. 75, pp. 58–76, 2016.
[16] H. Shiravi, A. Shiravi, and A. A. Ghorbani, “A survey of visualization systems for network security.,” IEEE Trans. Vis. Comput. Graph., vol. 18, no. 8, pp. 1313– 1329, 2012.
[17] P. Magalingam et al., “SYSTEMATIC
LITERATURE REVIEW FOR
MALWARE VISUALIZATION
TECHNIQUES,” vol. 96, no. 16, pp. 5338– 5349, 2018.
[18] M. Irshad, H. M. Al-Khateeb, A. Mansour, and M. Hamisu, “Effective methods to detect metamorphic malware: A systematic review,” Int. J. Electron. Secur. Digit. Forensics, vol. 10, no. 2, pp. 138–154, 2018.
[19] B. Kitchenham and S. Charters, “Guidelines for performing Systematic Literature Reviews in Software Engineering,” Keele, Staffs, 2007.
[20] P. Brereton, B. A.Kitchenham, D. Budgen, M. Turner, and M. Khalil, “Lessons from applying the systematic literature review process within the software engineering domain,” J. Syst. Softw., vol. 80, no. 4, pp. 571–583, 2007.
[21] C. L. Yee, L. L. Chuan, M. Ismai, and N. Zainal, “A static and dynamic visual debugger for malware analysis,” in 18th
Asia-Pacific Conference on Communications (APCC), 2012, pp. 765–
769.
[22] R. Islam, R. Tian, L. Batten, and S. Versteeg, “Classification of Malware Based on String and Function Feature Selection,” in 2010 Second Cybercrime and Trustworthy Computing Workshop, 2010, pp. 9–17.
[23] Z. Chen, M. Roussopoulos, Z. Liang, Y. Zhang, Z. Chen, and A. Delis, “Malware characteristics and threats on the internet ecosystem,” J. Syst. Softw., vol. 85, no. 7, pp. 1650–1672, 2012.
[24] A. Long, J. Saxe, and R. Gove, “Detecting malware samples with similar image sets,” in Proceedings of the Eleventh Workshop on Visualization for Cyber Security, 2014, pp. 88–95.
[25] C. Barría, D. Cordero, C. Cubillos, and M. Palma, “Proposed classification of malware, based on obfuscation.,” in 6th International Conference on Computers Communications and Control (ICCCC), 2016, pp. 37–44.
[26] G. Conti, E. Dean, M. Sinda, and B. Sangster, “Visual Reverse Engineering of Binary and Data Files,” in VizSec ’08 Proceedings of the 5th international workshop on Visualization for Computer Security, 2008, pp. 1–17.
3078
Appendix A (Literature Reviews and surveys)
Year Authors Title
2012 Chithra Selvaraj and Sheila Anand A survey on Security Issues of Reputation Management Systems for Peer-to-Peer Networks 2012 H. Shiravi, A. Shiravi and A. A.
Ghorbani security A survey of visualization systems for network 2013 Z. Bazrafshan, H. Hashemi, S. M. H.
Fard and A. Hamzeh
A survey on heuristic malware detection techniques
2013 Mariantonietta La Polla, Fabio
Martinelli and Daniele Sgandurra A Survey on Security for Mobile Devices 2013 Steve Mansfield-Devine Security review: the past year
2013 Seyedmostafa Safavi, Zarina Shukur
and Rozilawati Razali Devices Reviews on Cybercrime Affecting Portable 2014 Ulrik Franke and Joel Brynielsson Cyber situational awareness – A systematic
review of the literature 2015 Abdullah A. AlQahtani and El-Sayed
M. El-Alfy
Anonymous Connections Based on Onion Routing: A Review and a Visualization Tool 2015 Ali Feizollah, Nor Badrul Anuar, Rosli
Salleh and Ainuddin Wahid Abdul Wahab
A review on feature selection in mobile malware detection
2015 A. Skovoroda and D. Gamayunov Review of the Mobile Malware Detection Approaches
2015 J. Walls and K. K. R. Choo A Review of Free Cloud-Based Anti-Malware Apps for Android
2016 Bilal Alsallakh, Luana Micallef, Wolfgang Aigner, Helwig Hauser, Silvia Miksch and Peter Rodgers
The State-of-the-Art of Set Visualization
2016 J. Amudhavel, V. Brindha, B. Anantharaj, P. Karthikeyan, B. Bhuvaneswari, M. Vasanthi, D. Nivetha and D. Vinodha
A survey on Intrusion Detection System: State of the art review
2016 Mohd Faizal Ab Razak, Nor Badrul
Anuar, Rosli Salleh and Ahmad Firdaus malware study The rise of “malware”: Bibliometric analysis of 2016 Florian Skopik, Giuseppe Settanni and
Roman Fiedler on the dimensions of collective cyber defense A problem shared is a problem halved: A survey through security information sharing
Appendix B (Literature Review Table (LRT1))
ID Year Author Title Database Main Idea (e.g. Technique)
1 2014 (Shabtai et al., 2014)
Mobile malware detection through analysis of deviations
in application network behavior
Science
Direct behavior-based
2 2011 (Park and Reeves, 2011) Deriving common malware behavior through graph clustering
ACM Behavior-based
3 2013 (Park et al., 2013) Deriving common malware behavior through graph clustering
Science
Direct Behavior-based
3079
method based on behavior chains
5 2016 (Bocchi et al., 2016)
MAGMA network behavior classifier for
malware traffic
Science
Direct Behavior-based
6 2016 (Bou-Harb et al., 2016)
A novel cyber security capability: Inferring Internet-scale infections by correlating malware and probing activities
Science
Direct Analysis-Based
7 2012 (Chen et al., 2012)
Malware characteristics and threats on the internet
ecosystem
Science Direct
8 2012 (Dube et al., 2012) Malware target recognition via static heuristics Direct Science Machine learning + static heuristic
9 2015 (Mohaisen et al., 2015)
AMAL: High-fidelity, behavior-based automated malware analysis and
classification
Science
Direct behavior-based
10 2014 (Long et al., 2014)
Detecting Malware Samples with Similar Image
Sets ACM Visualization-Based
11 2011 Santos, 2011) (Gregio and Visualization Techniques for Malware Behavior Analysis
SPIE Visualization-Based
12 2013 (Han et al., 2013) using Visualization of Binary Malware Analysis Method Files
ACM Visualization-Based
13 2010 Xiang, 2010b) (Cesare and
A fast flowgraph based classification system for packed and polymorphic malware on the endhost.
IEEE Heuristic-Based
14 2011 Kostakis, 2011) (Kinable and
Malware Classification based on Call Graph
Clustering Springer Visualization-Based
15 2010 (Shanhu et al., 2010)
Detecting malware variants via function-call graph
similarity IEEE Analysis-Based
16 2009 (Tabish et al., 2009) Statistical Analysis of Byte-Malware Detection using Level File Content
ACM Analysis-Based
17 2009 (Trinius et al., 2009)
Visual Analysis of Malware Behavior Using
Treemaps and Thread Graphs IEEE Visualization-Based
18 2012 Nadjin, 2012) (Zhuo and
MalwareVis: Entity-based Visualization of Malware
Network Traces ACM Visualization-Based
19 2011 (Nataraj et al., 2011) Visualization and Automatic Malware Images: Classification
ACM Visualization-Based
20 2009 (Tian et al., 2009)
An Automated Classification System Based on the Strings of Trojan and
Virus Families
IEEE Analysis-Based
21 2010 (Islam et al., 2010) Based on String and Function Classification of Malware Feature Selection
IEEE Analysis-Based
22 2010 (Park et al., 2010)
Fast malware classification by automated behavioral graph
3080
23 2009 2009) malware clustering citeseer Dynamic analysis
24 2016 (Vemparala et al., 2016) Malware Detection Using Dynamic Birthmarks ACM Analysis-Based
25 2012 (Chan Lee et al., 2012) Visual Debugger for Malware A Static and Dynamic Analysis
IEEE Visualization-Based Statistical analysis +
26 2009 Liebrock, 2009) (Quist and
Visualizing Compiled Executables for Malware
Analysis IEEE Visualization-Based
27 2013 (Donahue et al., 2013) Visualization Techniques for Efficient Malware Detection
IEEE Visualization-Based
28 2013 (Kancherla et al., 2013) Image Visualization based Malware Detection IEEE Visualization-Based
29 2015 Patrot, 2015) (Makandar and Classification using Artificial Malware Analysis and Neural Network
IEEE Visualization-Based
30 2014 (Bai et al., 2014)
Approach for malware identification using dynamic
behaviour and outcome triggering
IEEE Behavior-based
31 2012 (Anderson et al., 2012) Classification: Bridging the Improving Malware Static/Dynamic Gap
ACM Analysis-Based
32 2014 Maarof, 2015) (Shaid and
Malware Behavior Image for Malware Variant
Identification IEEE Visualization-Based
33 2013 (Zhao et al., 2014) based on the control-flow Malware detection method construct feature of software
IEEE
34 2010 Hai-feng, 2010) (Wei-wei and network security situation Prediction model of based on regression analysis
IEEE Anomaly-Based
35 2013 (Zhan et al., 2013)
Characterizing honeypot-captured cyber attacks: statistical framework and case
study
IEEE Signature-Based
36 2012 (Kwon et al., 2012)
DDoS attack forecasting system architecture using
honeynet IEEE Signature-Based
37 2014 (Drašar et al., 2014)
Similarity as a central approach to flow-based
anomaly detection wiely
Signature-Based + Anomaly-Based
38 2011 Bucur, 2011) (Tudorica and several NoSQL databases with A comparison between comments and notes
IEEE Signature-Based
39 2011 (Singh and Joshi, 2011)
A honeypot system for efficient capture and analysis
of network attack traffic IEEE
Signature-Based + Anomaly-Based
40 2011 Sardana, 2011) (Jain and
A hybrid honeyfarm based technique for defense against
worm attacks IEEE
Signature-Based + Anomaly-Based
41 2011 Rana, 2011) (Alosefer and attacks via behaviour analysis Predicting client-side using honeypot data
IEEE Anomaly-Based Signature-Based +
42 2010 (Ma et al., 2010) collaborative defense using Honeynet-based improved highly predictive
3081
blacklisting algorithm
43 2012 (Saxe et al., 2012)
Visualization of Shared System Call Sequence Relationships in Large Malware Corpora
ACM Visualization-Based
44 2009 (Zhu et al., 2012)
A Social Network Based Patching Scheme for Worm Containment in Cellular
Networks
Springer Machine learning
45 2009 (Ho and Heng, 2009) Mobile and ubiquitous malware ACM Machine learning
46 2009 (Schmidt et al., 2009a) for anomaly detection Monitoring smartphones Springer Machine learning
47 2009 (Liu et al., 2009) Your Cellphone from Spies VirusMeter: Preventing Springer Power Consumption
48 2009 (Zyba et al., 2009) from Proximity Malware Defending Mobile Phones IEEE Signature-Based
49 2009 (Portokalidis et al., 2009) means of execution replication Protecting smart phones by academia Machine learning
50 2009 (Zahid et al., 2009) Identification on Smart Phones Keystroke-Based User Springer Machine learning
51 2009 (Yan et al., 2009)
SMS-Watchdog: Profiling Social Behaviors of SMS
Users for Anomaly Detection Springer Machine learning
52 2009 (Schmidt et al., 2009d)
Smartphone Malware Evolution Revisited: Android
Next Target
IEEE
Signature-Based
53 2009 (Zhang et al., 2009) Measurement and Attestation Building Efficient Integrity for Mobile Phone Platforms
Springer Verificaiton Integrity
54 2009 (Xie et al., 2009)
Designing System-Level Defenses against Cellphone
Malware IEEE Signature-Based
55 2009 (Schmidt et al., 2009c)
Detecting Symbian OS Malware through Static
Function Call Analysis IEEE Signature-Based
56 2009 (Schmidt et al., 2009b)
Static Analysis of Executables for Collaborative
Malware Detection on Android
IEEE Signature-Based
57 2010 (Dai et al., 2010) Detection on Mobile Phone Behavior-Based Malware IEEE Behavior-Based
58 2011 (Shabtai et al., 2012)
Andromaly: a behavioral malware detection framework
for android devices Springer Machine learning 59 2014 (Han et al., 2014) Visualized Image Matrices Malware Analysis Using World JournalScientific Visualization-Based
60 2016 (Meng et al., 2016)
Semantic Modelling of Android Malware for
Effective Malware Comprehension, Detection,
and Classification
ACM Behavior-based
61 2015 (Faruki et al., 2015) signature for detecting variants AndroSimilar: Robust of Android malware
Science
Direct Signature-Based
62 2012 Hashemi, 2012) (Eskandari and
A graph mining approach for detecting unknown
malwares
Science
3082
learning classifiers on static features:
64 2013 (Zheng et al., 2013)
DroidAnalytics: A Signature Based Analytic System to Collect, Extract,
Analyze and Associate Android Malware
IEEE Signature-Based
65 2009 (Bonfante et al., 2009)
Architecture of a morphological malware
detector Springer morphological 66 2010 Miller, 2010) (Roundy and Control of Malware Hybrid Analysis and Springer Analysis-Based
67 2009 (Nguyen et al., 2009)
Mavmm: A lightweight and purpose-built vmm for
malware analysis IEEE
68 2011 (Anderson et al., 2011) detection using dynamic Graph-based malware analysis
Springer Visualization-Based
69 2016 Gupta, 2016) (Sharma and
Multi-layer Defense against Malware Attacks on
Smartphone Wi-Fi Access Channel
Science
Direct Visualization-Based
70 2015 Vidyarthi, 2015) (Choudhary and
A Simple Method for Detection of Metamorphic
Malware using Dynamic Analysis and Text Mining
Science
Direct Analysis-Based
71 2015 (Alazab, 2015)
Profiling and classifying the behavior of malicious
codes
Science Direct
Based mining and Machine learning
72 2010 (Ye et al., 2010)
CIMDS: adapting postprocessing techniques of associative classification for
malware detection
IEEE
73 2010 Xiang, 2010a) (Cesare and using structured control flow Classification of malware ACM Visualization-Based
74 2014 (Cesare et al., 2014) malware variant detection Control flow-based IEEE Visualization-Based
75 2009 (Griffin et al., 2009)
Automatic Generation of String Signatures for Malware
Detection Springer Signature-Based
76 2009 (Hu et al., 2009) Indexing Using Function-Call Large-Scale Malware Graphs
ACM Visualization-Based
77 2010 (Shankarapani et al., 2010) malware classification and Kernel machines for similarity analysis
IEEE Behavior-Based analysis based Or
78 2013 Tamada, 2013) (Fukuda and
A dynamic birthmark from analyzing operand stack runtime behavior to detect
copied software
IEEE Behavior-Based
79 2015 (Annachhatre et al., 2015) Hidden Markov models for malware classification Springer
80 2013 (Austin et al., 2013) models for virus analysis: a Exploring hidden Markov semantic approach
IEEE
81 2015 (Kalbhor et al., 2015) models for virus analysis Dueling hidden Markov Springer
3083
2010) Security
83 2012 (Zhou and Jiang, 2012)
Dissecting Android Malware: Characterization and
Evolution IEEE
84 2012 (Elhadi et al., 2012)
Malware detection based on hybrid signature behavior application programming
interface call graph
Scopus Signature_Based
85 2015 (Wang et al., 2015)
Accurate mobile malware detection and classifcation in
the cloud Springer Visualization-Based
86 2014 Raesi, 2014) (Eskandari and Frequent sub-graph mining for intelligent malware detection
wiely
87 2016 (Liao and Li, 2016)
Effective network management via dynamic
network anomaly visualization wiely
88 2016 (Latvala et al., 2016) with semantic risk model Security risk visualization Direct Science Visualization-Based
89 2016 (Somarriba et al., 2016)
Detection and Visualization of Android
Malware Behavior
Web of