Technology (IJRASET)
Traffic Assignment:A Case Study Of Avkuda
Damini V. Patel1,Dr. L. B. Zala2 , Prof. A. A. Amin3
1M. Tech.Student, Department of Civil Engineering,BVM Engineering college, Vallbh Vidyanagar,Anand, India.
2Dr. L. B. Zala, professor & Head, Department of Civil Engineering, BVM Engg. college, Vallbh Vidyanagar
3Prof. A. A. Amin, Assistant Professor, Department of Civil Engineering, BVM Engg. college, Vallbh Vidyanagar
Abstract: Traffic assignment is a part of travel demand models. For traffic assignment various input data are required such as road type ,link length ,carriageway ,width , link capacity ,free flow speed ,travel time ,OD matrix etc.
This paper presents the traffic assignment for road network the AVKUDA in Anand district.With traffic congestion on the road delay of commuters has increased and reliability of road network has decreased. So traffic assignment is essential, to understand traffic operations in area. Trip assignment is the fourth step after trip generation, distribution and mode choice for transportation planning. There are different types of traffic assignment models.All-or nothing, user equilibrium and system optimum assignment models are the commonly used models. The existing O-D matrix is used for trip distribution.
GIS based software is a flexible regime to describe TAZs ,it is provide computing origin –destination matrix to any desired level of spatial disaggregation. The analysis is done by using Trans CAD software and scenario generated for future.
Keywords: Traffic, Traffic assignment, network,shortest path,TransCAD
I. INTRODUCTION
Transportation planning is important for any road network.Transportation planning is science that improve transportation facilities in an urban, regional or national level.Travel demand increases with increase in population,income and car ownership .To provide free flow on routes, its necessary to improve the existing transportation road network.Hence it is necessary for identifying and analyzing existing traffic related problems.
Traffic assignment is fourth step of transportation planning after trip generation,distribution and mode choice.There are different method for traffic assignment.This process begins with collection of Extensive data on use,socioeconomic,demographic,and network characteristics[6]
The traffic assignment problem, no matter if macroscopic or microscopic ,static or dynamic[12].The Deterministic user equilibrium (DUE)and stochastic user equilibrium (SUE)traffic assignment problem play the same important role in transportation analysis[2].In network there are three types of flow : path flow,origin-based link flow, and destination-based link flow.[2]
There are number of trips within the zone.Trip assignment determine the volume of travel for each link of the transportation network.
Trip pattern is represented by origin-destination matrix where the individual cell indicate the number of trip.To obtain OD matrix automatic counts from ITS ,such as loop dectectors and video cameras can be readily utilized for traditional synthetic OD estimation techniques[13].
Many computer software have been used for O-D matrix estimation to investigate the relationship between traffic count and O-D matrix. Most widely use Model is TransCAD Model[1].This TransCAD software used for traffic assignment process.
For using user equibrium traffic assignment there are three method : Frank-Wolfe,Disaggregate simplicial decomposition(DSD) and DSD with entropy maximization[9].
TransCAD model offers three network performance measures. The first one is vehicles hours of travel which is the summation of travel time spent by all vehicles in the network. The second one is the total vehicle kilometre travelled which is the summation of the distance travelled by all the vehicles over the network in our the network in hours. The third performance measure is volume over capacity ratio which is a direct indication of the network level of service.[6]
II. PROBLEM IDENTIFICATION
Technology (IJRASET)
Population of AVKUDA is 5,01,526.Road SH 60 is connection from Samarkha to Bhalej. NH 48 is connection between Vasad to Bhumel.Other major roads connect Sojitra to Sarsa. AVKUDA road network carries high volume of traffic.Hence leading congestion on route. Because of congestion there is increased in travel time, loss of fule, accident, delays and environmental problem is occur.
A. AIM
Aim of study is find shortest path from origin to destination and reduce congestion on the route.
B. Objectives
1) Collection of road network data.
2) To estimate the volume of traffic and Prepare O-D matrix.
3) Find out travel time between O-D.
C. Scop Of Work
1) The work is limited to following in AVKUDA area.
a) Volume count survey using moving car method.
b) To prepare O-D matrix with the data collection from origin – destination survey. c) Use traffic assignment method for traffic on network.
d) Give suggestion for route choice.
III. LITERATURE REVIEW
All assignment techniques are based on route selection. The choice of route is made on the basis of a number of criteria such as journey/travel time, length of route, cost, comfort, convenience and safety. Travel time is often considered as sole criteria since length an cost can be considered as function of time in most cases.
Moore’s developed a method for dealing with telephone calls on the basis of shortest path, and this became commonly used procedure. In practice different techniques are available for traffic assignment as discussed below:
A. .All-or-nothing Assignment
Under all-or nothing assignment ,all traffic flow between O-D pairs are assigned to the shortest paths connecting the origins and destinations. Minimum path building follows traffic assignment with link having unlimited capacity.
B. Incremental Assignment
Incremental Assignment is process in which fraction of traffic volume are assigned in step. After this link travel time is recalculate based on link volume. When there are many increments used, the flows may resemble an equilibrium assignment.
C. Capacity Restraint
This method as implemented in some software packages attempts to lessen this problem by smoothing the travel time and and averaging the lows over a set of the last inerations.
Capacity restraint is a process in which the travel resistance of a link is increased according to a relation between the practical capacity of the link and volume assigned to the link.The travel resistance in term of travel time is as per BPR as
= [ + ( ⁄ ) (1)
And Devidson (1966)
= [
/
/ ] (2)
Where
T Q = Travel time when Volume on link is Q
T0 = Free flow travel time
Technology (IJRASET)
Qmax = Maximum volume
D. User Equilibrium
User Equilibrium solution, in which no travelers can improve their time by shifting routes. The formulation of the UE problem as a mathematical program ,and the Rank-Wolf solution method revised by Le Blanc is employed in TransCAD.
E. Stochastic User Equilibrium
In this method assumes travelers do not have perfect information concerning network attributes and they perceive travel costs in different ways. Travel time is thus random variable on each link, link based choice probability using multimodal or multinominal probit model is computed and using link and node variables assignment is carried out(Sheffi,1985).
F. System optimum Assignment
System optimum Assignment computes an assignment that minimizes total travel time on the network system.
IV. STUDY METHODOLOGY
To provide route choice for AVKUDA road network first step is identification of problem and formulation of goal and objective. After the study of literature review and building the road network of AVKUDA in Trans CAD software and entering the data. Traffic data collection is done by moving car method. From the data collection estimate OD matrix. Use BPR function function
T = T + [1 + 0.15(V C⁄ ) ] (3) T =observed travel
time T0 = free flow travel time
For traffic assignment Stochastic User Equilibrium algorithm are used.
Stochastic User equilibrium is a generalization of user equilibrium that assumes travelers do not have perfect information concerning network attributes and/or they perceive travel cost in different way.SUE assignment produce more realistic results then the deterministic UE model, because SUE permits use of less attractive as the most attractive routes. Less attractive routes will have lower utilization, but will not have zero flow as they do under UE Program Formulation.
Consider the following minimization problem:
min
x z(x) = -∑ E[
min
k⋳Krs{C }|c ] +∑ x t (x )− ∑ ∫ t (w)dw (4)
Technology (IJRASET)
V. DATA COLLECTION
A. Road network
Network is commonly used to describe a structure that can be either physical or conceptual. Network includes two types of elements: a set of points called nodes and a set of line segments connecting these points. Each link is typically associated with some impedance which depend on the flow using it. The units of measurement of this impedance depend on the nature of the network and the link flows, impedance can represent electrical resistance ,time, cost, utility, or any other relevant measure.
The roadway network in an urban area includes intersection and streets through which traffic moves.
In order to achieve the objectives of study work starting with data collection including road network characteristics and traffic volume. First of all zoning of AVKUDA is done for O-D matrix. Fig 2.shows the 33 zones of AVKUDA. The Second step building the road network. By taking one level low road category network is created. Links are identified by ID, name of road, Physical capacity by inventory survey.
Fig.2. zoning of study area Fig.3 Road network with centroid connector in AVKUDA
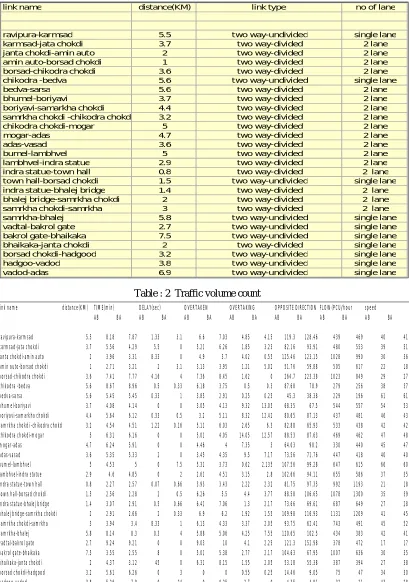
The road network with centroid connector are shown in fig.3 centroid connector. The trip to access the road network uses centroid connector. Table 1 shows some selected network attributes.
B. Volume count survey(Moving car method)
Volume count survey is carried out using moving car method on working day from time to time. The average flow, journey time, speed and dealy of traffic on a road link are obtained. The data on link volume ,speed etc is given in table 2.
C. Seed Matrix
Technology (IJRASET)
[image:6.612.109.518.89.671.2]Table : 1 road attributes
Table : 2 Traffic volume count
The conversion of production and attraction to origins and destinations is based on an estimation of when the P-A trip depart and return. In a translation from a 24-hour P-A matrix to 24 hours O-D matrix
link name distance(KM) link type no of lane
ravipura-karmsad 5.5 two way-undivided single lane
karmsad-jata chokdi 3.7 two way-divided 2 lane
janta chokdi-amin auto 2 two way-divided 2 lane
amin auto-borsad chokdi 1 two way-divided 2 lane
borsad-chikodra chokdi 3.6 two way-divided 2 lane
chikodra -bedva 5.6 two way-undivided single lane
bedva-sarsa 5.6 two way-divided 2 lane
bhumel-boriyavi 3.7 two way-divided 2 lane
boriyavi-samarkha chokdi 4.4 two way-divided 2 lane
samrkha chokdi -chikodra chokdi 3.2 two way-divided 2 lane
chikodra chokdi-mogar 5 two way-divided 2 lane
mogar-adas 4.7 two way-divided 2 lane
adas-vasad 3.6 two way-divided 2 lane
bumel-lambhvel 5 two way-divided 2 lane
lambhvel-indra statue 2.9 two way-divided 2 lane
indra statue-town hall 0.8 two way-divided 2 lane
town hall-borsad chokdi 1.5 two way-undivided single lane
indra statue-bhalej bridge 1.4 two way-divided 2 lane
bhalej bridge-samrkha chokdi 2 two way-divided 2 lane
samrkha chokdi-samrkha 3 two way-divided 2 lane
samrkha-bhalej 5.8 two way-undivided single lane
vadtal-bakrol gate 2.7 two way-undivided single lane
bakrol gate-bhaikaka 7.5 two way-undivided single lane
bhaikaka-janta chokdi 2 two way-divided single lane
borsad chokdi-hadgood 3.2 two way-undivided single lane
hadgoo-vadod 3.8 two way-undivided single lane
vadod-adas 6.9 two way-undivided single lane
link name distance(KM) FLOW(PCU/hour
AB BA AB BA AB BA AB BA AB BA AB BA AB BA
ravipura-karmsad 5.5 8.18 7.87 1.33 3.1 6.6 7.03 4.85 4.15 119.3 128.46 439 469 40 41 karmsad-jata chokdi 3.7 5.56 4.29 5.5 0 5.21 6.26 1.85 3.23 82.16 93.91 480 553 39 51 janta chokdi-amin auto 2 3.96 3.31 8.33 0 4.9 3.7 4.02 0.55 125.46 123.15 1028 990 30 36 amin auto-borsad chokdi 1 2.71 3.21 2 3.1 3.13 3.95 1.21 5.02 51.76 59.88 505 617 22 18 borsad-chikodra chokdi 3.6 7.41 7.77 4.16 4 7.36 8.45 1.62 0 264.7 223.38 1023 849 29 27 chikodra -bedva 5.6 8.67 8.96 0.5 0.33 6.18 3.75 0.5 0.3 87.68 78.9 279 256 38 37
bedva-sarsa 5.6 5.45 5.45 0.33 1 3.85 2.91 0.25 0.25 45.3 38.38 229 196 61 61
bhumel-boriyavi 3.7 4.08 4.14 0 0 3.05 4.13 9.32 13.05 68.35 67.5 544 557 54 53
boriyavi-samarkha chokdi 4.4 5.64 6.12 0.33 0.5 3.2 5.11 8.32 12.42 80.65 87.13 437 481 46 43 samrkha chokdi -chikodra chokdi 3.2 4.54 4.51 1.22 0.16 5.11 6.03 2.65 6.3 82.88 65.93 533 438 42 42 chikodra chokdi-mogar 5 6.31 6.16 0 0 5.01 4.05 14.05 12.57 88.53 87.63 469 462 47 48
mogar-adas 4.7 6.24 5.91 0 0 4.46 4 7.35 3 64.03 90.2 330 440 45 47
adas-vasad 3.6 5.35 5.33 2 0 3.45 4.35 9.5 7.17 73.56 71.76 447 418 40 40
bumel-lambhvel 5 4.53 5 0 7.5 5.31 3.73 0.62 2.135 107.56 99.28 647 615 66 60
lambhvel-indra statue 2.9 4.6 4.85 0 2 2.61 4.51 3.15 2.8 102.66 94.11 655 586 37 35 indra statue-town hall 0.8 2.27 2.57 0.07 0.66 3.93 3.43 2.22 2.32 81.75 97.35 992 1193 21 18 town hall-borsad chokdi 1.5 2.56 2.28 2 0.5 6.26 5.5 4.4 3.77 88.58 106.65 1078 1300 35 39 indra statue-bhalej bridge 1.4 3.07 2.91 0.5 0.66 6.41 7.06 1.3 2.17 73.66 69.61 687 649 27 28 bhalej bridge-samrkha chokdi 2 2.91 2.66 2 0.33 6.9 6.2 1.92 1.55 109.98 116.93 1131 1209 41 45 samrkha chokdi-samrkha 3 3.94 3.4 8.33 1 6.13 4.33 3.37 2.05 93.75 62.41 743 491 45 52 samrkha-bhalej 5.8 8.14 8.3 0.3 4 5.88 5.06 4.25 7.55 120.65 102.5 434 383 42 41 vadtal-bakrol gate 2.7 9.24 9.21 0 0 9.03 10 4.1 2.25 121.3 152.98 378 472 17 17 bakrol gate-bhaikaka 7.5 3.55 2.55 8 0 5.01 5.38 2.77 2.17 104.63 67.95 1007 636 30 35 bhaikaka-janta chokdi 2 4.37 3.12 45 0 6.31 8.15 1.55 2.05 53.18 55.38 387 394 27 38
borsad chokdi-hadgood 3.2 5.61 6.26 0 3 0 0 0.55 0.25 14.46 9.05 75 47 34 30
hadgoo-vadod 3.8 5.26 7.9 0 24 0 0.25 2.7 0 4.35 4.91 32 21 43 28
vadod-adas 6.9 20 16 180 120 0 0 1.1 1.7 2.91 0.13 6 3 20 25
Technology (IJRASET)
Table : 3 estimate OD matrix
D. Traffic Assignment
Technology (IJRASET)
Fig.4 Traffic Assignment
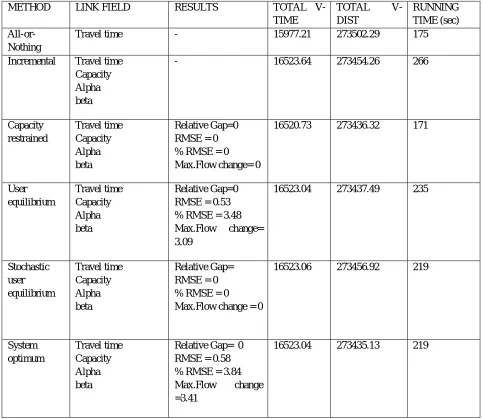
Table 4 Comparision f result by using different assignment method
METHOD LINK FIELD RESULTS TOTAL
V-TIME
TOTAL
V-DIST
RUNNING TIME (sec)
All-or-Nothing
Travel time - 15977.21 273502.29 175
Incremental Travel time
Capacity Alpha beta
- 16523.64 273454.26 266
Capacity restrained Travel time Capacity Alpha beta Relative Gap=0 RMSE = 0 % RMSE = 0 Max.Flow change= 0
16520.73 273436.32 171
User equilibrium Travel time Capacity Alpha beta Relative Gap=0 RMSE = 0.53 % RMSE = 3.48
Max.Flow change=
3.09
16523.04 273437.49 235
Stochastic user equilibrium Travel time Capacity Alpha beta Relative Gap= RMSE = 0 % RMSE = 0
Max.Flow change = 0
16523.06 273456.92 219
System optimum Travel time Capacity Alpha beta
Relative Gap= 0 RMSE = 0.58 % RMSE = 3.84
Max.Flow change
=3.41
[image:8.612.65.547.301.720.2]Technology (IJRASET)
E. Conclusion
The traffic assignment methods for small network gives similar result as in table .The RMSE values shows that the user equilibrium and system optimum are good for assignment.
REFERENCES
[1] Calliper, “Trans CAD Transportation Planning Software,”2011.accessed on www.capliper.com
[2] Der-Horng Lee, Qiang, Meng and Weng and weijjia Deng, “ Origin based Partial linearization method for the stochastic user equilibrium traffic assignment [3] Dr.L.B.Zala , Nirajkumar p. Mandowara(2013). “Traffic Assignment on Urban Road network : A case study of Anand Agglomeration.
[4] Dr. L.R. Kadiyali (2009). Traffic Engineering and Transportation Planning,Sevnth Edition, Khanna Publisher, New [5] Dr. Tom V. Mathew, “Transportation network Design.” NPTE
[6] Essam Almasri,Mohammed Al-Lazar (2013). “TransCAD and GIS Technique for estimating traffic demand and its application in Gaza city.”,Department of Civil Engineering,Islamic university of Gaza
[7] H.R. Varia, S.L. Dhigra (2004). “Dynamic user equilibrium traffic assignment on congested multi-destinatio network.”ASCE/marc
[8] Howard slavin,Paul Ricotta Jonathan Brandon Andres Rabinowicz, Srinivasan Sundaram “A new traffic assignment method for small and medium communities .”calliper corporation 1172 beacon st
[9] .Hillel bar Gera ,Amons Luvon (2007). “Differences among route flow solutions for the user_equilibrium traffic assignment problem.”ASCE/April [10] IRC: 106-1990 Guidelines for capacity of urban roads in plain areas, Indian Road Congress,New Delhi
[11] Krishna saw , B.K.Katti, Joshi, “Traffic Assignment : static and Dynamic.
[12] K.Nagel,G.Flotterod,(2009) “Agent-based traffic assignment :going from trips to behavioural travels.”
[13] Michel P.Dixon, L.R.Rilett (2005). “Population origin-destination estimation using automatic vehicles identification and volume data.”ASCE/February [14] .Seongkil, James E. Moore (2000).”Improved user equilibrium method for estimating trip table.
[15] Sheffi,Y.(1984). Urban Transportation network:equilibrium analysis with mathematical programming method,prentice-Hall,Englewood Cliffs, N.J [16] Young Jae lee and Vukan R. Vuchic (2005). “Transit network design with variable demand.”ASCE
[17] Zhong Zhou, Alberto Brignone and Michael Clarke Citilabs Inc. “Computational study of Alternative Methods For Static traffic Equilibrium Assignment.”