M E T H O D
Open Access
Multiplexed, targeted profiling of single-cell
proteomes and transcriptomes in a single
reaction
Alex S Genshaft
1,2,3,4†, Shuqiang Li
3†, Caroline J. Gallant
6, Spyros Darmanis
6,7, Sanjay M. Prakadan
1,2,3,4,
Carly G. K. Ziegler
1,3,4,8, Martin Lundberg
9, Simon Fredriksson
9, Joyce Hong
10, Aviv Regev
3,11,12, Kenneth J. Livak
5*,
Ulf Landegren
6and Alex K. Shalek
1,2,3,4,8*Abstract
We present a scalable, integrated strategy for coupled protein and RNA detection from single cells. Our approach leverages the DNA polymerase activity of reverse transcriptase to simultaneously perform proximity extension
assays and complementary DNA synthesis in the same reaction. Using the Fluidigm C1™system, we profile the
transcriptomic and proteomic response of a human breast adenocarcinoma cell line to a chemical perturbation, benchmarking against in situ hybridizations and immunofluorescence staining, as well as recombinant proteins, ERCC Spike-Ins, and population lysate dilutions. Through supervised and unsupervised analyses, we demonstrate synergies enabled by simultaneous measurement of single-cell protein and RNA abundances. Collectively, our generalizable approach highlights the potential for molecular metadata to inform highly-multiplexed single-cell analyses.
Keywords:Single-cell transcriptomics, Single-cell proteomics, Single-cell multi-omics, Proximity extension assay,
Metadata
Background
Recently, there has been an explosion of papers that utilize highly-multiplexed single-cell RNA profiling (through quantitative reverse transcription-polymerase chain reaction (qRT-PCR) [1, 2] or sequencing [3–9]) to investigate the extent, causes, and consequences of cellu-lar heterogeneity. Although incipient, this body of work has convincingly demonstrated that covariation in gene expression across single cells can be used to identify dis-tinct cell states and circuits, as well as their molecular markers and drivers, respectively [1, 2, 4–10]. In parallel, orthogonal studies have shown that endogenous protein levels and activity can vary dramatically between single cells [1, 11–14] with important functional consequences and predictive power [1, 11, 12, 14]. Nevertheless, a gene’s RNA and protein levels do not necessarily
correlate [15–18] and the long-standing question of how RNA expression patterns covary with and are driven by the levels and activities of various protein species re-mains underexplored [10, 15, 19, 20].
To date, given the limited number of RNAs and pro-teins that can be simultaneously assayed in situ and the noise associated with any one measurement [3, 10], the state-of-the-art has been to quantitatively record the levels of select cell surface proteins (index sort) during the fluorescence-activated cell sorting (FACS)-based isolation of single cells that normally precedes single-cell RNA pro-filing. This and related approaches can effectively link pre-cision single-cell protein measurements–and thus much of the scientific community’s accrued data and knowledge
– to high-dimensional single-cell RNA profiles, enabling deeper insights [1, 10, 21–24]. However, these techniques are fundamentally limited in both the number (ntotal~15 due to spectral overlap [10, 25]) and type of protein tar-gets (extracellular, since the fixation and permeabilization required for intracellular staining can degrade cellular RNA [26, 27]) they can assay.
* Correspondence:[email protected];[email protected]
†Equal contributors
5Fluidigm Corporation, South San Francisco, CA, USA
1Institute for Medical Engineering & Science, Massachusetts Institute of Technology, Cambridge, MA, USA
Full list of author information is available at the end of the article
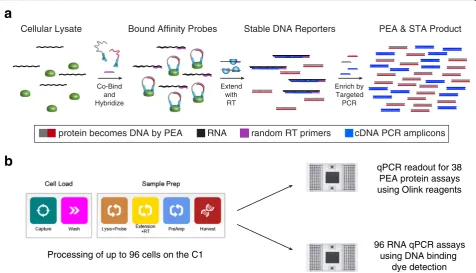
One potential way to address these shortcomings of scope and scale is to encode the abundance of both RNAs and proteins in DNA space using reverse tran-scription (RT) [2] and proximity extension assays (PEA) [28], respectively – this renders both analytes stable, amplifiable, and quantitatively detectable (Fig. 1). The latter method, PEA, is a continuation of the proximity ligation assay (PLA) [29] that relies on the binding of two antibodies in proximity to generate a DNA reporter with low background noise. In PEA, pairs of monoclo-nal or polyclomonoclo-nal antibodies are functiomonoclo-nalized with pairs of single-stranded DNA oligonucleotides with com-plementary 3’ends. When co-localized by binding to their target protein, these oligonucleotides hybridize and can be extended by a DNA polymerase to generate a protein-indexed DNA molecule. This DNA reporter can then be co-amplified with complementary DNA (cDNA) [2] and co-detected by qPCR or sequencing. Importantly, PEA has greatly enhanced detection specificity over assays that rely on single antibody binding, such as flow cytometry or immunofluorescence (IF), due to its reliance on dual rec-ognition by pairs of antibodies [30].
To date, this enhanced specificity has enabled multi-plexed detection of antigens in 1 μL plasma samples [28] and even single-cell lysates [31]. Indeed, we re-cently demonstrated single-cell resolution for PEA-based protein measurements in multiwell plates while
co-detecting RNA via qRT-PCR [31], echoing a previ-ous report on a small panel of DNA, protein, and RNA targets [32], and in line with recent work that used PLA and qRT-PCR in reverse-emulsion droplets to examine the levels of a single protein and RNA [33]. In these examples, cellular RNA and protein expression were simultaneously profiled by splitting the lysate from a single cell (in half, three unequal portions (20:40:40), or half, respectively).
Although significant first steps, these demonstrations suffered from a few major shortcomings, most notably: (1) material loss associated with sample transfer, which reduces sensitivity and increases technical noise [31, 32]; and, (2) complicated workflows that are technically chal-lenging to implement on multiple targets in a scalable, unified fashion, such as with an integrated fluidic circuit (IFC; like a C1 IFC [4, 21, 22]), reverse-emulsion drop-lets [7, 8], or microwells [34, 35]. As one potential alter-native, Frei et al. recently developed a proximity ligation assay for RNA (PLAYR) to couple both RNA and pro-tein quantification into a single mass cytometry readout [36]. While this enables rapid evaluation of RNA and protein across thousands of single cells, it is intrinsically limited by the number of heavy metal tags available.
To increase the number of probes and cells that can be simultaneously assayed, we have developed a new ex-perimental method to detect and quantify several RNAs
Processing of up to 96 cells on the C1
b
a
cDNA PCR amplicons
RNA random RT primers
protein becomes DNA by PEA
96 RNA qPCR assays using DNA binding
dye detection qPCR readout for 38
PEA protein assays using Olink reagents Extend
with RT
Enrich by Targeted PCR
PEA & STA Product Stable DNA Reporters
Bound Affinity Probes Cellular Lysate
Co-Bind and Hybridize
[image:2.595.60.537.421.694.2]and proteins from the same single cell in one reaction chamber. Our approach utilizes reverse transcriptase as the DNA polymerase for both RT of cellular RNA and extension of PEA oligonucleotides to enable cDNA syn-thesis and PEA to proceed in a single series of reactions (see“Methods”). We implement our integrated profiling protocol on the C1 system to examine single cells from a human breast adenocarcinoma cell line (MCF7 cells) treated with phorbol-12-myristate-13-acetate (PMA), and benchmark our coupled RNA and protein mea-surements against in situ hybridizations and IF staining, respectively, as well as recombinant proteins, ERCC Spike-Ins, and population lysate dilutions (see“Methods”). Through a series of supervised and unsupervised compu-tational analyses, we explore relationships between protein and RNA abundance. Overall, our method and coupled computational approaches provide a straightforward, scal-able strategy for simultaneously studying the expression of many proteins and RNAs in single cells that can be adapted to a number of experimental configurations.
Results and discussion
We sought to identify a means of integrating the PEA and cDNA synthesis workflows so that they could be performed in a single series of reactions. In examining both, we identified the possibility of coupling RT and PEA oligonucleotide extension into a single step by ei-ther reverse transcribing RNA with DNA polymerase or extending the hybridized DNA oligonucleotides in PEA with reverse transcriptase. Based on literature precedent [37], we devised a coupled PEA/specific (RNA) target amplification (STA) script for the C1 IFC that used the latter methodology. More specifically, our workflow is as follows (Fig. 1a): first, individual cells are isolated in the 96 capture sites of the C1 IFC. After washing, those cells are lysed with a buffer containing the PEA probes and incubated to achieve binding of the antibodies to their protein targets. Next, a DNA polymerization reaction is performed using reverse transcriptase to simultaneously extend the hybridized, complementary oligonucleotides conjugated to the PEA probes and reverse transcribe cel-lular RNA into cDNA using random primers. Import-antly, we omit a DNAse I treatment for removing unwanted genomic DNA (gDNA) since it could destroy the single-stranded or double-stranded oligonucleotides on the PEA probes (when not hybridized or hybridized to a complementary probe, respectively). Instead, to re-duce unwanted gDNA contamination, we designed our STA primers to span introns where possible (poly-dT priming could also be used), enabling RNA and gDNA to be differentiated via a melt-curve analysis of the qPCR product amplicons. After generating DNA reporters for protein and RNA abundance, multiplexed preamplifica-tion PCR is performed: for proteins, a universal primer
pair amplifies all molecules generated by the oligonucleo-tide extension reaction; for STA, a mix of gene-specific primer pairs amplifies target cDNAs. Following harvest from the C1 IFC, the stable, amplified DNA libraries can be analyzed by high-throughput qPCR (or sequencing) to quantify both protein and RNA targets (Fig. 1b).
In order to evaluate the performance of our adapted PEA/STA reaction on the C1 IFC, we first examined dilutions of recombinant proteins and cell population lysates. The PEA probes, developed by Olink Proteo-mics, are intended for analysis of plasma samples and generally target secreted proteins. In previous work [31], we extended the list of PEA assays to include several intracellular targets. From this joint list, we selected 38 for our current study (Additional file 1: Table S1). To calibrate the sensitivity of the selected assays, we backloaded a dilution series containing re-combinant protein targets for 25 of the 38 assays into the C1 IFC and processed it for PEA detection (see
“Methods” and Additional file 1: Table S2). For most of those 25, such as a recombinant AXIN1 (Fig. 2a), we observed a wide linear dynamic range spanning an average 8 ± 2 two-fold dilutions (mean ± standard de-viation; n= 23), suggesting effective PEA-based pro-tein detection on the C1 (Additional files 1 and 2: Table S3 and Figure S1).
(Additional file 1: Table S6 and S7), 89 showed linear re-sponses to backloaded MCF7 lysate dilutions about the single-cell level (Additional files 1 and 4: Table S5 and Figure S3a); we retained these and removed the others (Additional file 4: Figure S3b) for all subsequent analyses. We propose that similar population lysate dilution assays should be used to determine the reliability of untested PEA or qPCR probes.
To directly test the performance of our combined single-cell PEA/STA quantification protocol on single cells, we chose to study MCF7 cells stimulated with PMA. Selecting this system allowed us to examine how RNA and protein levels, and their evolution over time, relate to important cellular behaviors [12, 31], as PMA has been shown to activate protein kinase C signaling, inhibit cell growth, and induce apoptosis in this human breast adeno-carcinoma cell line [39]. Cells were exposed to PMA for 0 hr (untreated), 24 hr, or 48 hr. After, a single-cell sus-pension was loaded into a C1 IFC and processed accord-ing to the workflow depicted in Fig. 1 (see “Methods”). After culling cells that showed poor RNA expression (Additional file 1: Tables S8 and S9 and “Methods”), 87, 71, and 70 single cells remained for further analysis at the 0 hr, 24 hr, and 48 hr time points, respectively.
Before thoroughly analyzing our dataset, we first tested whether the patterns of heterogeneity we
observed across multiple single cells using the C1 were biologically representative. For four genes (MKI67, BIRC5, CASP8, and ICAM1), we measured single-cell protein and RNA expression in situ using IF staining and RNA-FISH (see “Methods;” characteristic images shown in Fig. 2b, Additional files 5, 6, and 7: Figures S4a, S5a, and S6a, respectively). Figure 2c, Additional files 5, 6, and 7: Figures S4b, S5b, and S6b depict the RNA (left column) and protein (right column) distributions determined via PEA/STA (top row) or and in situ (bottom row) detection. In general, we observe good qualitative agreement with incongruences that can be attributed to the greater sensitivity of the in situ detection methods. Quantile-Quantile (Q-Q) plots (Fig. 2d, Additional files 5, 6, and 7: Figures S4c, S5c, and S6c for MKI67, BIRC5, CASP8, and ICAM1, respectively) show that our STA detection threshold approaches 4, 16, 8, and 4 RNA molecules for MKI67, BIRC5, CASP8, and ICAM1, re-spectively (assuming perfect RNA detection efficiency with RNA-FISH), with deviations likely due to ineffi-ciencies in RT and subsequent PCR. We observed simi-lar or greater sensitivity for STA using backloaded ERCC RNA Spike-Ins at known concentrations (see
“Methods;” Additional file 1: Tables S4, S10, and S11, Additional file 8: Figure S7). Additionally, for BIRC5, CASP8, and ICAM1 RNA, the Q-Q plots show a vertical
a
b
c
d
[image:4.595.59.539.89.295.2]break between STA detected and undetected at or below theΔCtobserved for 1.3 cell equivalents in the correspond-ing population lysate dilutions (Additional file 4: Figure S3a), possibly driven by our choice of normalization or the detection limits of our qPCR assays (see“Methods”). Inter-estingly, at high expression, we observe a plateauing of MKI67 STA detection but not RNA-FISH. Overall, STA has a larger dynamic range, potentially due to RT and/or PCR inefficiencies which can lead STA to overestimate the actual number of RNA molecules by which two cells differ. Meanwhile, in our protein measurements, we observe a substantially higher detection threshold for PEA and a slightly larger dynamic range for IF. The former observation may be due to PEA’s dual detection requirement, which limits the contribution of non-specific primary antibody binding that can skew in situ methods like IF. Taken to-gether, these observations lead us to conclude that while in situ measurements are more sensitive than PEA/STA, the latter provides linear and highly multiplexable information on single-cell protein and RNA abundance.
We next examined the underlying structure of our dataset by performing a principal component analysis (PCA). PCA, using either the 27 proteins or 89 RNAs, distinguished PMA-treated from untreated cells, with protein providing clearer separation despite fewer targets evaluated (Additional file 9: Figure S8a, c, respectively). A random forest prediction algorithm (see “Methods”) supported this, yielding greater areas under the curve (AUC) for protein receiver operating characteristic (ROC) curves (0.98, 0.94, and 0.86 for protein versus 0.81, 0.80, and 0.57 for RNA at 0 hr, 24 hr, and 48 hr, re-spectively; Additional file 9: Figure S8b, d). Meanwhile, by using both protein and RNA data (Additional file 9: Figure S8e), we obtained AUCs of 0.99, 0.94, and 0.84 for the three time points, respectively (Additional file 9: Figure S8f ). This suggests that, in certain instances, pro-tein levels may be better biomarkers of environmental conditions [12], potentially due to either greater stability [16], a more direct role in cellular activity, or buffering from transcriptional noise [40] (also reflected in a lower average coefficient of variation (σ/μ); Additional file 10: Figure S9). This conclusion agrees with our previous results using split lysates in a different model system with a partially overlapping set of targets [31].
To explore the interrelationship between RNA and protein expression, we next investigated correlations among the 27 genes targeted with both RNA and protein assays. In single cells, the correlation between RNA and protein quantities can be strongly influenced (and decoupled) by the transient nature of eukaryotic tran-scription [41], temporal delays between trantran-scription and translation [3, 16, 19], differences in degradation rates [10, 15–17, 19], and technical noise [42]. For all RNA-protein pairs, we calculated Spearman correlation
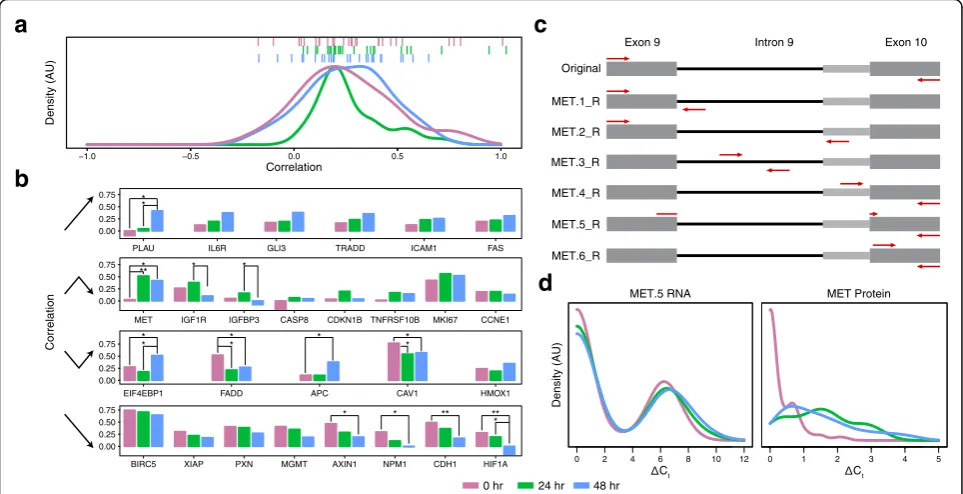
coefficients (ρ) at each time point (see “Methods”), obtaining an average (± standard deviation) correlation value of 0.25 (±0.23), 0.27 (±0.16), and 0.25 (±0.20) for the 0 hr, 24 hr, and 48 hr treatment time points, respect-ively (Fig. 3a). Intriguingly, the distribution of correlation values appears to tighten immediately after stimulation and then relax (pvalues from F test for variance are 0.08 and 0.30 for the 0 to 24 hr and 24 to 48 hr transitions, respectively). This trend may reflect the fact that, prior to stimulation, cellular activity across the targets assayed is more influenced by the aforementioned factors, which again come to dominate after a directed response to PMA.
When we investigated the relationship between each target’s mean expression, variance, and correlation (Additional file 10: Figure S9), we generally observed that RNAs with medium to high expression across cells had higher correlations prior to stimulation. After, the largest correlations appeared in RNAs with small to medium means and high cell-cell variance –this could reflect correlated activation of RNA and protein in only a subset of cells (bimodality), echoing previous findings in induced systems [3]. When focusing on significant changes in correlation (see “Methods”) between time points, we see thatCAV1andFADDdecrease in correl-ation within 24 hr, while theMETcorrelation increases. If we focus instead on the shift between 0 and 48 hr, we see that correlations between AXIN1, CAV1, CDH1,
FADD, HIF1A, and NPM1 RNA and protein are
re-duced, while those forAPC,EIF4EBP1,MET, andPLAU increase. Finally, between 24 and 48 hr, HIF1A,IGF1R, and IGFBP3 RNA and protein decrease in correlation while EIF4EBP1 and PLAU increase (Fig. 3b). To bet-ter understand these PMA-induced shifts, we plotted the coefficients of variation for single-cell RNA and protein expression individually and found striking sta-bility (Additional file 10: Figure S9) despite substantial variability between time points in the level of RNA ex-pression among expressing cells and in the frequency of cells expressing a given protein (Additional files 11 and 12: Figures S10 and S11). Thus, even individual cel-lular perturbations can yield complex and heteroge-neous RNA and protein responses across single cells (Fig. 3a, b, Additional files 10, 11, and 12: Figures S9, S10, and S11).
re-analyzed them with new qPCR assays targeting add-itional sites contained within the original amplicons. For MET RNA, our preamplification primers were specific for exons 9 and 10, creating an amplicon that potentially spanned intron 9. Figure 3c shows this portion of the METgene and the six assays we designed and deployed to interrogate the two isoforms previously known to exist in this segment of the MET transcript, as well as the unspliced transcript (primer sequences provided in Additional file 1: Table S7, all of which were determined to be quantitative from population dilution experiments except MET.2_R). Using a combination of the ΔCt values and correlations between the various MET STA assays and MET_P (Additional file 13: Figure S12), we determined that the change in correlation between pro-tein and RNA levels was primarily due to MET.5_R (short isoform, spliced) and MET.6_R (exon 10).
The distribution of different splice forms is evident in the scatterplot of MET.3_R (unspliced) versus MET.5_R (spliced) shown in Additional file 14: Figure S13. Across all three time points, a higher density of cells had only MET.3_R transcript (x-axis) than only MET.5_R
transcript (y-axis), and an intermediate number of cells had both forms. Interestingly, the statistically significant increase in the proportion of cells with MET.3_R tran-script at 24 hr (Fisher’s exact test p values = 0.0056 and 0.040 for comparing 24 h versus 0 and 48 hr, respectively) suggests that this transcript is actively being transcribed and processed during this time course. Still, because stop codons exist in the unspliced reading frame of intron 9, only the spliced forms of the MET transcript can be trans-lated into MET protein (N.B. we assume that the MET PEA measurement, which relies on a polyclonal raised against the short MET isoform, primarily reflects the short isoform’s abundance, although further experiments will be needed to examine the sensitivity of the antibody for the long isoform and its contribution to the results).
Figure 3d shows the distributions of MET_P and MET.5_R (short isoform, spliced) for 0 hr, 24 hr, and 48 hr. For the protein, frequency of detection increased with PMA treatment (Benjamini–Hochberg (BH) ad-justed Fisher’s exactpvalue = 1.1 × 10⁻¹⁷; Mann–Whitney U test for increased expression levels was not conducted since less than 10 unstimulated cells had expression above
* **
c
a
b
d
Original
MET.1_R
MET.2_R
MET.3_R
MET.4_R
MET.6_R MET.5_R
Exon 9 Intron 9 Exon 10
MET.5 RNA MET Protein
0 2 4 6 8 10 12 0 1 2 3 4 5
0 hr 24 hr 48 hr
−1.0 −0.5 0.0 0.5 1.0
Correlation |
| |||| ||||| | ||| ||
|| ||| | | | | |
| |
| | ||| ||
| | | ||| |||| |||| ||| |
|| |
| | |||||||||| |||||| ||| |
| |
Density (AU)
Density (AU)
Ct Ct
0.00 0.25 0.50 0.75
Correlation
APC HMOX1
EIF4EBP1 FADD CAV1
0.00 0.25 0.50 0.75
PXN
BIRC5 XIAP MGMT AXIN1 NPM1 CDH1 HIF1A
0.00 0.25 0.50 0.75
MET IGF1R IGFBP3 CASP8 CDKN1B TNFRSF10B MKI67 CCNE1
0.00 0.25 0.50 0.75
PLAU IL6R GLI3 TRADD ICAM1 FAS
*
*
* *
* *
* *
* *
*
* *
*
** **
Fig. 3Time dynamics of the correlations between RNA and protein abundance.aThe density of RNA:protein Spearman correlation coefficients (ρ) by time point, withticksdisplaying individual genes from the three time points (0 hr =purple, 24 hr =green, 48 hr =blue).bCategorized by temporal correlation pattern, the correlations of the same gene across time points are juxtaposed. *,pvalue < 0.05; **,pvalue < 0.01.c,d
[image:6.595.57.539.89.336.2]the limit of detection; Additional file 1: Table S12 provides differential expression for all targets between stimulated and unstimulated cells, while Additional file 1: Tables S13, S14, and S15 report targets differentially expressed be-tween time points). Meanwhile there is no statistically sig-nificant change in the expression of spliced transcript (BH adjusted Fisher’s exact and Mann–Whitney U test p values = 0.90 and 0.088, respectively). A potential parsimo-nious explanation for this observation is that MET protein abundance is translationally regulated, which would ac-count for the change in protein to RNA correlation from negligible to positive after PMA treatment. Intriguingly, putative control of MET protein levels by splicing (via skipping of exon 2) has previously been reported in many tissues [43]. This raises the question of whether the high proportion of single cells with only unspliced transcript observed in our study also reflects an aspect ofMET regu-lation. While further experiments are needed to explore this, our observation of potential translational control em-phasizes why, on these time scales and in this system, pro-tein may be a better reporter of biological state than RNA. Single-cell RNA expression profiling classically uses known protein biomarkers to pre-gate cells into subpopu-lations via FACS (and alternative methods) [1, 10, 21–23]. While this enables transcriptome-wide exploration of the differences between those discrete populations, each com-parison represents a separate experiment. Here, because we quantified the levels of several RNAs and proteins in each single cell, we were able to gate our cells in silico on every measured RNA and protein to test if and how each marker bifurcated our data within a single experiment (Additional file 1: Table S16 and Additional file 15: Figure S14 a, b). Moreover, this allowed us to reverse-gate our data by RNA, enabling us to determine the impact of RNA expression on a host of expressed proteins. In examining the METfamily, cells positive for the original MET_R STA assay (full length; Fig. 3c), not surprisingly, express MET.1_R (unspliced), MET.3_R (intron 9), and MET.4_R (long isoform and unspliced) at a higher fre-quency and MET.1_R, MET.3_R, MET.4_R, and MET.6_R (exon10) at higher levels. Additionally, dividing the data on MET_P detection shows that a MET_P expressing cell is more likely to have elevated expression of MET_R and MET.5_R (short isoform and spliced RNA), along with more frequent detection of MET.4_R and MET.6_R; reciprocally, MET.5_R expressing cells show elevated MET_P, MET.6_R, and MET_R. Here, the smallerpvalues associated with MET.5_R predicting MET_P suggests that, under certain conditions, RNA expression can be a better indicator of protein abundance than vice versa.
In addition to in silico gating, our data enabled di-rected questions of how the levels of upstream protein regulators and downstream RNA targets covary within known pathways. Of particular interest, given its role in
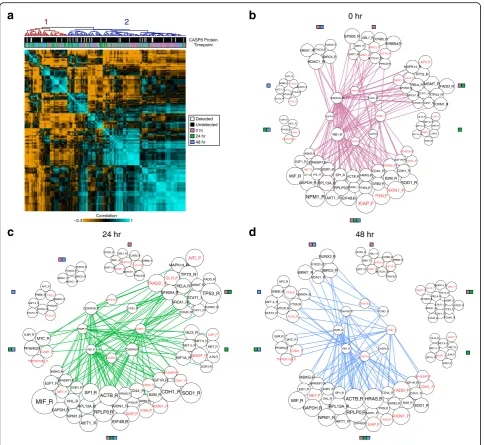
apoptosis, isCASP8, a member of the caspase family. A survey of the literature revealed that CCNE1,CDKN1B, EGFR, and RB1, all profiled here, are downstream tar-gets ofCASP8[44–46]. A differential expression analysis after in silico gating on CASP8_P abundance showed a statistically significant decrease in the frequency of CDKN1B_P detection and elevated levels of RB1_R. When we examined the correlation structure of these downstream targets along with CASP8_R levels, we did not see statistically significant separation between cells in which CASP8_P is detected (white) and those in which it is not (black) (Fig. 4a, cluster membership 1 versus 2 denoted by red and blue labels, respectively, p value = 0.67, Fisher’s exact test). However, by over-laying time point metadata onto the clusters, we ob-served that cluster 2 is significantly enriched for unperturbed cells (p value = 0.00012, Fisher’s exact test). By growing a correlation network from this seed set of RNA and protein probes (see “Methods”), we were also able to observe stimulation-induced changes in the seed network’s members (e.g. edge degree = 0 at 0 hr but edge degree≥1 over the 24 or 48 hr networks). This included cell cycle controllers (MYC_R, APC_R, PTEN_R, MTOR_R) and links to alternative modes of intracellular and intercellular regulation, such as cell surface (IL6R_R, IL6R_P, TNFRSF10B_P, ICAM1_P) and downstream signaling molecules (STAT3_R, SMAD4_R, PPARG_R) (Fig. 4b–d).
To better understand patterns in the genes correlated to the CASP8circuit, we conducted an unbiased functional analysis of enriched gene ontologies using the Database for Annotation, Visualization and Integrated Discovery (DAVID) [47] (see“Methods”). When analyzing genes that only correlate to the CASP8 seed network in untreated cells, we observed an enrichment for annotations associ-ated with cell division, cell cycle, and chromosome organization (BH adjusted p values < 10−10). Examining targets only correlated at 24 hr after PMA stimulation, we observe enrichments for DNA binding and transcription regulation (BH adjustedpvalues < 10−10), highlighting the cell state changes induced by PMA stimulation. Finally, when we examine genes only correlated to theCASP8 cir-cuit at 48 hr, we observe enrichments for cancer pathways (BH adjusted pvalues < 10−7), consistent with the breast adenocarcinoma origins of MCF7 cells.
[22]. Looking at Additional file 15: Figure S14c, we can see that ESR1_R levels correlate with separation in the protein-level PCA; considering the stimulation status of the cells (Additional file 9: Figure S8), this suggests that ESR1_R levels decrease with stimulation. A similar plot over RNA shows that AXIN1_P (Additional file 15: Figure S14d), meanwhile, correlates strongly with RNA PC1, independent of PMA, suggesting involvement in a stimulation-independent axis of variation. Although the clusters representative of stimulation condition are not
well resolved in the RNA PCA, we envision that a similar analyses performed on PCAs showing greater separation will help guide hypothesis generation and follow-up experimentation in future studies [3, 4].
Conclusions
We have presented a new method for simultaneously quantifying several proteins and RNAs from the same single cell in a single series of reactions, which we have validated with select in situ hybridization and IF
24 hr 48 hr
a
b
c
d
CASP8 Protein Timepoint −0.3 1 Correlation 1 2 0 hr 24 hr 48 hr Detected Undetected IGF1R_R B2M_R PXN_P EIF4EBP1_P CDH1_R TP73_R APC_P GLI3_P ERBB4_R MET.5_R JUN_R ESR1_R CDH1_P MGMT_P MET_R GLI3_R HIF1A_R MET.6_R SOD1_R IL6R_P RELA_R FADD_R CHUK_R NFKBIA_R CAV1_RFOXM1_R STAT1_R MGMT_R TP53_R BRCA1_R PXN_R CD44_R RPLP0_R XIAP_P AKT1_R EIF4B_R AXIN1_R HRAS_R SP1_R ACTB_R MIF_R NPM1_R MET_P VHL_R GAPDH_R EGR1_R IKBKG_R E2F1_R IL6R_R ICAM1_P MYC_R PPARG_R TNFRSF10B_P MET.4_R MTOR_R STAT3_R FAS_P APC_R PTEN_R SMAD4_R ERBB2_R PLAU_P RB1_R CDKN1B_R CASP8_P CCNE1_P CCNE1_R CDKN1B_P CASP8_R EGFR_R FOXO3_R RUNX2_R MKI67_R BIRC5_R BIRC5_P NPM1_P EP300_R PRKCE_R SIRT1_R NOTCH1_R BMI1_R ABL1_R CCNB2_R IGF1R_P MAPK14_R TRADD_P FADD_P GRB2_R AXIN1_P RPL13A_R EIF4EBP1_R HDAC1_R MET.4_R PLAU_P APC_R FAS_P ERBB2_R PTEN_R MTOR_R SMAD4_R STAT3_R MYC_R IL6R_R EP300_R NPM1_P SIRT1_R CCNB2_R ERBB4_R BMI1_R ABL1_R NOTCH1_R BIRC5_P PRKCE_R IGF1R_P FOXO3_R HDAC1_R BIRC5_R RUNX2_R MKI67_R IL6R_P GLI3_R FOXM1_R TP53_R CHUK_R BRCA1_R MGMT_R RELA_R NFKBIA_R STAT1_R TP73_R TRADD_P APC_P FADD_R GLI3_P CDKN1B_P CDKN1B_R CCNE1_R EGFR_R CCNE1_P VHL_R EGR1_R AKT1_R SP1_R NPM1_R RB1_R AXIN1_R CASP8_P EIF4B_R RPLP0_R CASP8_R PXN_R HRAS_R XIAP_P ACTB_R IKBKG_R MET_P E2F1_R GAPDH_R EIF4EBP1_R MIF_R PPARG_R ICAM1_P TNFRSF10B_P MET_R HIF1A_R JUN_R MET.5_R MGMT_P MET.6_R ESR1_R PXN_P B2M_R CDH1_P AXIN1_P IGF1R_R FADD_P SOD1_R CDH1_R GRB2_R EIF4EBP1_P CD44_R RPL13A_R CAV1_R MAPK14_R 0 hr MET_P E2F1_R MIF_R IKBKG_R EGR1_R EIF4EBP1_R AKT1_R NPM1_R VHL_R TNFRSF10B_P IL6R_R ICAM1_P PPARG_R MYC_R RB1_R CDKN1B_R CDKN1B_P CASP8_P EGFR_R SIRT1_R BMI1_R NPM1_P EP300_RABL1_R PLAU_P PTEN_R FAS_P APC_R SMAD4_R MTOR_R STAT3_R RUNX2_R FOXO3_R HDAC1_R MKI67_R BIRC5_R HRAS_R PXN_R SP1_R XIAP_P EIF4B_R AXIN1_R RPLP0_R ACTB_R PRKCE_R IGF1R_P ERBB4_R NOTCH1_R CCNE1_R CCNB2_R BIRC5_P FADD_R STAT1_R MGMT_R TP53_R FOXM1_R CHUK_R BRCA1_R GLI3_R MET_R JUN_R ESR1_R IL6R_P MGMT_P CCNE1_P HIF1A_R MET.5_R CASP8_R CD44_R FADD_P SOD1_R B2M_R PXN_P CDH1_P GRB2_R IGF1R_R AXIN1_P CDH1_R EIF4EBP1_P TP73_R GLI3_P RELA_R APC_P MAPK14_R TRADD_P NFKBIA_R CAV1_R MET.6_R RPL13A_R GAPDH_R ERBB2_R MET.4_R [image:8.595.57.542.86.531.2]experiments, as well as recombinant protein, bulk cell lysate, and ERCC Spike-In dilutions. Our integrated, single-chamber approach–which can be executed in an IFC – yields a highly multiplexed, coupled protein and RNA dataset that allows examination of the correlations and ties between several proteins and RNAs in mamma-lian cells. Here, we have used this workflow to study how these correlations and their expression underpin-nings evolve over time in MCF7 cells under PMA per-turbation. Moreover, since the unique dataset obtained via our generalized approach enabled many in silico ex-periments from a single in vitro experiment, we were able to discern how the levels of specific proteins and RNAs impact the expression of all other measured tar-gets, saving time and money compared to conventional approaches [3–8, 10, 21–24].
Overall, our methodology yields cellular protein-level metadata that can be used to better interpret and anno-tate the results of unsupervised RNA analyses. Indeed, much of the excitement regarding single-cell genomic approaches, such as single-cell RNA-Seq [3–9, 21–24, 34], stems from their ability to help identify cell types, states, and circuits in a genome-wide manner. While pu-tative biomarkers and drivers of these behaviors can be found by differential expression and gene set enrichment analyses, establishing the utility of these factors as bio-markers–e.g. if RNA X is differentially expressed between two subpopulations, will protein X also separate them?– requires follow-up labeling and/or perturbation experi-ments [3–8, 10, 21–24]. By conducting these experiments simultaneously, we have removed this roadblock. This could dramatically accelerate the discovery cycle, given complications associated with visualizing several RNAs in live cells [48], working with fixed cells [26], and the dis-connect between RNA and protein levels [10, 15–17].
From an experimental perspective, current methods for sensitive detection of proteins in single cells require affin-ity reagents, such as the antibodies used here. Although our investigation analyzed 27 proteins, assaying a larger number per single cell is limited only by the availability and functionalization of high affinity antibodies. Further, the development of new or different protein-binding re-agents (e.g. aptamers [29], nanobodies [49]), as well as the incorporation of established PEA-based methods for prob-ing post-translational modifications and protein com-plexes [50], should further boost the power and promise of our approach. Ultimately, we envision that each of our analyses, performed using the method outlined here or variants that include immuno-PCR [51], single-cell RNA-Seq [3, 4, 10], or measurements of other cellular variables [10, 52, 53], will enable identification of biologically mean-ingful differences between cells and their molecular markers, generating unprecedented insights into the drivers of cellular heterogeneity.
Methods
Cell culture and drug treatment
Low-passage number human breast adenocarcinoma cell line MCF7 cells were maintained in high glucose Dulbecco’s Modified Eagle Medium supplemented with 10 % fetal bovine serum and incubated at 37 °C in a 5 % CO2atmosphere. For PMA treatment, 3 mL of cell cul-ture was seeded into each well of a 6-well plate at a density of 5 × 10⁴cells/mL and the cells were allowed to settle. Subsequently, PMA was added to each of the wells at a final concentration of 1 μM for the treated cells and, after mixing, the multiwell plates were placed in the incubator for 24 hr or 48 hr. At time points 0 hr, 24 hr, and 48 hr post culture, cells were trypsinized, pel-leted, and run on the C1 using a custom PEA/STA protocol.
RNA fluorescence in situ hybridization (RNA-FISH) and protein IF staining experiments were performed as previously described [3]. Briefly, 5 × 10³ cells were seeded into the interior wells of a black, imaging-grade glass-bottom 96-well plate and allowed to settle. Import-antly, before adding cells, each well was cleaned with ethanol, treated with 100μL of 0.01 % poly-L-lysine for 1 hr at 37 °C, washed, and dried overnight in a biosafety cabinet. After seeding cells, PMA was added to the wells at a final concentration of 1μM for the treated 24 hr or 48 hr conditions and 0μM for the 0 hr (untreated) con-dition. Prior to fixation, the culture media was replaced with 100 μL of Hanks’ Balanced Salt Solution supple-mented with 1 mg/mL Wheat Germ Agglutinin 350 (WGA, Life Technologies, Thermo Fisher Scientific) for a 10 min incubation at 37 °C. The cells were then washed twice with phosphate buffered saline (PBS), fixed with 4 % formaldehyde in PBS at room temperature for 30 min, washed three times with PBS, and used for FISH and IF staining as described below.
Selecting PEA/STA probes
range used for the linear fit was found by evaluating every continuous range and picking the best R2value with a cost of 0.03 for removing points, followed by manually extend-ing or shortenextend-ing the range where needed. Certain assays (e.g. EIF4EBP1_P) display a“hook”effect, which is evident when the concentration of target protein exceeds a thresh-old such that PEA probes occupy separate target mole-cules as opposed to the same one [38]. This reduction in the frequency of co-incidence binding events results in fewer DNA reporter molecules and thus a loss of signal. Probes in Additional file 3: Figure S2b were labeled un-reliable and removed from later analysis due to either insensitivity, saturation, and/or failure to exceed the limit of detection within the physiological range (around 1.3 cell equivalents).
The results of this population lysate dilution experi-ment (see below) were corroborated with standard curves generated using 25 diluted recombinant proteins (Additional file 1: Table S3 and Additional file 2: Figure S1). Here, two probes (also filtered out by the above population lysate dilution experiments) did not display any signal (CSF3R_P and TP53_P, Additional file 2: Figure S1b) and thus were removed from all subsequent analyses.
In the same vein, a population lysate dilution experi-ment was designed to validate our STA probes (Additional file 1: Table S5 and Additional file 4: Figure S3). Probes that did not have a linear detection range or were not sensitive (Additional file 4: Figure S3b) were removed from later analysis.
Recombinant protein and ERCC assay
Recombinant proteins (listed in Additional file 1: Table S2) were dissolved in a mixture of PBS and 1× C1 loading reagent. Serial dilutions of each protein were made using 1× C1 reagent in PBS. The only differences between this C1 run and the PEA/STA protocol for single cells was that the serially diluted proteins were backloaded into the C1 IFC using the outlet ports and cell wash buffer was loaded into the cell inlet instead of a single-cell suspension culture. ΔCt for these samples (n= 8 for each dilution; Additional file 1: Table S3) was calculated in reference to wells with only lysis buffer (n= 8) and error bars are sup-plied plotted ± standard error of the mean (SEM).
Using the lysis buffer controls, we determined the mean and standard deviation of background for each target. These values enabled us to assign probabilities to detection. We defined our limit of detection as the few-est number of molecules which were detected at a confi-dence of greater than 0.01 in seven of the eight replicate measurements. Our limits of detection are presented as Additional file 1: Table S4 for recombinant proteins and ERCC Spike-Ins (described below). Detection is defined as a Ctvalue that has a probably less than 0.01 of being background noise.
ERCC Spike-Ins (ERCC RNA Spike-In Mix 1, Thermo Fisher Scientific 4456740) were also diluted in a mixture of PBS and 1× C1 loading reagent. Serial dilutions of the ERCCs were made using 1× C1 reagent in PBS. As with the recombinant proteins, the serially diluted ERCCs were backloaded into the C1 IFC using the outlet ports and cell wash buffer was loaded into the cell inlet in-stead of cell culture. ΔCt for these samples (n= 8 for each dilution) was calculated in reference to wells with only lysis buffer (n= 8) or to a threshold Ctof 24 if un-detected in lysis buffer alone, and error bars are supplied plotted ± standard error of the mean (SEM; Additional file 1: Table S11 and Additional file 8: Figure S7). Detec-tion and limit of detecDetec-tion for each ERCC was also calcu-lated as above for the recombinant proteins (Additional file 1: Table S4).
Single-cell PEA/STA processing in C1 system
Cell processing and preparation for single-cell capture in the C1 were performed according to the manufac-turer’s instructions (Fluidigm Corporation). The PEA/ STA protocol for the analysis of single cells was imple-mented using the Script Builder™ feature of the C1 system. In particular, after capturing single cells in the C1 IFC, lysis of captured cells was performed in a lysis mix containing 1× lysis buffer (0.5 % NP-40, 50 mM Tris–HCl, pH 8.4, 1 mM EDTA), 8 % incubation solution (Olink Proteomics), 7.6 % incubation stabilizer (Olink Proteomics), 0.05 nM each PEA probe, and 1× C1 loading reagent (Fluidigm 100–5170). The lysis conditions were 37 °C for 120 min and 10 °C for 1 min. After lysis, a com-bined reverse transcriptase and PEA probe extension reac-tion was performed in a mix containing 1× RT master mix (Fluidigm 100–6299) and 1× C1 loading reagent using the conditions 42 °C for 60 min, 85 °C for 5 min, and 10 °C for 1 min. PCR was then performed in PCR mix con-taining 1× PreAmp Master Mix (Fluidigm Corporation, 100–5581), 50 nM of each preamplification primer, 0.1× PEA solution (Olink Proteomics), and 1× C1 load-ing reagent. The conditions for PCR were 95 °C for 5 min, 20 cycles of 96 °C for 20 s and 60 °C for 6 min, followed by 10 °C for 1 min. After harvesting from the C1, RNA expression was determined on the Biomark HD system using 2× Sso Fast EvaGreen Supermix with Low ROX (Bio-Rad 172–5212) and the script 96.96 Fast PCR + Melt.v2.pcl. The expression of proteins was determined with the Olink Proteomics assay setup and OLINK.pcl script on the Biomark HD system.
RNA-FISH and protein IF staining
with Protease QS to keep the proteome intact for sub-sequent IF staining. Second, in order to stop the proto-col, after hybridizing probes (BIRC5type 1, VA1-11137,
CASP8 type 1 VA1-12315-06, ICAM1 type 1
VA1-12360-06, and MKI67 type 1, VA1-11033, Affymetrix, Inc.), cells were washed 3× with FISH Wash Buffer (described in the QuantiGene ViewRNA ISH Cell Assay protocol) and stored in 6× Saline-Sodium Citrate buffer overnight at 4 °C. The following morning, cells were washed 2× with FISH Wash Buffer and the protocol was resumed. After hybridizing label probes, the cells were washed 3× with RNA-FISH Wash Buffer and 2× with PBS before incubating them for 1 hr at room temperature with a Block & Permeabilize Buffer (3 % IgG-Free Bovine Serum Albumin (BSA, Jackson Immu-noResearch), 0.2 % Triton-X 100 in PBS). The cells were then transferred to a primary staining solution of Block & Permeabilize Buffer supplemented with 4 μg/ mL primary antibody (BIRC5: NB500-201, Novus Bio-logicals; CASP8: AF705, R&D Systems;ICAM1: AF720, R&D Systems;MKI67: ab15580, Abcam, Inc.) and incu-bated at 4 °C overnight. The following morning, cells were washed 3× in IF Wash Buffer (0.5 % BSA, 0.05 % Triton-X 100 in PBS) and developed in a secondary antibody staining solution containing Block & Permeabilize Buffer + 4μg/mL secondary antibody (Alexa Fluor 488 goat anti-rabbit IgGH + L, A11034; Alexa Fluor 488 Donkey Anti-Sheep IgGH + L, A-11015; Alexa Fluor 488 Donkey Anti-Goat IgGH + L, A-11055, Thermo Fisher Scientific) at room temperature for 1 hr. Cells were then washed 2× in PBS and stained with DAPI (Affymetrix, Inc.; per the manufacturer’s recommendations) on a rocker for 1 min and imaged on an Olympus IX83 inverted micro-scope using the following excitation wavelengths: 405 nm
– WGA and DAPI stains; 488 nm – secondary anti-bodies for IF; and 546 nm – type 1 FISH probes. Fi-nally, to quantify RNA expression or total protein level, the images were processed using a custom Matlab script as previously reported [3]. The number of cells quantified at 0 hr, 24 hr, and 48 hr after treatment, respectively, for each experiment were: BIRC5 – 1142, 1386, and 921 cells; CASP8 – 5757, 3724, and 2066 cells; ICAM1 – 5679, 2097, and 1548 cells; MKI67 – 1699, 836, and 378 cells. Both raw density plots and Q-Q plots were generated to con-firm qualitative agreement between in situ data gener-ated by IF and RNA-FISH and the qPCR data generated by PEA/STA, respectively.
Data analysis: PEA/STA and calculatingΔCt
The qPCR data for RNAs and proteins from the Bio-mark were analyzed by Fluidigm Real-time PCR analysis software using Linear (Derivative) Baseline Correction and Auto (Global) Ct Threshold Method. Exported Ct
values (Additional file 1: Table S8) were then converted toΔCtvalues (Additional file 1: Table S9). For RNA, this was done using the equation of 24 minus Ct[2]. If the value was negative or if the qPCR never passed thresh-old, then the result was assigned 0 for undetected. Indi-vidual cells were characterized by the number of RNAs detected, with a median value of 54 RNAs detected per cell (57.5 after culling cells, 55 after culling cells and re-moving unreliable STA targets (Additional file 4: Figure S3b)). If less than 35 RNAs were expressed in a given cell after removing unreliable STA targets, then that cell was culled from the dataset. For protein, back-ground was estimated from samples where no cell was captured in the C1, of which there were 5, 17, and 13 zero-cell samples at 0 hr, 24 hr, and 48 hr time points, respectively. Since there was no significant difference (by all time points pairwise T test) in the background Ct values when the time points were analyzed separ-ately, the average value for all 35 zero-cell samples was used as the background value for each PEA probe, with protein Ct values above 24 (including un-detected values of 999) set to a Ct of 24. Exported protein Ct values were then converted to ΔCt values using each protein's average background value minus Ct. If the resulting ΔCt value was negative, it was assigned to 0.
PCA and random forest classification
The culled data were used to conduct a PCA with the prcomp function in R, from which we observed separ-ation based on time point. Ellipses were scaled to 68 % of the probability, or 1 standard deviation from the time point’s centroid. For every PCA, each target was first standardized to ensure equal representation.
For the random forest classification, we supplied the randomForest function from the randomForest package in R with all of the principal component scores for the
“train” data, consisting of four-fifths of our samples ran-domly drawn with replacement. The model was then evaluated with the remaining one-fifth of the dataset to calculate sensitivities and specificities in a 1-vs.-Rest comparison, leveraging the prediction and performance functions from the ROCR package in R.
Correlation analysis
in variance from time point 0 to 24. Statistically signifi-cant changes in correlation were noted in the text and Fig. 3b if the delta correlation between any two time points had a probability less than 0.05 of being drawn from the null distribution. A null distribution was gener-ated for each gene by mixing the time point labels for each cell 10,000 times and calculating a null correlation mean and standard deviation. These mean and standard deviation were used to calculate pvalues using the nor-mal distribution. In Additional file 10: Figure S9, correla-tions are also shown as color values on plots of mean expression versus standard deviation. The dashed lines drawn on the plots indicate the standard deviation for a given mean if expression is only detected in 10 cells.
Trajectory analysis
Cells were binned into four quadrants for every gene measured for both protein and RNA depending on the detection of both targets using a probability of 0.01 as a cutoff. Relative proportions of cells with low protein and RNA, low protein and high RNA, high protein and high RNA, and high protein and low RNA were clustered to-gether for all genes with matched PEA/STA probes using a Spearman correlation. A distance metric of 0.75 was used to partition genes into similar clusters (Additional file 12: Figure S11, denoted by distinct colors). Representa-tive plots from each cluster illustrate the changing fraction of cells within each of these gates across time.
Differential expression and in silico gating
Prior to analyzing targets for differential expression, we examined our data to determine the most appropriate statistical test. Following precedent [4, 42], we attempted to fit our target expression distributions by perturbation time point to both a normal (two param-eter) and a three-parameter model (normal + fraction expressing). From this analysis, 22/92, 25/93, and 20/90 were fit with a normal distribution (pvalue > 0.01) and 54/68, 44/57, and 31/51 were fit with the three-parameter model (p value > 0.01) for 0 hr, 24 hr, and 48 hr, respectively. Since only approximately two-thirds of the models passed a Chi-squared goodness-of-fit test, we decided to conduct two tests: (1) a Fisher’s exact test to determine if the proportion of cells expressing a tar-get above the detection threshold was changing; and (2) a Mann–Whitney U test to determine if the distribution of expressing cells was changing significantly.
We then gated and bifurcated our data 116 times (the total number of quantitative targets measured by qPCR) based on detection of a given target and evalu-ated whether any of the remaining 115 targets were differentially represented in the two groups. Tests for difference in proportion (Fisher’s exact test) of cells expressing were conducted for every gate – target
combination if the number of cells for which the target was undetected exceeded ten for the two populations. Complementarily, tests for difference in distribution (Mann–Whitney U test) among expressing cells were conducted for every gate – target combination if the number of cells for which the target was detected exceeded ten for the two populations. BH correction was then applied for each in silico experiment to adjust for false discoveries.
Correlation network analysis
To determine the correlation network among our targets and observe how it changed following perturbation, we partitioned our data by time point and calculated Spear-man correlation (ρ) between the seed CASP8 network and every other target quantified. To determine a threshold for significant correlation, we generated a null distribution for each gene-gene pair by mixing the cell labels for each pair 10,000 times and calculating a null correlation mean and variance. From this analysis, the mean correlation for every gene-gene pair was less than 0.005 and the variance never exceeded 0.015. Based on those parameters, we calculated the threshold for 0.01 probability of being drawn from the background to be 0.29. Therefore, Spearman correlations over 0.3 were considered edges. We calculated edge-degree (the num-ber of edges shared with the CASP8 seed network) for each target for each network and sized the nodes ac-cording to this rank (Fig. 4). Lastly, we performed Gene Ontology enrichment using DAVID [47] across each set to assess the characteristics of the most strongly and sparsely regulated nodes and to test for the presence of expected connections.
Additional files
Additional file 1:Supplementary Table.Supplementary tables with legends in the first sheet called "Supplementary Table Legends". (XLSX 985 kb)
Additional file 2: Figure S1.Standard protein probe curves using recombinant proteins. Two-fold dilutions of recombinant proteins were backloaded into the C1 IFC and processed according to the PEA/STA protocol. Shown here are the PEA measurements, with they-axisvalues representingΔCtvalues from only lysis buffer.Gray(green)dashesshow the level above which the probability for a detection event being real is
p= 0.01 (0.05). Eachdata pointplotted is the average of eight separate capture sites in the C1 IFC witherror barsshowing the standard error of the mean. Points used for fitting theredtrend line are coloredblue. Most probes evaluated with recombinants worked well (a) with the exception of CSF3R_P and TP53_P (b), whose lack of detection was also seen in the protein lysate dilutions (Additional file 3: Figure S2). (PDF 315 kb)
Additional file 3: Figure S2.Standard protein probe curves using lysed and diluted MCF7 cells. Two-fold dilutions of population lysate were backloaded into the C1 IFC and processed according to the PEA/STA protocol. Shown here are the PEA measurements with they-axis
target molecules as opposed to the same one. This results in a reduction of signal due to a reduction in the number of proximal events. Eachdata pointplotted is the average of eight separate capture sites in the C1 IFC witherror barsshowing the standard error of the mean.Gray(green)
dashesshow the level above which the probability for a detection event being real isp= 0.01 (0.05). Points used for fitting theredtrend line are coloredblue, the background plot color indicates which treatment cells were taken from (0 hr =purple, 24 hr =green, 48 hr =blue). Probes are categorized as (a) usable or (b) unusable. (PDF 557 kb)
Additional file 4: Figure S3.Standard RNA probe curves using lysed and diluted MCF7 cells. Two-fold dilutions of population lysate were backloaded into the C1 IFC and processed according to the PEA/STA protocol. Shown here are the STA measurements with they-axisvalues representingΔCtvalues from lysis buffer alone or a threshold value of 24 if undetected in pure lysate. Certain assays (e.g. ACTB_R) display a“hook” effect, as seen in Additional files 2 and 3: Figures S1 and S2, potentially due to reagent saturation. Eachdata pointplotted is the average of eight separate capture sites in the C1 IFC witherror barsshowing the standard error of the mean.Gray(green)dashesshow the level above which the probability for a detection event being real isp= 0.01 (0.05). Points used for fitting theredtrend line are coloredblue, the background plot color indicates which treatment cells were taken from (0 hr =purple, 24 hr =green, 48 hr =blue). Genes are categorized as (a) usable or (b) unusable. (PDF 1087 kb)
Additional file 5: Figure S4.Additional benchmarking of a combined PEA/STA workflow:BIRC5.a–cValidation of protein and RNA detection in single cells using a coupled PEA/STA script on the C1 throughout a PMA perturbation time course (0 hr =purple, 24 hr =green, 48 hr =blue).
aRNA-FISH and IF staining ofBIRC5was performed to validate the C1-based, high-throughput RNA and protein measurements.Cyan(left) shows cell nuclei and boundaries,magentaBIRC5 protein (middle), and
yellowBIRC5 RNA (right). Scale bars indicate 25μm.bQualitative agreement between the protein and RNA data obtained in situ and on the C1. Density distributions (each with their own arbitrary units) for BIRC5 RNA (left) and protein (right) obtained via qPCR (top) or in situ (bottom) staining.cQ-Q plotsshowing the range over which the PEA/STA measurements ofBIRC5track linearly with IF staining or in situ
hybridization for the same. (PDF 79799 kb)
Additional file 6: Figure S5.Additional benchmarking of a combined PEA/STA workflow:CASP8.a–cValidation of protein and RNA detection in single cells using a coupled PEA/STA script on the C1 throughout a PMA perturbation time course (0 hr =purple, 24 hr =green, 48 hr =blue).a
RNA-FISH and IF staining ofCASP8was performed to validate the C1-based, high-throughput RNA and protein measurements.Cyan(left) shows cell nuclei and boundaries,magentaCASP8 protein (middle), and
yellowCASP8 RNA (right). Scale bars indicate 25μm.bQualitative agreement between the protein and RNA data obtained in situ and on the C1. Density distributions (each with their own arbitrary units) for CASP8 RNA (left) and protein (right) obtained via qPCR (top) or in situ (bottom) staining.cQ-Q plotsshowing the range over which the PEA/STA measurements ofCASP8track linearly with IF staining or in situ hybridization for the same. (PDF 124616 kb)
Additional file 7: Figure S6.Additional benchmarking of a combined PEA/STA workflow:ICAM1.a–cValidation of protein and RNA detection in single cells using a coupled PEA/STA script on the C1 throughout a PMA perturbation time course (0 hr =purple, 24 hr =green, 48 hr =blue).a
RNA-FISH and IF staining ofICAM1was performed to validate the C1-based, high-throughput RNA and protein measurements.Cyan(left) shows cell nuclei and boundaries,magentaICAM1 protein (middle), and
yellowICAM1 RNA (right). Scale bars indicate 25μm.bQualitative agreement between the protein and RNA data obtained in situ and on the C1. Density distributions (each with their own arbitrary units) for ICAM1 RNA (left) and protein (right) obtained via qPCR (top) or in situ (bottom) staining.cQ-Q plotsshowing the range over which the PEA/STA measurements ofICAM1track linearly with IF staining or in situ hybridization for the same. (PDF 107675 kb)
Additional file 8: Figure S7.Standard RNA probe curves using ERCC Spike-Ins. Two-fold dilutions of ERCC Spike-Ins were backloaded into the C1 IFC and processed according to the PEA/STA protocol. Shown here
are the STA measurements with they-axisvalues representingΔCtvalues from only lysis buffer or a threshold value of 24 if undetected in lysis buffer alone.Plotsare ordered by decreasing concentration in the ERCC mix with bad fits arising around ERCC 14 (which corresponds to ~121 molecules loaded into the top dilution, Additional file 1: Table S10 and S11). Eachdata pointplotted is the average of eight separate capture sites in the C1 IFC witherror barsshowing the standard error of the mean.Gray(green)dashesshow the level above which the probability for a detection event being real isp= 0.01 (0.05). Points used for fitting the
redtrend line are coloredblue. (PDF 1135 kb)
Additional file 9: Figure S8.PCA separation of the various time points (0 hr =purple, 24 hr =green, 48 hr =blue).aA PCA over all quantitative protein targets and the corresponding ROC curves (b) for all three time points generated from random forest decision categorization with AUC of 0.98, 0.94, and 0.86 for 0 hr, 24 hr, and 48 hr, respectively.cA PCA over all quantitative RNA targets and the corresponding ROC curves (d) for all three time points generated from random forest decision categorization with AUC of 0.81, 0.80, and 0.57 for 0 hr, 24 hr, and 48 hr, respectively.eA PCA over all quantitative protein and RNA targets and the corresponding ROC curves (f) for all three time points generated from random forest decision categorization with AUC of 0.99, 0.94, and 0.84 for 0 hr, 24 hr, and 48 hr, respectively. Fora,c,e, axis labels indicate which PC was used and what percent variance it explains. (PDF 269 kb)
Additional file 10: Figure S9.Coefficient of variation colored by correlation. Genes quantified as both RNA and protein are plotted based on their standard deviation (y-axis) and mean (x-axis) on theleftandright
hand sides, respectively. Theplotsin thetop,middle, andbottomrows are done at the 0 hr (purple), 24 hr (green), and 48 hr (blue) time points, respectively.Dashed linesfollow the standard deviation of a gene that has only ten cells with uniform expression and the remaining cells have undetectable levels (strong bimodality). (PDF 233 kb)
Additional file 11: Figure S10.Change in average, standard deviation, and frequency of expression. Density traces (each with their own arbitrary units) for change in mean, standard deviation, and frequency of expression are shown for genes quantified as both RNA (a) and protein (b). Each row depicts a time point transition (24–0 hr, 48–24 hr, 48–0 hr for thetop,middle, andbottomrows, respectively) for every gene with at least two cells above detection in every time point for both RNA and protein (19 genes). The ticks display individual measurements from each time point transition. (PDF 508 kb)
Additional file 12: Figure S11.Analyzing gene trajectories through a time course of PMA stimulation. Genes quantified as both RNA and protein were made binary for each value based on detection or lack thereof. The vector of the proportion of cells in the fourquadrantsof detected and undetected for RNA and protein across the three stimulation time points were clustered using Spearman correlation. Clusters are divided using a distance metric of 0.75; representative trajectories through time (depicted by color 0 hr =purple, 24 hr =green, 48 hr =blue) are shown for the genes evaluated in situ with thebottom left quadrantrepresenting undetected protein and undetected RNA, thebottom right quadrantrepresenting undetected protein and detected RNA, thetop left quadrantrepresenting detected protein and undetected RNA, and thetop right quadrant
representing detected protein and detected RNA. The size of thedots
corresponds to the fraction of cells in that quadrant. (PDF 179 kb)
Additional file 13: Figure S12.Correlation between protein and RNA:
MET. Presented are the correlations of the various MET STAs with MET protein (by PEA) across time points (0 hr =purple, 24 hr =green, 48 hr =
blue). We observe that the strong increase in correlation after stimulation is most noted in MET.5_R (spliced short isoform) and MET.6_R (exon 10), with the other STAs showing a modest increase in correlation at 24 hr that becomes negative by 48 hr. (PDF 122 kb)
Additional file 14: Figure S13.Spliced vs. unspliced MET transcript.
Scatterplotof MET.5_R (spliced, short isoform) vs. MET.3_R (unspliced) withdensity curvesplotted along the axes. Time point indicated by color: 0 hr =purple, 24 hr =green, 48 hr =blue. (PDF 227 kb)
expression gates (columns). Cooler colors indicate a decrease in expressing cells by a Fisher’s exact test (a) or the distribution of expressing cells by a Mann–Whitney U test (b) while warmer colors indicate the inverse.c,dIn addition to discrete gating, unsupervised analyses, such as a PCA over protein (c) or RNA levels (d), can also be annotated by additional cellular observations (RNA or protein data, respectively).cESR1_R expression shows a strong Spearman'sρof 0.60 with PC2 on a PCA computed from the protein expression.dAXIN1_P expression shows a strong negativeρof−0.68 with PC1 on a PCA computed over RNA expression. (PDF 964 kb)
Additional file 16: Figure S15.Analyzing population lysate dilution data. The Ctvalues observed for the two PEA standards: the extension control (a) and oligo reference (b). Across time points (0 hr =purple, 24 hr =green, 48 hr =blue) and cell dilutions, the deviations from the lysis buffer control are quite small except for the 42.5 and 21.25 cell equivalent dilutions (0.05 and 0.01 probability cutoffs from the background shown ingreenand gray, respectively). In these deviations are quite small except for the 42.5 and 21.25 cell equivalent dilutions. Therefore, those measurements are excluded from the dilution plots in Additional files 2, 3, and 4: Figures S1, S2, and S3. (PDF 143 kb)
Abbreviations
AUC:Area under the curve; BH: Benjamini–Hochberg; BSA: Bovine serum albumin; cDNA: complementary DNA; DAVID: Database for annotation, visualization and integrated discovery; FACS: Fluorescence-activated cell sorting; gDNA: genomic DNA; IF: Immunofluorescence; IFC: Integrated fluidic circuit; PBS: Phosphate buffered saline; PCA: Principal component analysis;
PEA: Proximity extension assay; PLA: Proximity ligation assay; PMA: Phorbol-12-myristate-13-acetate; Q-Q: quantile-quantile; qRT-PCR: Quantitative reverse transcription-polymerase chain reaction; RNA-FISH: RNA fluorescence in situ hybridization; ROC: Receiver operating characteristic; RT: Reverse transcription; STA: Specific (RNA) target amplification; WGA: Wheat Germ Agglutinin 350
Acknowledgements
We thank Nir Yosef, Michael Cole, Brian Cleary, Michal Radoslaw Grzadkowski, and Manolis Kellis for their helpful discussions. We thank Greg Harris of Fluidigm for his help with the design of the qPCR assays.
Funding
AKS was supported by the Searle Scholars Program, the Beckman Young Investigator Program, a NIH Center for Excellence in Genomic Sciences (P50HG006193, also to AR), Klarman Cell Observatory (also to AR), a NIH U24 (U24AI11862-01, also to AR) and a NIH New Innovator Award
(DP2OD020839). UL, CJG, and SD received support from the European Community’s 7th Framework Program (FP7/2007-2013) under grant agreement 259796 (DiaTools) (UL), the European Research Council under the European Union’s Seventh Framework Programme (FP/2007-2013)/ERC Grant Agreement 294409 (ProteinSeq) (UL), the Swedish Research Council (UL), the Inga Britt och Arne Lundbergs Forskningsstiftelse (UL), and the Swedish Society for Medical Research (SD, CJG). AR was also supported by the Howard Hughes Medical Institute. CGKZ was supported by award number T32GM007753 from the National Institute of General Medical Sciences. The content is solely the responsibility of the authors and does not necessarily represent the official views of the National Institute of General Medical Sciences or the National Institutes of Health.
Availability of data and materials
[image:14.595.305.537.366.737.2]We have included our culled single-cell PEA/STAΔCtdataset as Additional file 1: Table S9.ΔCtdata for the recombinant protein, population lysate, and ERCC Spike-In dilutions are also supplied as Additional file 1: Tables S3, S5, and S11 respectively. Finally, raw Ctvalues are provided in Additional file 1: Table S8.
Authors’contributions
AR, KJL, UL, and AKS conceived and oversaw the study. ASG, SL, CJG, SD, SMP, ML, SF, KJL, and AKS designed and conducted the experiments. ASG, SMP, CGKZ, JH, KJL, and AKS analyzed the data. ASG, SL, KJL, and AKS wrote the manuscript with feedback from all authors. All authors read and approved the final manuscript.
Competing interests
KJL is an employee of Fluidigm Corporation. ML and SF are employees of Olink Proteomics; SF and UL are founders and shareholders of Olink Proteomics.
Ethics approval and consent to participate
Ethics approval is not applicable for this study.
Author details
1Institute for Medical Engineering & Science, Massachusetts Institute of Technology, Cambridge, MA, USA.2Department of Chemistry, Massachusetts Institute of Technology, Cambridge, MA, USA.3Broad Institute of MIT and Harvard, Cambridge, MA, USA.4Ragon Institute of Massachusetts General Hospital, Massachusetts Institute of Technology, and Harvard University, Cambridge, MA, USA.5Fluidigm Corporation, South San Francisco, CA, USA. 6Department of Immunology, Genetics & Pathology and Science for Life Laboratory, Uppsala University, Uppsala, Sweden.7Departments of
Bioengineering and Applied Physics, Stanford University and Howard Hughes Medical Institute, Stanford, CA, USA.8Division of Health Sciences & Technology, Harvard University and Massachusetts Institute of Technology, Cambridge, MA, USA.9Olink Proteomics, Uppsala, Sweden.10Department of Electrical Engineering & Computer Science, Massachusetts Institute of Technology, Cambridge, MA, USA.11Department of Biology and Koch Institute, MIT, Boston, MA 02142, USA.12Howard Hughes Medical Institute, Chevy Chase, MD 20815, USA.
Received: 4 July 2016 Accepted: 11 August 2016
References
1. Dalerba P, Kalisky T, Sahoo D, Rajendran PS, Rothenberg ME, Leyrat AA, et al. Single-cell dissection of transcriptional heterogeneity in human colon tumors. Nat Biotechnol. 2011;29:1120–7.
2. Livak KJ, Wills QF, Tipping AJ, Datta K, Mittal R, Goldson AJ, et al. Methods for qPCR gene expression profiling applied to 1440 lymphoblastoid single cells. Methods. 2013;59:71–9.
3. Shalek AK, Satija R, Adiconis X, Gertner RS, Gaublomme JT, Raychowdhury R, et al. Single-cell transcriptomics reveals bimodality in expression and splicing in immune cells. Nature. 2013;498:236–40.
4. Shalek AK, Satija R, Shuga J, Trombetta JJ, Gennert D, Lu D, et al. Single-cell RNA-seq reveals dynamic paracrine control of cellular variation. Nature. 2014;510:363–9.
5. Zeisel A, Muñoz-Manchado AB, Codeluppi S, Lönnerberg P, La Manno G, Juréus A, et al. Cell types in the mouse cortex and hippocampus revealed by single-cell RNA-seq. Science. 2015;347:1138–42.
6. Treutlein B, Brownfield DG, Wu AR, Neff NF, Mantalas GL, Espinoza FH, et al. Reconstructing lineage hierarchies of the distal lung epithelium using single-cell RNA-seq. Nature. 2014;509:371–5.
7. Klein AM, Mazutis L, Akartuna I, Tallapragada N, Veres A, Li V, et al. Droplet barcoding for single-cell transcriptomics applied to embryonic stem cells. Cell. 2015;161:1187–201.
8. Macosko EZ, Basu A, Satija R, Nemesh J, Shekhar K, Goldman M, et al. Highly parallel genome-wide expression profiling of individual cells using nanoliter droplets. Cell. 2015;161:1202–14.
9. Fan HC, Fu GK, Fodor SPA. Combinatorial labeling of single cells for gene expression cytometry. Science. 2015;347:1258367.
10. Satija R, Shalek AK. Heterogeneity in immune responses: from populations to single cells. Trends Immunol. 2014;35:219–29.
11. Bendall SC, Simonds EF, Qiu P, Amir E-aD, Krutzik PO, Finck R, et al. Single-cell mass cytometry of differential immune and drug responses across a human hematopoietic continuum. Science. 2011;332:687–96.
12. Cohen AA, Geva-Zatorsky N, Eden E, Frenkel-Morgenstern M, Issaeva I, Sigal A, et al. Dynamic proteomics of individual cancer cells in response to a drug. Science. 2008;322:1511–6.
13. Feinerman O, Jentsch G, Tkach KE, Coward JW, Hathorn MM, Sneddon MW, et al. Single-cell quantification of IL-2 response by effector and regulatory T cells reveals critical plasticity in immune response. Mol Syst Biol. 2010;6:437.