Evolving from xSonify: a new digital platform for sonorization
Beatriz Garcia1,2, Wanda Diaz-Merced3, Johanna Casado1,4, and Angel Cancio1,5
1. Instituto de Tecnologías en Detección y Astropartículas, CNEA-CONICET-UNSAM, Mendoza, Argentina 2. Universidad Tecnológica Nacional, Faculty Mendoza, Argentina
3. IAU Office of Astronomy for Development, South African Astronomical Observatory, South Africa 4. Universidad de Mendoza, Mendoza, Argentina
5. Universidad Tecnológica Nacional, Faculty Buenos Aires, Argentina
International Symposium of Education in Astronomy and Astrobiology, Utrecht, July 3-7, 2017
Abstract. In general, Space Sciences data exploration is thought to be suitable for people who do not have Neurological Disorders (ND) that may impair reading (RI), and are not blind or visually impaired (BVI). Data exploration methods used in these fields are generally visual, and do not provide the accessibility to allow full participation of blind and visually impaired individuals in the field. This has been the case even after evidence that sound increases the sensitivity to events in data that would otherwise be undetected. A set of tools that guarantees a thoroughdata inspection, and assures the access to the same amount and quality of information to all, is useful for everyone.
The present project, devoted to design a new user centered software to produce audio-visual outputs from astrophysical data, integrates multidisciplinary and interdisciplinary astronomers, engineers, computer specialists, software designers, educators, disability specialists, bioengineers, neurobiologists, and sociologists, both blind and sighted, and addresses the topics of accessibility to astronomical data, The possibility of exploring the bibliographic databases (ADSABS, among others), creation of a new multimodal access prototype, creation of an accessible, user-centered (from back end to front end), human-computer interface suitable for collection, sonification and analysis of astrophysical data, and the efficiency, utility and effectiveness of the resource in different cultural environments and at different levels of expertise. In this contribution, we present the first results related to the creation and application of the techniques and tools proposed, taking into account that the focus of this research is on the knowledge in the field of physics and astrophysics, but can be scalable to other areas of human activity so that people with other learning styles can have "equal opportunities". Finally, this project is based on the premises of addressing the technical challenges in basic research to achieve the promised benefits of Big Data, which is of world-wide interest.
1. Introduction
1.1 - Accessibility to astronomical data, from observations made on Earth or with instruments on board satellites (available in databases / Simbad, NASA, ESA, etc.)
The Working Group on Accessibility and Disability (WGAD) of the American Astronomical Society released a report titled, “Journal Accessibility Recommendations” (Ritter et al. for the WGAD, 2016) that may be taken as a formal “signaling for accessibility”, prepared after the collection of accessibility suggestions with astronomy related observations and journals from the community of professional1astronomers. The document clearly stressed the importance and need of User Centered Design and Usability evaluations of the available tools and resources. Disabilities and/or learning styles should be considered when designing information technologies and systems. According to Ritter et al. (2016), many areas like Human Computer Interaction (HCI), User Experience (UX), User Centered Design (UCD), or Human Centered Systems Design (HCSD or UCSD, if the word User is employed instead of Human) are concerned about the goal of improving people's interaction with systems and computers. They differ only in the methods used to approach this goal that drives performance.
The field of Astronomy is mainly data dependent, and given the high computational costs of data management, and the increase in sampling rates and size, the current focus leans more towards lessening computational costs and improving data quality. The result is a non-UCD display of, and interaction with, functionalities. The term functionalities include, but is not limited to, the layout, input, processing and output methods of the system. This characteristic of systems in the Astronomy field (our case study), and according to WGAD, severs the links of the professional disabled astronomer with the field. The reader may like to consider as a possibility that currently, disabled astronomers “signaling for accessibility”
through the WGAD document at a level of expertise2, may be late onset disabilities. At this stage, this is impossible to determine, as the astronomy field lacks formal assessment methods for astronomers with disabilities. Regardless of this distinction, it is of utmost importance to create the tools needed to allow expert research performance by disabled individuals, whether late onset or congenital. At a different level of expertise, it is important for school and University level students with disabilities to be able to access the same amount and quality of information as their peers and succeed through the transitions through academic levels.
1.2 - Possibility of exploring the bibliographic and observation databases
The lack of existence of a formal work model and robust accessibility evaluations of bibliographical databases (ADSABS and SIMBAD, among others), given the needs of the astronomical community as applied to disabled individuals, has severely affected the development of data analysis and literature revision tools that may be used by the peoples disabled by the lack of those. As evidenced by Diaz-Merced (2013) it also impairs the ability of abled astronomers to access field related information (such as observations). No more than 20 papers exist about space science data visualization applied to its analysis (see for example: Hassan and Fluke, 2011; Hassan el al. 2013; Palomino, 2003; Federl, 2011; Leech and Jennes, 2005; Dubinski, 2008; Kapferer and Riser, 2008; Li, Fu and Hanson, 2008; Fluke, Barnes and Jones, 2009). It may be taken from these studies that, even when not literally established, human factors (HCI, UCD, UX etc.) must be considered for effective, useful and efficient data analysis in research on Astrophysics.
The “Journal Accessibility Recommendations” may serve as a starting point for database and data warehouse administrators to take into consideration the input of abled and disabled astronomers to achieve a sustainable user centered design. The current digital access design approaches are narrowly focused, and do not permit a wide diversity of perceptions, performance, and learning styles, and their possible subsequent discoveries.
According to several authors (Egan & Benyon, 2017; Knowles et al., 2016), the sustainability of digital systems depends on achieving HCI, UX, and UCD that will improve the quality of life and foster human fulfillment. The United Nations (UN) Human Development Report (UNHDR, 2015) approaches human fulfillment on the basis of access to work in “human development terms” and its sustainability. The report stresses: “the link between human development and work is not automatic” as the quality of work is an important dimension of ensuring that work enhances human development. It also mentions that “some work is very damaging to human development”, “which constitute serious violations of human rights. In many cases workers in such conditions face serious risks of abuse, insecurity and loss of freedom and autonomy" (UNHDR 2015). The lack of autonomy for individuals with disabilities means that they are forced onto a career path defined by potential obstacles, rather than based on their interests.
The UN report underlines the value of work for human development is least where there is observable discrimination, and stresses that this occurs the most along gender lines. It affirms that “The most observable discrimination is along gender lines—in positions, pay and treatment”. The reader must note that this refers only to differences among the employed.
There are no good data on peoples with disabilities and employment. The UN Division for Social Policy and Development Disability has a fact sheet attesting to the lack and difficulty of gathering data on disability issues, especially regarding work. This report released in 2007 is only a collection of anecdotal media references that may be used to have an idea of the predicament of peoples with disabilities at work. After a protracted search, it is not possible to find a more recent and formal recollection. According to this report, in developing countries 80% to 90% of persons with disabilities of working age are unemployed, whereas in industrialized countries the figure is between 50% and 70%. The reader may observe that these are mere numbers indicating nothing about the dignity of the work. It continues: “One critical human deprivation is not using, misusing or underusing the deep human potential of people for human development enhancing work” (UNHDR 2015). Dignifying work facilitates a sense of fulfillment, social interaction and empowerment. It allows people to use their skills, acquire and use new ones, increase their social network and strengthen their enterprising spirit. In the case of the field of astronomy, the skills of peoples with disabilities are highly under-used.
The UN Human Development Report of 2016 (UNHDR, 2015) states “Because some social groups (ethnic minorities, indigenous peoples, persons with disabilities) are systematically discriminated against and thereby left out, specific measures are needed so they may achieve equitable outcomes in human development.”. The report also states that “Despite the great diversity in identities and needs, marginalized groups such as ethnic minorities, indigenous peoples, persons with disabilities, people living with HIV and AIDS, and lesbian, gay, bisexual, trans-gender and inter-sex individuals often face similar constraints, such as discrimination, social stigma and risk of being harmed. But each group also has special needs that must be met if they are to benefit from progress in human development.”. The specific needs of scientists with disabilities is discipline dependent. It is not sufficient to provide accommodations but necessary to create the tools that encourage, support and promote maximum performance for each individual. Inclusion and accommodation are critical to empowering individuals to live independently, be employed and contribute to society. In a scientific field, to not addressing access to bibliographic and data resources for individuals with disabilities may be a violation of human rights. Equity and Equality to data access is not achieved.
2 Improving accessibility of astronomical publications:
http://sion.frm.utn.edu.ar/iau-inclusion/wp-content/uploads/2017/10/JournalAccess.V2.pdf
Even for abled astronomers there are challenges to data access. Some of the challenges are related to uncertainties imposed by the system architecture, for example, when the user must invest time to figure out if the software is using the data as it should, as well as unmet expectations, as for example the need of the improvement in the resolution of the data analysis, to explore the data before a filtering or transformation (Diaz-Merced, 2013).
The result is the design of well intentioned, but low fidelity prototypes that fail to achieve accessibility and sustainability. For instance, the visually disabled astronomer, regardless whether professional level, interested public, student or expert, does not have access to the same amount and quality of information as a sighted astronomer. Mathematics and Physics are also sciences that are taught uni-sensorially – assuming a sighted learner-- and there is very little research on how to teach using sensory modalities. The lack of text books and materials appropriate for people with visual disabilities to learn mathematics and science concepts in an efficient, useful and effective way, that does not rely on rote memorization, is an example of lack of access.
It is desirable that all people have the same exposure to mathematics and astronomy as abled individuals. If these individuals choose a Science Technology and Engineering (STEM) career, they will be prevented from full participation in classes, laboratories, and later, as professionals as the tools that meet the needs of astronomers with visual disabilities, such as multi-sensory perception and exploration styles are not existent.
Automated tools to audit access exist (e.g.: JAWS, NVDA, Orca) with many parameters for accessibility. It is easy to foresee companies seeking for the one that will provide the best results for their purposes.
It is then mandatory to design and perform formal assessments of what resources are available and what are needed at each stage of education (school, university) and at the professional level in astronomy for people with disabilities. This will facilitate the development of self-sustainable tools.
2. Accessibility Evaluation: ISO 9241-171:2008
An accessibility evaluation of three text-to-sound translation tools for the perusal and/or familiarization with numerical information was developed, based on the ISO 9241-171:2008 standard (Casado et al, 2017). ISO 9241-171:2008 (ISO, 2008) is a tool to perform a heuristic evaluation of accessibility. The objective of the standard is to provide guidelines for the design of interactive systems software in order to achieve the highest possible level of accessibility. This ISO guideline applies to the software of interactive systems used at home, in leisure activities, in public places and at work. The title of the standard is “Guidelines on software accessibility”, the author decided to use this guide to analyzed the accessibility of three sonification software and from the results start the design a new user centered software. The new program objective users are scientific researchers in the field of astrophysicist, with a range of impairments and disabilities. To target these users, it is very important to at least, for the design of the application to comply with such standards.
The three programs to be analyzed differ in the audience being targeted. MathTrax was developed for the teaching of mathematics/algebra to the visually impaired, Sonification Sandbox was designed for the exploration of numbers, and xSonify for the exploration of astronomy telemetry.
The Sonification Sandbox (Davison and Walker, 2007) is a sonification Java based program, it was developed for the Sonification Lab at the Georgia Institute of Technology. It is a multiplatform, multiuser and open access software for science education and auditory display research. The input of the program must be a two-column csv file. The user can select the parameters of the sound, is possible set the pitch, volume, timbre or pan in order to reproduce the data. Also, the graph has parameters to set. The software enables the user to export the sound, graphs and videos of the sonification of the data.
The xSonify (Candey et. al., 2006) was developed initially by Anton Schertenleib in Java language and Robert Candey and Wanda Diaz-Merced continued to improve the tool. This software sought to provide access to the space physics data facility for visually and non-visually impaired people. xSonify is a multi-platform, open-source application, which generate an auditory display and a plot with a two-column data file imported by the user. In this program the pitch, loudness and rhythm can be set. The user can export the midi file with the sonification.
The MathTrax (Shelton, 2008) was developed by the MDE (Math Description Engine) development team at NASA. This program is a tool for students of algebra, pre-calculus and calculus. Its target audience is young children in kindergarten through the 5th year of primary school. The input can be a function or a two-column text file. The software displays the graph and the sound, but not allow the user to set the parameters of the sound, the user only can set the graph parameters like color. MathTrax is an educational software, but is comparable with the other two because it produces a sonification of a two-column data file and provide assisted technology.
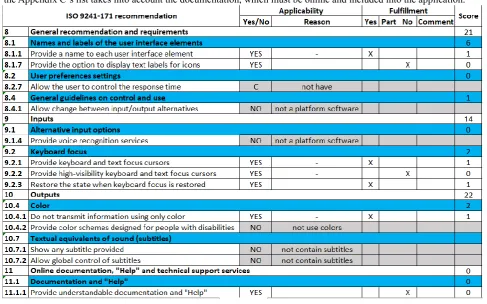
visual output, the colors displayed, text and founts, the haptic interface (if exist), the sound and multimedia output. Finally, the Appendix C’s list takes into account the documentation, which must be online and included into the application.
Table 1 - A sample of items analyzed in xSonify from the table in the Appendix C of the ISO 9241-171:2008 standard.
Figure 1. Results of the analysis of compliance.
Table 1 shows some items of the standard and the result of the analysis for those items in the xSonify software. The complete analysis consists on inspect 143 items of the Appendix C in each one of the software mentioned. The Figure 1 shown the percentage of fulfillment over the number of items that applied to the software (see column Applicability in Table 1).
The items that not applied depends on the software, there are items related with platform software and these three software programs are not this type. In general, the other items concern to the three programs, but there are items like “10.4.2 - Provide color schemes designed for people with disabilities” that only applies in one or two of the software. In the items of the example only concern to MathTrax, because the others do not display information with colors.
The study shown that MathTrax is the most accessible software of the three, and xSonify is most accessible than Sonification Sandbox. The results mirror the fact that MathTrax is the only one that present user help and documentation, and xSonify give the user more access to the configuration, like activate or deactivate Screen Reader. Another feature of xSonify is that it displays every content in a simple window, and does not use multiple windows in a notebook tab frame (Figure 2) like Sonification Sandbox and MathTrax. A multiple windows design is complicated to navigate for visual impaired people.
Figure 2. Example of a notebook tab frame.
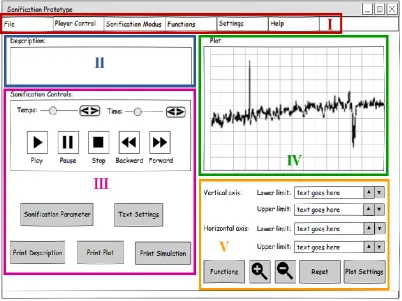
Based on the previous heuristic analysis, the programs and the recommendation of the ISO 9241-171:2008 standard, we propose a new user-centered architecture and interface (for example on Figure 3) for astronomy. The proposed interface may include the following five sections:
Section I – Menu bar: in this section, the user will find every action and setting that could be done, for example, in item “File” you will find “New Template”, “Load”, “Save”, “Import Data”, “Print”, “Export” and “Exit”; Section II – Description: this section contains a text label that can display description of the data file to analyze,
the “Text Settings” button allows the user change the text format;
Section III – Sonification Controls: this section presents the buttons (“Tempo”, “Time”, “Play”, “Pause”, “Stop”, “Backward” and “Forward”) to control the reproduction of the sonification. The other buttons allow the user to set the sonification parameters (pitch, loudness and rhythm) and print the different output information generated by the data analysis;
Section IV – Plot: here is the graph of the data imported by the user. The maximum and minimum level are set automatically. In addition, when the sonification is playing, the user can see a vertical line that indicates the position on the graph of what is being sonified;
Section V – Plot controls: in this part the user can modify the upper and lower boundaries of the graph, apply functions to the data, perform a zoom in and zoom out of the plot, reset the plot or change the settings.
The sections are illustrated in Figure 3 for the benefit of some readers. The illustration is not yet based on users’ modalities such as perceptual, attention, and mobility
.
3. A new software for sonorization
xSonify is a low fidelity prototype for sound translation, created in 2006 to facilitate the ability of one blind individual to become familiarized with the measurements stored in the Space Physics Data Facility (SPDF). Originally hosted by NASA GSFC, it had the ability of accessing the data from SPDF. Later on, due to Open source agreements, the program link to SPDF was removed. This means that the blind astrophysicists for whom it was created could no longer access the SPDF anymore. xSonify is written in JAVA and follows the user centered design approach of not hiding functionalities, includes a native Screen reader, and displays the measurements visually and via audio. Perception experiments supported the sound display approach as no other sensory modalities have been experimented upon for sensitivity to data detection in astronomy.
The xSonify has not been updated since 2011, when a few updates were added to the program based on feedback from abled expert astronomers (Diaz-Merced 2013). This software needs input from the community to implement changes, mainly thinking in the user, and to improve the interactions and functionalities. Its functionalities include: import, open, save, display (multi-sensory), map and process the telemetry. The xSonify idea may achieve full access given proper process of UCD, UX, HCI, HCSD or UCSD input. This suggestion has to be vigilantly considered as possibly, may contribute to segregate (in terms of being always up to date with the technologies available for astronomy data analysis) and label the users. As databases administrators are so busy in terms of their schedule and priorities, for now xSonify is proposed to function as a stand-alone and fusion tool. In that case the new designed software should work as a tool to fuse all the information from the data bases (e.g. SIMBAD, SDSS), multi sensorial display and facilitate mapping and processing of the information without changing views.
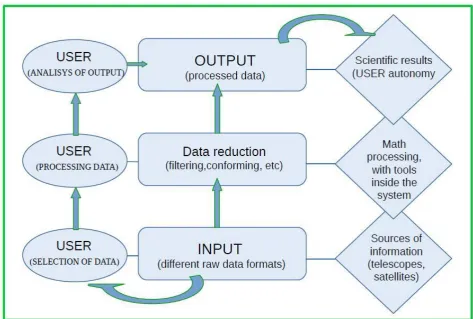
To achieve such goals, it is imperative to start with an architecture design that is based on the user (Figure 4) such as the Simplified Flowchart of Space Data Science needs when performing data analysis. Usually developers separate the back-end from the front-end design. The actual proposal is based on a model in which the back-end architecture, structure and engineering is designed on the basis of the end-user needs. Two kinds of users may have to be identified: first the user that inputs the telemetry (or astrophysical data needed for research) into the data base, and second the scientist astronomer, displaying the output data for analysis. During the collection of the telemetry many processes take place: cleaning, transformation, conformation and others applied to astronomy measurements (Patel and Patel 2016). In the field of astronomy, the information engineering gives priority to the computational cost system (which includes, but is not limited to collecting large amounts of information, transformation, map processing and display of that information). It does not take into consideration the autonomy of the user when displaying the information. Once the telemetry is in the
3. A new software for sonorization
xSonify is a low fidelity prototype for sound translation, created in 2006 to facilitate the ability of one blind individual to become familiarized with the measurements stored in the Space Physics Data Facility (SPDF). Originally hosted by NASA GSFC, it had the ability of accessing the data from SPDF. Later on, due to Open source agreements, the program link to SPDF was removed. This means that the blind astrophysicists for whom it was created could no longer access the SPDF anymore. xSonify is written in JAVA and follows the user centered design approach of not hiding functionalities, includes a native Screen reader, and displays the measurements visually and via audio. Perception experiments supported the sound display approach as no other sensory modalities have been experimented upon for sensitivity to data detection in astronomy.
The xSonify has not been updated since 2011, when a few updates were added to the program based on feedback from abled expert astronomers (Diaz-Merced 2013). This software needs input from the community to implement changes, mainly thinking in the user, and to improve the interactions and functionalities. Its functionalities include: import, open, save, display (multi-sensory), map and process the telemetry. The xSonify idea may achieve full access given proper process of UCD, UX, HCI, HCSD or UCSD input. This suggestion has to be vigilantly considered as possibly, may contribute to segregate (in terms of being always up to date with the technologies available for astronomy data analysis) and label the users. As databases administrators are so busy in terms of their schedule and priorities, for now xSonify is proposed to function as a stand-alone and fusion tool. In that case the new designed software should work as a tool to fuse all the information from the data bases (e.g. SIMBAD, SDSS), multi sensorial display and facilitate mapping and processing of the information without changing views.
To achieve such goals, it is imperative to start with an architecture design that is based on the user (Figure 4) such as the Simplified Flowchart of Space Data Science needs when performing data analysis. Usually developers separate the back-end from the front-end design. The actual proposal is based on a model in which the back-end architecture, structure and engineering is designed on the basis of the end-user needs. Two kinds of users may have to be identified: first the user that inputs the telemetry (or astrophysical data needed for research) into the data base, and second the scientist astronomer, displaying the output data for analysis. During the collection of the telemetry many processes take place: cleaning, transformation, conformation and others applied to astronomy measurements (Patel and Patel 2016). In the field of astronomy, the information engineering gives priority to the computational cost system (which includes, but is not limited to collecting large amounts of information, transformation, map processing and display of that information). It does not take into consideration the autonomy of the user when displaying the information. Once the telemetry is in the
Figure 4: Simplified Flowchart of Space Data Science
hands of the scientist, the first step is based on perception, a scrutiny that establishes the “next step” during the data analysis (Diaz-Merced, 2013). To follow the process, the application of mathematical states is needed, importing data from other sources, and based on the decision of the user, the process stops. The perception process occurs at each step of the analysis and it is limited by the algorithm engineering, and is a natural disambiguation human characteristic. This “user activity” could occur at very early stages after the telemetry acquisition (Khorram et al., 2012) to ensure that quality standards are met (see Figure 4).
To achieve the generation of such a work model, it is imperative to know in detail the work performed by the human analyst and the quality of the information, in an attempt to facilitate their very important work with the output of the information. In this contribution then, it is proposed a work model based on Human factors to assess and take into consideration human factors, since the receiving of the telemetry, to the display, for further perception and analysis. A user experience can establish a sustainable software design/improvement, capable to learn from the interaction human-machine (Egan, & Benyon, 2017).
4. Conclusions
From this work, it is possible to conclude that the available resources in Astronomy to analyze astronomical data are not adequate for all researchers. We studied the accessibility of three different programs devoted to producing sound files from a two-column table of astronomical data (i.e. intensity versus wavelength), using the ISO 9241-171:2008 recommendations.
We detected that all three software programs provided poor accessibility. In addition, Sonification Sandbox and xSonify do not provide documentation or user support. In the general requirements enumerated in the Appendix C, the authors found that the programs not allow the user to set text or visual preferences in general, only MathTrax present some text and visual preferences to set (like font and size of the text). In the input items the analysis shows a lack of communication between the interface and the user (for example, when the user imports the data file, the program only produces a visual response). The software, in general, not allows the user to manipulate the reproduction of the audio, that’s the case of rewind, saves some specific values (analysed data) and selects a specific position in the time series (in x-axes), which in some cases represents the wavelength (e.g. in spectroscopy).
The recognition of the problems associated with the actual tools is the first step to understand the available resources. In addition, this study is the basis to propose a new program, which should serve as a tool to address inequalities furthering the segregation of people with disabilities from professional performance in the scientific field.
In future works, a number of cross cultural focus groups will allow us to follow, categorize, and study the experience and needs of abled and disabled astronomers. The use of regional astronomy meetings and digital access to gather such information seems to be an ideal way to implement such groups. Development of a work model, implementation and the like, have to be set based on focus groups and usability evaluations that will provide the opportunity to remotely monitor the interaction of participants. Through this iterative development process, where we elicit requirements and feedback from the carefully designed focus group and other interested users, we will prioritize the requirements by importance, usefulness, and difficulty of implementation. This will serve to categorize challenges, needs and preferences of the target audience. This work, based on Focus Groups responses, is in progress.
Acknowledgments
The authors want to thank the IAU-Office of Astronomy for Development and the National Council of Scientific Research of Argentina (CONICET) for their support for this research. The help of Blaine Lomberg, from the South African Astronomical Observatory, for the revision of the manuscript is also very much appreciated.
References
Candey, R. M.; Schertenleib, A. M. and Diaz-Merced, W. L. (2006). Xsonify Sonification Tool for Space Physics. 12th International Conference on Auditory Display, London, UK
Casado, J., Diaz-Merced, W, García, B., Jaren, G. (2017) SABI, XXI Congreso Argentino de Bioingeniería, Córdoba, Argentina, accepted for publication.
Davison, B. K. and Walker, B. N. (2007). Sonification sandbox reconstruction: Software standard for auditory graphs. 13th International Conference on Auditory Displays, Montreal, Canada
Diaz Merced, Wanda L. (2013) Sound for the exploration of space physics data. PhD thesis, University of Glasgow. Dubinski, J. (2008) “Visualizing astrophysical N-body systems.” New Journal of Physics, 10, 125002.
Federl, P., Grimstrup A., Kiddle C. and Taylor A. R. (2011) “On-Line Access and Visualization of Multi-Dimensional
FITS Data.” Astronomical Data Analysis Software and Systems XX. San Francisco: Astronomical Society of the
Pacific, 467-470.
Fluke, C., Barnes D. and Jones N. (2009) “Interchanging Interactive 3D Graphics for Astronomy.” Publications of the
Astronomical Society of Australia, 26-1, 37-47.
Hassan, A. and Fluke, C.J. (2011) “Scientific Visualisation in Astronomy: Towards the Petascale Astronomy Era.”
Publications of the Astrophysics Society of Australia, Vol 28, 2, 150-170.
Hassan A. H., Fluke C. J., Barnes D. G. and Kilborn V. A. (2013) “Tera-scale astronomical data analysis and visualization.” MNRAS, 429, 2442-2455.
ISO 9241-171:2008, “Ergonomics of human-system interaction – Part 171: Guidance on software accessibility,” International Organization for Standardization, Standard, 2008.
Kapferer, W. and Riser, T. (2008) “Visualization needs and techniques for astrophysical simulations.” New Journal of
Physics 10, 125008.
Khorram, S., Koch, F.H., Van der Wiele, C.F. and Nelson, S.A.C. (2012) Remote Sensing. New York, Spinger -Verlag Ed. Knowles, B., Clear, A. K., Mann, S., Blevis, E. and Håkansson, M. (2016) Design patterns, principles, and strategies for
Sustainable HCI, Conference on Human Factors in Computing Systems - Proceedings Vol. 07-12-May-2016 (2016), p. 3581-3588.
Shelton, R. (2008). MATHTRAX, National Aeronautics and Space Administration. (Date last accessed May-2017). [Online]. Available: https://prime.jsc.nasa.gov/mathtrax/
Leech, J. and Jenness, T. (2005) “A Survey of Software for the Manipulation and Visualization of 3-D Submm Spectral Line Datasets.” Astronomical Data Analysis Software and Systems, 347, 143-147.
Li, H, C Fu, and Hanson, A. (2008). “Visualizing Multiwavelength Astrophysical Data.” IEEE Transactions on
Visualization and Computer Graphics 14, no. 6, 1555-1562.
Palomino, H. (2003) “Visualization of 3D Numerical Simulations in Astrophysics using the VR-cube.” Masters Thesis, Department of Numerical Analysis and Computer Science, Royal Institute of Technology, Stockholm.
Patel, S. and Patel, A. (2016) “A big Data Revolution in Health care Sector: Opportunities, challenges, and Technological Advancements.” IJIST, Vol.6, Num 1-2., 156.
Ritter, F. E. et al., (2016) Foundations for Designing User-Centered Systems, 33 DOI: 10.1007/978-1-4471-5134-0_2, WGAD 2016. Publication Accessibility Recommendations.
https://wgad.aas.org/sites/wgad.aas.org/files/Recommendations_WGAD_2016.pd United Nations, Human Development Report (2015)
hdr.undp.org/sites/default/files/2015_human_development_report.pdf