Comparison of a plant based natural surfactant with SDS for washing of As(V) from Fe
rich soil
Soumyadeep Mukhopadhyay1, Mohd. Ali Hashim1*, Jaya Narayan Sahu1, Ismail Yusoff2, Bhaskar Sen Gupta3
1
Department of Chemical Engineering, University of Malaya, 50603, Kuala Lumpur, Malaysia 2
Department of Geology, University of Malaya, 50603, Kuala Lumpur, Malaysia 3
School of Planning, Architecture and Civil Engineering, Queen’s University Belfast, BT9 5AG, UK
* Corresponding Author: Prof M.A. Hashim ; Ph: +603 7967 5296; FAX: 60379675319, Email: [email protected]
Abstract
BACKGROUND: This study explores the possible application of a biodegradable plant based
surfactant, obtained from Sapindus mukorossi, for washing low levels of arsenic (As) from an iron
(Fe) rich soil. Natural association of As(V) with Fe(III) makes the process difficult. Soapnut solution
was compared to anionic surfactant sodium dodecyl sulfate (SDS) in down-flow and a newly
introduced suction mode for soil column washing.
RESULTS: It was observed that soapnut attained up to 86% efficiency with respect to SDS in
removing As. Full factorial design of experiment revealed a very good fit of data. The suction mode
generated up to 83 kPa pressure inside column whilst down-flow mode generated a much higher
pressure of 214 kPa, thus making the suction mode more efficient. Micellar solubilisation was found
to be responsible for As desorption from the soil and it followed 1st order kinetics. Desorption rate
coefficient of suction mode was found to be in the range of 0.005 to 0.01, much higher than
down-flow mode values. Analysis of the FT-IR data suggested that the soapnut solution did not interact
chemically with As, offering an option for reusing the surfactant.
CONCLUSION: Soapnut can be considered as a soil washing agent for removing As even from soil
with high Fe content.
Keywords: soil washing; soapnut; Sapindus mukorossi; arsenic; plant based surfactant
D: Down-flow mode; S: Suction mode; L: Low contaminated soil ; H: High contaminated soil PV: Pore Volume; SDS: Sodium dodecyl sulphate; SN: Soapnut; As: Arsenic
Introduction
Accumulation of arsenic (As) in soil due to unsafe agricultural practices, mining, smelting, coal
burning, wood preservation and illegal waste dumping activities continue to be a serious threat to
human health and environment (Tokunaga and Hakuta, 2002). The non-biodegradability of As and its
variable mobility under different geochemical processes and soil redox conditions ensure its
transformation and continued presence in the soil matrix for a long period of time (Cheng et al., 2009;
Craw, 2005). A number of methods have been reported for the treatment of As contaminated soils
(Wang and Zhao, 2009). Soil washing by acids, alkaline reagents, phosphates and Bureau of
Reference (BCR) three-step sequential extraction procedure are well researched (Alam et al., 2001;
Jang et al., 2007; Jang et al., 2005; Ko et al., 2005; Yang et al., 2009). Biosurfactants synthesised by
living cells for the removal of toxic metals from soil matrix is also currently being assessed (Chen et
al., 2008; Mulligan and Wang, 2006; Polettini et al., 2009; Wang and Mulligan, 2009a). In this
research work, a natural surfactant obtained from Sapindus mukorossi plant or soapnut has been used
to wash low level of arsenic(V) from soil and its performance has been compared with sodium
dodecyl sulphate (SDS), an inorganic anionic surfactant. The soil matrix used here has a high level of
Fe rich mineral maghemite, which has a good affinity for As(V) (Chowdhury and Yanful, 2010;
Yamaguchi et al., 2011). The pollutant removal becomes difficult at lower concentrations (Sundstrom
et al., 1989).
Saponin for soil washing
The fruit pericarp of Sapindus mukorossi or soapnut is a source of saponin, an effective plant based
surfactant (Chen et al., 2008; Song et al., 2008). Soapnut tree is common in Indo-Gangetic plains,
Shivaliks and sub-Himalayan tracts. The soapnut fruit pericarp contains triterpenoidal saponin; a
decades (Suhagia et al., 2011). Previously, saponin was used for removal of Cd, Zn, Ni and a number
of organic pollutants with success (Chen et al., 2008; Kommalapati et al., 1997; Polettini et al., 2009;
Roy et al., 1997; Song et al., 2008). The mechanism for pollutant removal involved increase of
wettability of the soil by surfactant solution, sorption of the surfactant molecules onto the soil surface,
physical or chemical attachment with the pollutant, detachment of the pollutant particle or molecule
from the soil into the surfactant solution, and subsequent association with surfactant micelles.
However, saponin extracted from soapnut has never been used for removal of soil arsenic, which has
entirely different chemical characteristics from the heavy metals. As(V) was used in this study as the
pH and redox values in the sampling site as well as in the column favoured the presence of As(V)
over As(III) (Dobran and Zagury, 2006; Smedley and Kinniburgh, 2002). Speciation was confirmed
by a solvent extraction process. Moreover As(V) is more difficult to remove than As(III), from Fe(III)
bearing minerals of soil components (Yamaguchi et al., 2011). The soil sample used in this work
contains maghemite, which has a high affinity for As(V) (Chowdhury and Yanful, 2010). Arsenic
polluted sites such as mine tailings and agricultural fields contain high level of iron. The intension of
using high iron containing soil in this study is to test the efficiency of soapnut solution in such
challenging conditions.
Sodium dodecyl sulphate (SDS), an anionic inorganic surfactant has been used by various research
groups for soil washing to remove heavy metals and organics (Hernández-Soriano et al., 2011; Torres
et al., 2012; Zhang et al., 2007). In this study, SDS has been used to compare the efficiency of soapnut
with respect to this widely used anionic surfactant.
The objectives of this research were to study; (i) the performance of the natural surfactant soapnut
solution compared to commonly used SDS in washing arsenic from a soil column; (ii) the desorption
kinetics and the mechanism of arsenic removal by soapnut solution; and (iii) the advantage of a newly
Materials and methods
Soil sample, surfactants and analytical methods
A composite soil sample was collected from the first layer aquifer in Hulu Langat area, Selangor,
Malaysia. The soil was dried in an oven overnight at 105OC and then crushed and passed through a 2 mm sieve (Roy et al., 1997). All soil parameters are measured according to standard procedures as
shown in Table 3. XRD analysis was performed by a Panalytical Empyrean diffractometer using
Highscore Plus software. As(V) salt (Na2HAsO4∙7H2O) was used for spiking the soil matrix depending on the Eh and pH of the unspiked soils (Tokunaga and Hakuta, 2002). Although As(V) salt
is soluble in water, it binds strongly with Fe(III) minerals and cannot be removed by water alone. The
soil was spiked by 50 and 200 mgL-1concentrations of sodium arsenate solution, at room temperature by mixing it for 7 days at a weight: volume ratio of 3:2. In order to increase field relevance and wash
away the loosely bound water soluble arsenic, the spiked soil samples were leached with 2 pore
volumes of artificial rainwater of pH 5.9 consisting of 5×10⁻⁴M CaCl2, 5×10⁻⁴M Ca(NO3)2, 5×10⁻⁴
M MgCl2, 10−4 M Na2SO4, and 10−4 M KCl (Oorts et al., 2007). Pore volume for a 300 gm soil
column was calculated to be approximately 80 mL which was evaluated by measuring the weight
difference between dry and water saturated soil column (Dwarakanath et al., 1999). After this stage,
the soils were allowed to drain overnight, then air dried at 25OC for 24 h and sieved through a 2 mm mesh. They were digested following USEPA method 3050B to measure metal contents by ICP-OES
(Perkin -Elmer Optima 7000DV). All the samples were analyzed in triplicate and the results were
reproducible within ±3.5%. Based on some preliminary experiments, 20 mM of SDS, 0.5 and 1%
(w/v) of soapnut extractions were selected for the study and were compared against a standard blank
sample. All of the surfactant concentrations greatly exceeded the critical micelle concentration (CMC)
of the respective surfactants.
The surfactant was extracted from the soapnut fruit pericarp by water (Roy et al., 1997). The CMC
Manual Model 20 Surface Tensiometer). The functional groups present in the soapnut extract and the
effluent solution were characterized by FT-IR spectroscopy (PerkinElmer Spectrum 100 Series)
collected in the range of 400–4000 wave numbers (cm-1). Zetasizer Nano ZS series (Malvern Instruments Ltd, UK) was used to measure zeta potential of the soil particles in the presence of
Speciation of Arsenic in spiked soil by solvent extraction
Arsenic in the soil spiked with sodium arsenate was speciated by the solvent extraction process
(Chappell et al., 1995). This extraction was performed in three steps; first, total As was extracted
following Method 3050B, secondly, any trivalent As was extracted from an aliquot of this total As
extract in CHCl3in a separating funnel and again back extracted into aqueous layer, and thirdly, total
inorganic As was determined by adding 50% w/v KI solution with the As extract and then extracting
inorganic As by CHCl3 in a separating funnel. The concentration of As for each solution was
determined by ICP-OES.
Design of experiments by full factorial design
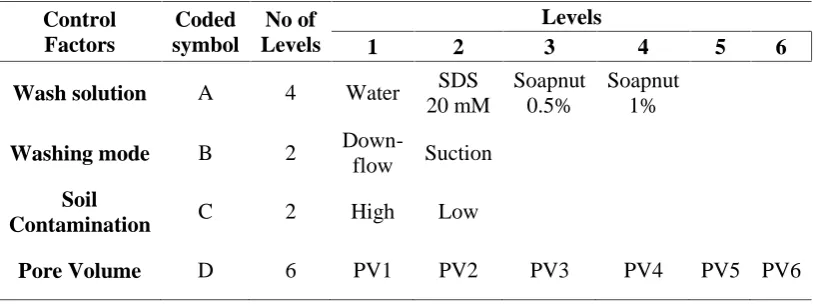
A number of factors influencing the soil column washing process have been investigated; viz. the type
of surfactant and its concentration, level of As contamination in the soil and the washing mode. A full
factorial design was followed to include all possible combinations of the levels across all of these
control factors. Design Expert 7.0.0 was used to plan the experiments and to analyze the results. The
full factorial design reveals the effect of each factor on the response variable, as well as the
interactions between factors on the response variable. In total, 96 experiments were conducted in
duplicate in three identical experimental setups. The levels and ranges of the studied process
parameters are given in Table 1, and the experimental design is presented in the appendix in Table
A1.
Response is recorded in terms of percentage of As removal from the column in each pore volume,
defined by the Equation 1.
(%) ℎ =[ ] (1)
Table 1. Control factors and their levels for the experimental design
Control Factors
Coded symbol
No of Levels
Levels
1 2 3 4 5 6
Wash solution A 4 Water SDS
20 mM
Soapnut 0.5%
Soapnut 1%
Washing mode B 2
Down-flow Suction
Soil
Contamination C 2 High Low
Pore Volume D 6 PV1 PV2 PV3 PV4 PV5 PV6
Statistical Analysis: ANOVA for As removal in each PV
Analysis of variance (ANOVA) is a general statistical method used for testing the hypothesis that the
means among two or more groups are equal. It was used for analysing the data to obtain the
interaction among different control factors. After the data was gathered from the experiments, a
square root transformation was applied to the data which was then fitted into the 2FI model. Square
root transformation was applied on the data because without any transformation, the Coefficient of
Variance (CV) came up to be very large, which is unacceptable. Some of the important factors in the
ANOVA method are sum of squares (SS), R2, adjusted R2, P-value and adequate precision (AP). The SS of each control factor quantifies its importance in the process. As the value of the SS increases, the
significance of the corresponding factor in the undergoing process also increases. A high R2 value, close to 1, is desirable to ensure a satisfactory adjustment of the mathematical model to the
experimental data. A reasonable agreement of R2 value with adjusted R2 value is also necessary (Nordin et al., 2004). Model terms were evaluated by the P-value (P values <0.05 are potentially
significant) with 95% confidence level. AP is a type of signal to noise ratio and compares the range of
the predicted values at the design points to the average prediction error. AP value greater than 4
indicate adequate model discrimination (Mason et al., 2003).
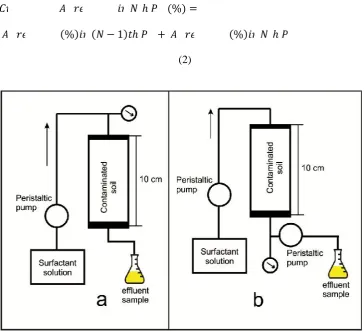
The contaminated soil was packed in a 10 cm long plexiglass column having 5.5 cm internal diameter
(Roy et al., 1997). Approximately 300 gm of soil was packed in each column. Circular plexiglass
discs with perforations were inserted at 3 cm intervals to distribute the liquid flow and to avoid
preferential flow. Arsenic extraction was induced by pumping 6 pore volumes (PV) of flush solution.
The packed column was flooded with water from the bottom at the rate of 5 mL min-1to remove air spaces. Then flushing solution was pumped into the saturated soil column from top to provide wash in
a down-flow mode. In the suction mode, flush solution was introduced from the top of the saturated
column while a peristaltic pump was attached at the outlet to suck the wash liquid out of the column.
The effluent were collected for each PV and As concentrations were measured by ICP-OES. The
cumulative As removal was measured after each pore volume by the Equation 2. The pressure drop
across the soil column was monitored in both cases. The experimental setup is shown in Fig. 1.
ℎ (%) =
(%) ( − 1) ℎ + (%) ℎ
[image:8.595.73.438.388.719.2](2)
Fig. 1. Schematic diagram of the column washing experiment (a) down-flow mode (b) suction mode
The cumulative concentration of As remaining in the soil column (mg As kg-1soil) was used to plot the kinetics (Sparks et al., 1980). Desorption of As varied with variation in the flow rate of the
surfactant. Column washing was performed in continuous mode by 6 pore volumes of wash liquid and
effluent samples were collected at different times. The time intervals were noted down accordingly
and has been shown in Appendix (Table A2). The time taken for different modes vary due to
development of pressure inside the column. The apparent desorption rate coefficient (k'd) and the
order of the processes was determined using Equation 3 (Sivasubramaniam and Talibudeen, 1972).
ln (Ast/As0) = - k'd(t) [3]
which can also be written as Ast= As0exp (- k'dt) [4]
Where, Astis the quantity of As on soil exchange sites at time t of desorption or amount of As in soil
column at time t, As0is the quantity of As on exchange sites at zero time of desorption or the amount
of As in soil column at initial stage before column washing was initiated, and t is time in minutes. The
ln(Ast/As0) vs. t relationship is linear if the rate of release of As follows first-order kinetics.
Results and discussion
Soil and surfactant characterization
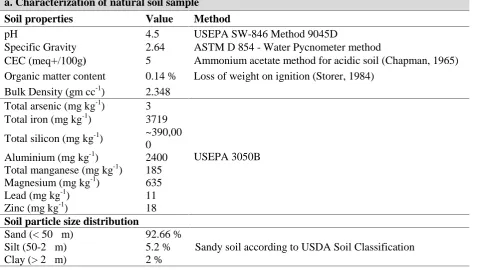
The soil was classified as sandy soil according to USDA soil classification (Table 2). XRD analysis
of both spiked and unspiked soils revealed that the soil samples contained Silicon Dioxide as quartz
(SiO2, XRD displacement 0.158), Magnesium Aluminium Silicate Hydroxide as mica ((Mg, Al)6(Si,
Al)4O10 (OH)8, XRD displacement 0.119), Sylvine, sodian (Cl1K0.9Na0.1, XRD displacement -0.171),
Maghemite Q (Isometric Fe21.333O32, XRD displacement 0.001), feldspar Albite (Al Na O8Si3, XRD
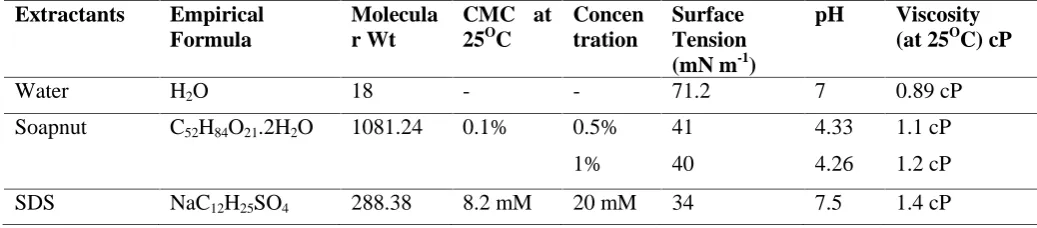
detected in the mineral phase as expected in such low levels as 52.5 mg Kg-1. Table 2 and 3 summarize the characteristics of the soil and surfactants respectively.
Fig. 2. XRD spectra of the As spiked soil sample (52.5 mg Kg-1)
Table 2. Characterization of unspiked and spiked soil
a. Characterization of natural soil sample
Soil properties Value Method
pH 4.5 USEPA SW-846 Method 9045D
Specific Gravity 2.64 ASTM D 854 - Water Pycnometer method
CEC (meq
+
/100g) 5 Ammonium acetate method for acidic soil (Chapman, 1965) Organic matter content 0.14 % Loss of weight on ignition (Storer, 1984)Bulk Density (gm cc-1) 2.348 Total arsenic (mg kg-1) 3
USEPA 3050B Total iron (mg kg-1) 3719
Total silicon (mg kg-1) ~390,00 0 Aluminium (mg kg-1) 2400 Total manganese (mg kg-1) 185 Magnesium (mg kg-1) 635
Lead (mg kg-1) 11
Zinc (mg kg-1) 18
Soil particle size distribution
Sand (< 50μm) 92.66 %
Sandy soil according to USDA Soil Classification
Silt (50-2 μm) 5.2 %
[image:10.595.63.546.498.768.2]b. As speciation in spiked soil Low Contaminated soil
Total As (mg kg-1) 22.6
Solvent extraction (Chappell et al., 1995) As(III) (mg kg-1) 1.7
As (V) (mg kg-1) 20.9
High Contaminated soil
Total As (mg kg-1) 52.5
Solvent extraction (Chappell et al., 1995) As(III) (mg kg-1) 3.4
[image:11.595.52.571.281.395.2]As (V) (mg kg-1) 49.1
Table 3: Characterization of extractant
Extractants Empirical Formula
Molecula r Wt
CMC at 25OC
Concen tration
Surface Tension (mN m-1)
pH Viscosity (at 25OC) cP
Water H2O 18 - - 71.2 7 0.89 cP
Soapnut C52H84O21.2H2O 1081.24 0.1% 0.5% 41 4.33 1.1 cP
1% 40 4.26 1.2 cP
SDS NaC12H25SO4 288.38 8.2 mM 20 mM 34 7.5 1.4 cP
Arsenic sorption in soil
The soil spiked with 50 mgL-1As solution is found to retain 22.6 mg kg-1of As after washing with artificial rain water of pH 5.9, whilst soil spiked with 200 mg L-1As solution retains 52.5 mg kg-1As. The former is hereby referred to as "low contaminated soil" and the later is referred to as "high
contaminated soil". Arsenic is retained in the soil matrix mostly by hydrous oxides of Fe(III) and
Al(III) (Jacobs et al., 1970). Arsenic adsorption by soil organic matter and silica are negligible
(Wasay et al., 1996; Weng et al., 1997).
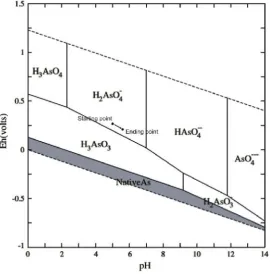
The unspiked soil has a pH value of 4.5 and Eh value of 260 mV. According to the revised Eh–pH
diagrams for the As–O–H system at 25OC and 1 bar (Lu and Zhu, 2011), arsenic is expected to exist in +5 state under these conditions in aqueous matrices. Hence, aqueous solution of Na2HAsO4∙7H2O was used to spike the soil. After spiking and washing the soil, the pH and Eh values of soil were
found to be 5.2 and 210 mV respectively. In Fig. 3, the Eh-pH diagram illustrates this scenario;
slight decrease in Eh value in the spiked soil was accompanied by an increase in soil pH value. The
As speciation in high and low contaminated soils by solvent extraction confirmed the presence of
As(V) species (up to 94% of total As), as shown in Table 2.
Fig. 3. Initial and final pH and Eh values of contaminated soil during column washing experiment
reported in the Eh-pH diagram for the system As-O-H at 25°C and 1 bar with activities of soluble As
species = 10-6M. The revised Eh-pH diagram is taken from Lu and Zhu.(Lu and Zhu, 2011) Gray
shaded areas denote solid phases.
Cumulative As removal in down-flow mode and suction mode
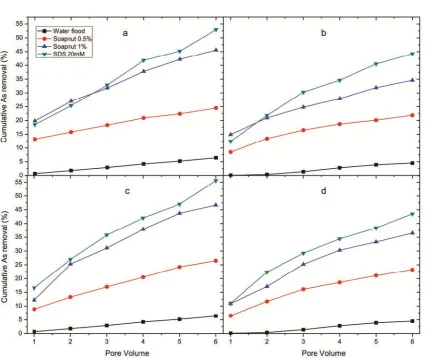
The data for cumulative As removal from both low and high contaminated soil columns are provided
in Fig 4. The cumulative As removal efficiency was the highest in the presence of 20 mM SDS
solution in all four scenarios. SDS 20 mM solution was succeeded by 1% soapnut solution.
Conversely, the As removal by 0.5% soapnut solution was considerably low. To account for the water
[image:12.595.80.351.192.467.2]low contaminated soil in 6 PVs. Therefore, it is evident that very little water-soluble loosely bound As
was present in the soil column, perhaps in As(III) state as indicated by the speciation study. The
column washing performances are graphically represented in Figs. 4a-4d. From low contaminated soil
in down-flow mode, 20 mM SDS, 1 and 0.5% soapnut solution removed 8.8, 7.2 and 3.8 times more
As respectively than that recovered with water. The corresponding values for high contaminated soil
in down-flow mode are a factor of 9.8, 7.7 and 4.8 times greater than that recovered with water. The
trend was similar in suction modes as well. For the low contaminated soil washed in suction mode
with 20 mM SDS, 1 and 0.5% soapnut solution, the respective As removal was 8.7, 7.3 and 4 times
more than that recovered with water. The corresponding values for high contaminated soil are a factor
of 9.7, 8 and 5.2 times greater than that recovered with water.
Arsenic removal increased significantly when the concentration of soapnut was increased from 0.5 to
1%. For low contaminated soil in down-flow mode, after 6 PVs using 0.5% solution, approximately
1.66 mg of As was recovered compared to 3.1 mg using a 1% solution and 3.6 mg using 20 mM SDS
solution. In contrast, the water flood recovered only 0.44 mg As under similar conditions. For high
contaminated soil in down-flow mode, 0.5% and 1% soapnut, 20 mM SDS and water flood removed
3.4, 5.36, 6.85 and 0.70 mg of As from the column respectively. From the low spiked soil in suction
mode, SDS removed 3.78 mg As, 1% soapnut solution removed 3.17 mg As whilst 0.5% soapnut
solution recovered 1.8 mg of As compared to a 0.44 mg with water flood. In the case of the highly
spiked soil in suction mode, the corresponding values are 6.74, 5.65, 3.6 and 0.7 mg respectively.
It is clear that with an increase in the concentration of natural surfactant, there is a significant increase
in the removal of As from the soil column. This can be explained by the increased solubility of As in
the surfactant micelles. Other studies observed that, with an increase in surfactant concentration above
CMC, the number of micelles usually increase, resulting in enhanced solubilisation of pollutants,
The square root of the percentage of arsenic removal in each pore volume for both down-flow and
suction modes has been shown in Fig. A1. The As concentration in the effluent was highest during the
initial PVs and continued to decrease in the subsequent washings. Roy et al. (1995) also observed
high initial removal of residual transmission fluid from the soil column. This was attributed to any
free phase pollutant in the column. Any loosely bound As(V) may get easily detached from the soil
particles by the initial spurge of the surfactant having enhanced wettability than water and high
micelle forming ability. The later PVs experience extraction of strongly bound As. However, opposite
observations were made by other researchers who experienced less removal in initial PVs
(Kommalapati et al., 1997; Roy et al., 1997; Wang and Mulligan, 2009b). This might be due to
presence of strongly attached pollutants which required higher desorption time to leach out from the
soil particles.
The soapnut concentration in the effluent increased after the third or fourth PV, signifying that during
the initial stages the extractant solutions underwent adsorption on the soil particles thereby extracting
the pollutant by micellar solubilisation. As the washing process progressed, the surfactant absorbance
in the soil reached saturation. At the 5th and 6th PV, the concentration of effluent soapnut solution
resembled that of influent solution. Roy et al. (1997) also observed that the soapnut concentration was
Fig. 4. Cumulative As removal from (a) D, L (b) D, H (c) S, L (d) S, H
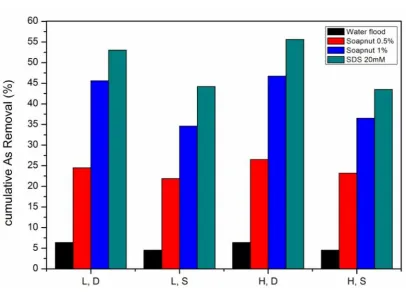
Fig. 5 compares the overall performance of all the surfactants. The anionic surfactant SDS was the
better extractant. However, soapnut at 1% concentration achieved 78-86% of the performance of SDS
under all conditions. Considering that soapnut is an environment friendly biodegradable non-ionic
surfactant, this performance is encouraging and it merits further investigation. Washing 1 ton of low
level arsenic contaminated soil in the ratio of 300:480 (corresponding to washing of 300 gm soil with
6 PV liquid of 80 mL each) by 1% SN and 20 mM SDS solutions under similar conditions will require
22.86 Kg of soapnut and 9.23 Kg of SDS, both of which will cost roughly 30 USD at the current
market price. Preliminary experiments and previously published work indicate that soapnut
concentration higher than 1% developed excess pressure inside the column and the process slowed
Fig. 5. Comparison of As removal performance by surfactants under different flow modes (L: Low
contaminated soil; H: High contaminated soil; S: Suction mode; D: Down-flow mode)
Statistical Analysis: ANOVA for As removal in each PV
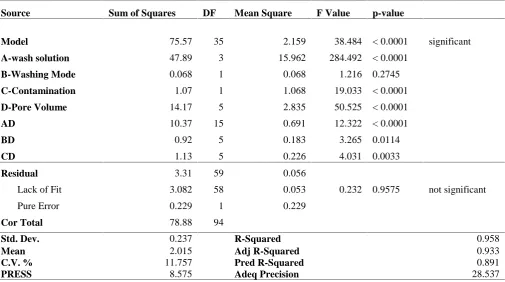
Analysis of variance (ANOVA) is shown in Table 4. The F Value for a term is the test for comparing
the variance associated with that term with the residual variance. It is the mean square for the term
divided by the mean square for the residual. The Model F-value of 38.484 implies the proposed model
is significant. There is a 0.01% chance that a "Model F-Value" this large could occur due to noise.
Model terms were evaluated by the P-value (probability) with 95% confidence level. This is the
probability value that is associated with the F Value for this term. It is the probability of getting an F
Value of this size if the term did not have an effect on the response. In general, a term that has a
probability value less than 0.05 would be considered a significant effect. A probability value greater
than 0.10 is generally regarded as not significant. A, C, D, AD, BD, CD are significant model terms.
However, the factor B was also included to maintain the heirarchy of the design. The "Pred
[image:16.595.75.482.90.386.2]28.537 indicates an adequate signal fit to be used for navigating the design space. The interaction
graphs for sqrt of As removal at different PVs are given in Fig A1. From the normal probability plot
of the residuals (Fig. A2) it can be seen that the data points are fairly close to the straight line
indicating that the experimental results conform to a normally distributed population (Antony, 2003).
Diagnostic plots of predicted versus actual values aids in judging the quality of the model. Table A1
enlists the actual and predicted values of the experimental data points. Figure A3 indicates a good
agreement between actual data and data predicted by the model which is not shown here. The overall
[image:17.595.47.553.374.656.2]statistical analysis indicates the robustness of the experimental data.
Table 4: ANOVA for selected factorial model for cumulative As removal
Analysis of variance table [Partial sum of squares]
(Run no 62 was ignored during the analysis due to bad data points)
Source Sum of Squares DF Mean Square F Value p-value
Model 75.57 35 2.159 38.484 < 0.0001 significant
A-wash solution 47.89 3 15.962 284.492 < 0.0001
B-Washing Mode 0.068 1 0.068 1.216 0.2745
C-Contamination 1.07 1 1.068 19.033 < 0.0001
D-Pore Volume 14.17 5 2.835 50.525 < 0.0001
AD 10.37 15 0.691 12.322 < 0.0001
BD 0.92 5 0.183 3.265 0.0114
CD 1.13 5 0.226 4.031 0.0033
Residual 3.31 59 0.056
Lack of Fit 3.082 58 0.053 0.232 0.9575 not significant
Pure Error 0.229 1 0.229
Cor Total 78.88 94
Std. Dev. 0.237 R-Squared 0.958
Mean 2.015 Adj R-Squared 0.933
C.V. % 11.757 Pred R-Squared 0.891
PRESS 8.575 Adeq Precision 28.537
Pressure build-up in soil column
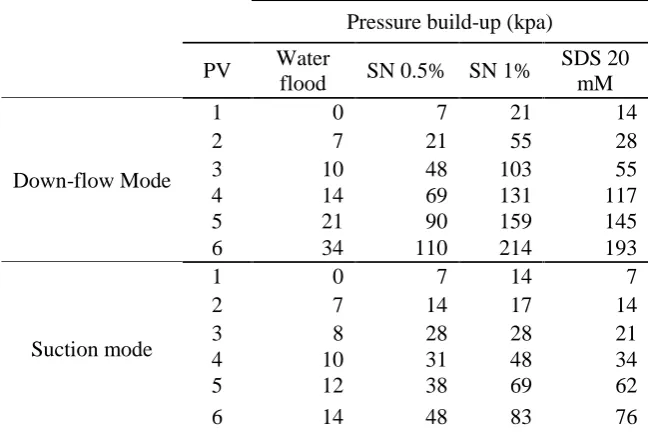
Table 5 illustrates the variation in pressure development for the surfactant runs for low contaminated
solution, followed by 20 mM SDS solution, 0.5% soapnut solution and water. Previous studies also
experienced the development of pressure in down-flow mode in the soil column (Kommalapati et al.,
1998; Roy et al., 1995). However, for the suction mode, the pressure build-up was much lower than
down-flow mode. The maximum pressure build-up recorded by 1% soapnut at the sixth PV was only
83 kPa compared to 214 kPa at down-flow mode, resulting in a much faster operation in down-flow
mode. Therefore, a fast process with low pressure development makes the suction mode more
advantageous than down-flow mode. The development of higher pressure in down-flow mode resulted
from clogging of the soil pores due to a dispersion of colloids and trapping of air bubbles inside the
soil pores, which obstructed the flow of flushing solution through the contaminated area, reducing the
efficiency of As removal from the soil matrix (Nash, 1987; Roy et al., 1995). Suction mode also
produced channelized flow and pore clogging, however the entrapment of air bubbles was negligible
due to the suction pressure provided at the outlet. The surfactant solutions easily flowed through the
channels to the outlet point without building up undesirable pressure, making the operation easier.
[image:18.595.135.460.503.719.2]The cumulative As removal was similar in both suction and down-flow modes.
Table 5: Pressure build-up in low contaminated soil column
Pressure build-up (kpa)
PV Water
flood SN 0.5% SN 1%
SDS 20 mM
Down-flow Mode
1 0 7 21 14
2 7 21 55 28
3 10 48 103 55
4 14 69 131 117
5 21 90 159 145
6 34 110 214 193
Suction mode
1 0 7 14 7
2 7 14 17 14
3 8 28 28 21
4 10 31 48 34
5 12 38 69 62
6 14 48 83 76
Kinetics of As extraction from soil column
Whilst performing the column washing procedure, the time taken for each PV to pass through the
column was recorded. The time increased with each subsequent PV. Ast was calculated from the
samples collected at the end of each PV. Ast values are provided in the appendix in Table A2.
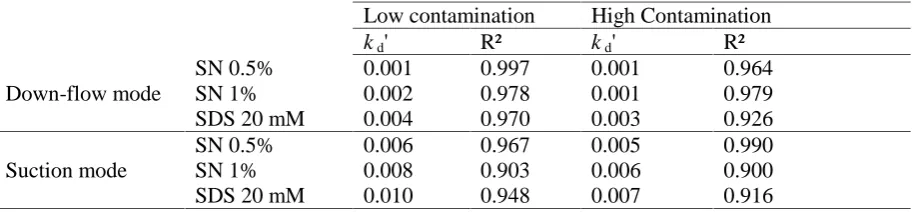
ln(Ast/As0) was plotted against time and the graph showed linearity. This confirmed that the kinetics
of desorption phenomenon to be of first order for the entire period of column washing. Table 6
summarizes the kd' values which ranged from 0.001 to 0.010 min-1. Satisfactory fits were obtained and, with a few exceptions, R2 values were above 0.9. The kd' values for suction modes were much higher than down-flow mode due to a faster rate of washing. Whilst down-flow mode took up to 170
mins for passing 6 PV, suction mode took only up to 75 mins of time at the maximum. In general,
[image:19.595.71.528.438.544.2]SDS demonstrated highest kd', followed by 1% and 0.5% soapnut solutions.
Table 6: Apparent desorption rate coefficients (kd') and R2for As desorption from the soil columns
Low contamination High Contamination
kd' R² kd' R²
Down-flow mode
SN 0.5% 0.001 0.997 0.001 0.964
SN 1% 0.002 0.978 0.001 0.979
SDS 20 mM 0.004 0.970 0.003 0.926
Suction mode
SN 0.5% 0.006 0.967 0.005 0.990
SN 1% 0.008 0.903 0.006 0.900
SDS 20 mM 0.010 0.948 0.007 0.916
Zeta potential, FT-IR spectral data and mechanism of As removal by soapnut
The zeta potential values of the soil particles were measured in de-ionized water, 20 mM SDS, 0.5%
and 1% soapnut solutions and were found to have values of -34.3, -61.8, -17.1 and -11.8 mV
respectively. Therefore, in the case of both SDS and soapnut, zeta potential values underwent
significant change. Compared to water, the zeta potential decreased significantly for 20 mM SDS,
which indicates adsorption of the anionic surfactant SDS on the surface of soil particles. A similar
decrease in zeta potential of kaolinite was observed when it sorbed SDS on its already negative basal
head groups (Ko et al., 1998). However, the zeta potential value was much higher for soapnut due to
the non-ionic tails of saponin molecules, which were adsorbed on the soil particles, thereby reflecting
higher zeta potential values. It was postulated that surfactant adsorption is essential for the removal of
soil contaminants, and surfactants that adsorb at the soil–water inter-phases are better detergents
(Raatz and Härtel, 1996). Therefore, soapnut and SDS, both were adsorbed on soil particle and were
effective detergents.
FT-IR spectral data as exhibited in Fig. 6, displayed the differences in average absorbance spectra for
the influent and the effluent soapnut solutions, together with the absorption range of different
molecular vibrations present in phenolic-OH at 3436 cm-1, carbonyl groups of carboxylic acid at 2092 cm-1 and alkene groups at 1642 cm-1, similar to earlier observations (Pradhan and Bhargava, 2008). No shifting of peaks in FT-IR spectra was observed in the soapnut solution in presence of As in the
soil column. Similar analysis in UV-Visible frequency range also did not show any shift in the peaks.
The UV-Vis spectra are not shown here due to absence of significant observations. Thus in this study,
no suggestion of chemical interaction of As with soapnut was obtained. However, earlier works
suggested complexation of saponin molecule with heavy metals (Hong et al., 2002; Song et al., 2008).
A mechanism for arsenic removal by nonionic soapnut can be proposed as in Fig 7. The nonionic
surfactant gets adsorbed onto the soil surface and gets attached to the arsenic by physical force.
Arsenic which is in turn adsorbed on soil particle gets detached and goes into the solution and
Fig. 6. FT-IR spectra of soapnut solutions before and after washing
[image:21.595.77.349.373.720.2]Conclusions
The performance of 1% soapnut solution reached an efficiency of 86% of the performance of 20 mM
solution of anionic SDS both in low and high-contaminated soil in down-flow and suction modes.
Considering the fact that soapnut is non-ionic, this performance is satisfactory. Arsenic desorption
was found to occur mostly by micellar solubilisation following first order kinetics. The low
contaminated soil column in suction mode had higher rate constants. A model was proposed for As
desorption from each PV by Design expert software and the data fits were satisfactory indicating
robustness of the experimental observations. The As removal during initial PVs were high, whilst it
decreased during the later PVs in agreement with published literature (Roy et al., 1995). The
performance of extractant solutions was similar in both down-flow and suction modes. Suction mode
generated up to 50% less pressure inside the column and was more advantageous than the traditional
down-flow mode, which experienced significant pore clogging, and air bubble entrapment (Roy et
al., 1995). Zeta potential measurements confirmed very weak ionic charge in the hydrophobic tails of
soapnut molecules, thus eliminating the ionic interaction mechanism behind As removal by soapnut.
Absence of any chemical structure change in the soapnut solution, as evident from the FT-IR and
UV-Vis spectra, opens up the possibility of reusing the same soapnut solution after separation of As
from the wash liquid. A mechanism for As desorption has also been proposed. From economic
perspective, it is estimated that soapnut will cost exactly like SDS under similar conditions of
washing.
Acknowledgements
The authors acknowledge the funding provided by University of Malaya, Kuala Lumpur (Project No:
PV102-2011A and UM-QUB6A-2011) for carrying out this research. Miss Sumona Mukherjee from
University of Malaya and Miss Antonia O’Neill from the Environmental Engineering Research
REFERENCES
Alam, M G M, Tokunaga, S, Maekawa, T, 2001. Extraction of arsenic in a synthetic arsenic-contaminated soil using phosphate. Chemosphere 43: 1035-1041.
Antony, J, 2003. Design of Experiments for Engineers and Scientists. Butterworth-Heinemann, New York.
Chapman, H D, 1965. Cation-exchange capacity. Agronomy.
Chappell, J, Chiswell, B, Olszowy, H, 1995. Speciation of arsenic in a contaminated soil by solvent extraction. Talanta 42: 323-329.
Chen, W-J, Hsiao, L-C, Chen, K K-Y, 2008. Metal desorption from copper(II)/nickel(II)-spiked kaolin as a soil component using plant-derived saponin biosurfactant. Process Biochemistry 43: 488-498.
Cheng, H, Hu, Y, Luo, J, Xu, B, Zhao, J, 2009. Geochemical processes controlling fate and transport of arsenic in acid mine drainage (AMD) and natural systems. Journal of Hazardous materials 165: 13-26.
Chowdhury, S R, Yanful, E K, 2010. Arsenic and chromium removal by mixed magnetite–maghemite nanoparticles and the effect of phosphate on removal. Journal of Environmental Management 91: 2238-2247.
Craw, D, 2005. Potential anthropogenic mobilisation of mercury and arsenic from soils on mineralised rocks, Northland, New Zealand. Journal of Environmental Management 74: 283-292. Dobran, S, Zagury, G J, 2006. Arsenic speciation and mobilization in CCA-contaminated soils: Influence of organic matter content. Science of The Total Environment 364: 239-250.
Dwarakanath, V, Kostarelos, K, Pope, G A, Shotts, D, Wade, W H, 1999. Anionic surfactant remediation of soil columns contaminated by nonaqueous phase liquids. Journal of Contaminant Hydrology 38: 465-488.
Hernández-Soriano, M d C, Degryse, F, Smolders, E, 2011. Mechanisms of enhanced mobilisation of trace metals by anionic surfactants in soil. Environmental Pollution 159: 809-816.
Hong, K-J, Tokunaga, S, Kajiuchi, T, 2002. Evaluation of remediation process with plant-derived biosurfactant for recovery of heavy metals from contaminated soils. Chemosphere 49: 379-387. Jacobs, L W, Syers, J K, Keeney, D R, 1970. Arsenic Sorption By Soils. Soil Science Society of America Journal 34: 750-754.
Jang, M, Hwang, J S, Choi, S I, 2007. Sequential soil washing techniques using hydrochloric acid and sodium hydroxide for remediating arsenic-contaminated soils in abandoned iron-ore mines.
Chemosphere 66: 8-17.
Jang, M, Hwang, J S, Choi, S I, Park, J K, 2005. Remediation of arsenic-contaminated soils and washing effluents. Chemosphere 60: 344-354.
Ko, I, Chang, Y-Y, Lee, C-H, Kim, K-W, 2005. Assessment of pilot-scale acid washing of soil contaminated with As, Zn and Ni using the BCR three-step sequential extraction. Journal of Hazardous materials 127: 1-13.
Ko, S-O, Schlautman, M A, Carraway, E R, 1998. Effects of Solution Chemistry on the Partitioning of Phenanthrene to Sorbed Surfactants. Environmental Science & Technology 32: 3542-3548. Kommalapati, R R, Valsaraj, K T, Constant, W D, Roy, D, 1997. Aqueous solubility enhancement and desorption of hexachlorobenzene from soil using a plant-based surfactant. Water Research 31: 2161-2170.
Kommalapati, R R, Valsaraj, K T, Constant, W D, Roy, D, 1998. Soil flushing using colloidal gas aphron suspensions generated from a plant-based surfactant. Journal of Hazardous materials 60: 73-87.
Lu, P, Zhu, C, 2011. Arsenic Eh–pH diagrams at 25°C and 1 bar. Environmental Earth Sciences 62: 1673-1683.
Mulligan, C N, 2005. Environmental applications for biosurfactants. Environmental Pollution 133: 183-198.
Mulligan, C N, Wang, S, 2006. Remediation of a heavy metal-contaminated soil by a rhamnolipid foam. Engineering Geology 85: 75-81.
Mulligan, C N, Yong, R N, Gibbs, B F, 2001. Heavy metal removal from sediments by biosurfactants. Journal of Hazardous materials 85: 111-125.
Mulligan, C N, Yong, R N, Gibbs, B F, James, S, Bennett, H P J, 1999. Metal Removal from Contaminated Soil and Sediments by the Biosurfactant Surfactin. Environmental Science & Technology 33: 3812-3820.
Nash, J H, 1987. Field Studies of In-Situ Soil Washing, EPA/600/2-87/110. U.S. Environmental Protection Agency, Cincinnati, Ohio.
Nordin, M Y, Venkatesh, V C, Sharif, S, Elting, S, Abdullah, A, 2004. Application of response surface methodology in describing the performance of coated carbide tools when turning AISI 104 steel. Journal of Materials Processing Technology 145: 46-58.
Oorts, K, Ghesquiere, U, Smolders, E, 2007. Leaching and aging decrease nickel toxicity to soil microbial processes in soils freshly spiked with nickel chloride. Environmental Toxicology and Chemistry 26: 1130-1138.
Polettini, A, Pomi, R, Calcagnoli, G, 2009. Assisted Washing for Heavy Metal and Metalloid Removal from Contaminated Dredged Materials. Water, Air, & Soil Pollution 196: 183-198.
Pradhan, M, Bhargava, P, 2008. Defect and microstructural evolution during drying of soapnut-based alumina foams. Journal of the European Ceramic Society 28: 3049-3057.
Raatz, S, Härtel, G, 1996. Application of surfactant combinations for cleaning clays contaminated with polycyclic aromatic hydrocarbons. Anwendung von tensidkombinationen zur reinigung PAK-kontaminierter tone 37: 57-62.
Roy, D, Kommalapati, R R, Mandava, S, Valsaraj, K T, Constant, W D, 1997. Soil washing potential of a natural surfactant. Environmental Science and Technology 31: 670-675.
Roy, D, Kommalapati, R R, Valsaraj, K T, Constant, W D, 1995. Soil flushing of residual transmission fluid: application of colloidal gas aphron suspensions and conventional surfactant solutions. Water Research 29: 589-595.
Sivasubramaniam, S, Talibudeen, O, 1972. Potassium-aluminium exchange in acid soils I. Kinetics. Journal of Soil Science 23: 163-176.
Smedley, P L, Kinniburgh, D G, 2002. A review of the source, behaviour and distribution of arsenic in natural waters. Applied Geochemistry 17: 517-568.
Song, S, Zhu, L, Zhou, W, 2008. Simultaneous removal of phenanthrene and cadmium from contaminated soils by saponin, a plant-derived biosurfactant. Environmental Pollution 156: 1368-1370.
Sparks, D L, Zelazny, L W, Martens, D C, 1980. Kinetics of potassium desorption in soil using miscible displacement. Soil Science Society of America Journal 44: 1205-1208.
Storer, D A, 1984. A simple high sample volume ashing procedure for determining soil organic matter. Communications in Soil Science and Plant Analysis 15: 759-772.
Suhagia, B N, Rathod, I S, Sindhu, S, 2011. Sapindus Mukorossi (Areetha): An Overview. International Journal of Pharmaceutical Sciences and Research 2: 1905-1913.
Sundstrom, D W, Weir, B A, Klei, H E, 1989. Destruction of aromatic pollutants by UV light catalyzed oxidation with hydrogen peroxide. Environmental Progress 8: 6-11.
Tokunaga, S, Hakuta, T, 2002. Acid washing and stabilization of an artificial arsenic-contaminated soil. Chemosphere 46: 31-38.
Torres, L G, Lopez, R B, Beltran, M, 2012. Removal of As, Cd, Cu, Ni, Pb, and Zn from a highly contaminated industrial soil using surfactant enhanced soil washing. Physics and Chemistry of the Earth, Parts A/B/C 37–39: 30-36.
Wang, S, Mulligan, C N, 2009a. Arsenic mobilization from mine tailings in the presence of a biosurfactant. Applied Geochemistry 24: 928-935.
Wang, S, Zhao, X, 2009. On the potential of biological treatment for arsenic contaminated soils and groundwater. Journal of Environmental Management 90: 2367-2376.
Wasay, S A, Haron, M J, Tokunaga, S, 1996. Adsorption of fluoride, phosphate, and arsenate ions on lanthanum-impregnated silica gel. Water Environment Research 68: 295-300.
Weng, H, Liu, Y, Chen, H, 1997. Environmental geochemical features of arsenic in soil in China. Journal of Environmental Sciences (China) 9: 385-395.
Yamaguchi, N, Nakamura, T, Dong, D, Takahashi, Y, Amachi, S, Makino, T, 2011. Arsenic release from flooded paddy soils is influenced by speciation, Eh, pH, and iron dissolution. Chemosphere 83: 925-932.
Yang, J-S, Lee, J Y, Baek, K, Kwon, T-S, Choi, J, 2009. Extraction behavior of As, Pb, and Zn from mine tailings with acid and base solutions. Journal of Hazardous materials 171: 443-451.
Appendix
Table A1. Factorial design matrix of four variables along with experimental and predicted responses
for As removal
Diagnostics Case Statistics for As removal (Transform: Square root, Constant: 0.000)
Run No A: Wash Solution B: Washing Mode C: Soil contamination D: Pore Volume
Square root of values Observed Predicted Residual
1 Water D High PV1 0.32 0.48 -0.16
2 SN 0.5% D High PV1 2.92 2.92 -0.01
3 SN 1% D High PV1 3.86 3.68 0.18
4 SDS 20 mM D High PV1 3.52 3.71 -0.19
5 Water S High PV1 0.32 0.11 0.21
6 SN 0.5% S High PV1 2.55 2.55 0.00
7 SN 1% S High PV1 3.30 3.31 -0.01
8 SDS 20 mM S High PV1 3.32 3.34 -0.02
9 Water D Low PV1 0.84 1.04 -0.21
10 SN 0.5% D Low PV1 3.63 3.49 0.15
11 SN 1% D Low PV1 4.45 4.24 0.21
12 SDS 20 mM D Low PV1 4.30 4.27 0.03
13 Water S Low PV1 0.84 0.67 0.16
14 SN 0.5% S Low PV1 2.98 3.12 -0.13
15 SN 1% S Low PV1 3.49 3.87 -0.38
16 SDS 20 mM S Low PV1 4.07 3.90 0.17
17 Water D High PV2 0.55 0.70 -0.16
18 SN 0.5% D High PV2 2.21 1.96 0.26
19 SN 1% D High PV2 2.45 2.48 -0.03
20 SDS 20 mM D High PV2 3.07 2.97 0.09
21 Water S High PV2 0.55 0.89 -0.34
22 SN 0.5% S High PV2 2.28 2.14 0.14
23 SN 1% S High PV2 2.49 2.66 -0.17
24 SDS 20 mM S High PV2 3.36 3.16 0.20
25 Water D Low PV2 1.05 0.71 0.34
26 SN 0.5% D Low PV2 1.61 1.96 -0.35
27 SN 1% D Low PV2 2.68 2.48 0.20
28 SDS 20 mM D Low PV2 2.63 2.98 -0.35
29 Water S Low PV2 1.05 0.89 0.16
30 SN 0.5% S Low PV2 2.10 2.15 -0.05
31 SN 1% S Low PV2 - -
-32 SDS 20 mM S Low PV2 3.22 3.17 0.06
33 Water D High PV3 1.00 0.94 0.06
34 SN 0.5% D High PV3 1.76 1.75 0.01
35 SN 1% D High PV3 1.97 2.27 -0.29
36 SDS 20 mM D High PV3 2.92 2.72 0.19
37 Water S High PV3 1.00 1.15 -0.15
38 SN 0.5% S High PV3 2.10 1.97 0.13
39 SN 1% S High PV3 2.85 2.48 0.36
40 SDS 20 mM S High PV3 2.63 2.94 -0.31
41 Water D Low PV3 1.05 0.90 0.15
42 SN 0.5% D Low PV3 1.58 1.71 -0.13
43 SN 1% D Low PV3 2.19 2.23 -0.04
44 SDS 20 mM D Low PV3 2.74 2.69 0.05
45 Water S Low PV3 1.05 1.11 -0.06
Diagnostics Case Statistics for As removal (Transform: Square root, Constant: 0.000)
Run No A: Wash Solution B: Washing Mode C: Soil contamination D: Pore Volume
Square root of values Observed Predicted Residual
47 SN 1% S Low PV3 2.41 2.44 -0.03
48 SDS 20 mM S Low PV3 2.97 2.90 0.07
49 Water D High PV4 1.18 0.96 0.22
50 SN 0.5% D High PV4 1.48 1.44 0.05
51 SN 1% D High PV4 1.76 2.07 -0.31
52 SDS 20 mM D High PV4 2.07 2.26 -0.18
53 Water S High PV4 1.18 1.05 0.13
54 SN 0.5% S High PV4 1.58 1.53 0.05
55 SN 1% S High PV4 2.26 2.16 0.10
56 SDS 20 mM S High PV4 2.28 2.35 -0.07
57 Water D Low PV4 1.14 1.27 -0.13
58 SN 0.5% D Low PV4 1.61 1.75 -0.13
59 SN 1% D Low PV4 2.45 2.38 0.07
60 SDS 20 mM D Low PV4 2.98 2.57 0.42
61 Water S Low PV4 1.14 1.36 -0.22
62 SN 0.5% S Low PV4 1.87 1.84 0.03
63 SN 1% S Low PV4 2.61 2.47 0.14
64 SDS 20 mM S Low PV4 2.49 2.66 -0.17
65 Water D High PV5 1.05 0.96 0.09
66 SN 0.5% D High PV5 1.18 1.41 -0.23
67 SN 1% D High PV5 2.00 1.90 0.10
68 SDS 20 mM D High PV5 2.43 2.06 0.37
69 Water S High PV5 1.05 1.05 0.00
70 SN 0.5% S High PV5 1.58 1.50 0.08
71 SN 1% S High PV5 1.73 1.99 -0.26
72 SDS 20 mM S High PV5 2.00 2.15 -0.15
73 Water D Low PV5 1.00 1.00 0.00
74 SN 0.5% D Low PV5 1.22 1.45 -0.23
75 SN 1% D Low PV5 2.10 1.94 0.16
76 SDS 20 mM D Low PV5 1.84 2.10 -0.26
77 Water S Low PV5 1.00 1.09 -0.09
78 SN 0.5% S Low PV5 1.92 1.54 0.38
79 SN 1% S Low PV6 2.41 2.08 0.33
80 SDS 20 mM S Low PV5 2.24 2.19 0.04
81 Water D High PV6 0.77 0.69 0.08
82 SN 0.5% D High PV6 1.34 1.20 0.14
83 SN 1% D High PV6 1.64 1.59 0.05
84 SDS 20 mM D High PV6 1.92 2.24 -0.31
85 Water S High PV6 0.77 0.82 -0.05
86 SN 0.5% S High PV6 1.45 1.33 0.12
87 SN 1% S High PV6 1.79 1.72 0.07
88 SDS 20 mM S High PV6 2.26 2.36 -0.10
89 Water D Low PV6 1.10 1.05 0.05
90 SN 0.5% D Low PV6 1.45 1.55 -0.10
91 SN 1% D Low PV6 1.84 1.95 -0.11
92 SDS 20 mM D Low PV6 2.79 2.59 0.20
93 Water S Low PV6 1.10 1.18 -0.08
94 SN 0.5% S Low PV6 1.52 1.68 -0.16
95 SN 1% S Low PV6 1.73 2.08 -0.34
96 SDS 20 mM S Low PV6 2.93 2.72 0.21
Table A2: Time and corresponding percentage of As remaining in soil column (Ast)
D, L D, H
time H2O SN 0.5% SN 1% SDS H2O SN 0.5% SN 1% SDS
10 99.3 99.9
15 98.2 86.8 99.6 91.5
20 97.1 98.6
25 95.8 81.5 97.2 87.6
30 94.8 84.2 80.2 96.1 86.6 85.1
35 74.6 78.2
40 93.6 95.5
50 81.7 83.5
55 73 67.1 79.1 69.7
65 79.1 81.3
80 77.6 79.9
90 68.2 75.2
95 75.5 78.1
100 58.2 65.4
110 62.2 72.1
120 54.8 59.5
130 57.8 68.1
155 47 55.8
170 54.4 65.4
S, L S, H
time H2O SN 0.5% SN 1% SDS H2O SN 0.5% SN 1% SDS
10 99.3 99.9
15 98.2 91.1 83.4 99.6 93.5 89
16 97.1 98.6
20 95.8 97.2
21 94.8 96.1
25 93.6 86.7 87.8 73 95.5 88.3 89.1 77.7
27.5 74.7 82.9
30 64.2 70.8
35 83 68.9 83.9 74.8
37.5 79.5 81.4
40 58 65.6
42.5 75.8 78.9
50 73.5 62.1 76.8 69.7
60 53 61.6
65 56.3 66.7
70 44.4 56.5
Fig A1: Interaction graph for sqrt(As removal) vs PV for all the extractants (a) D,H (b) D,L (c) S,H
Fig A2: Normal probability plots of residuals for As removal in each PV
[image:30.595.79.317.435.684.2]