Technology (IJRASET)
Forecasting of Cotton Area, Production and
Productivity using Trend analysis
M. Sundar Rajan 1, M. Palanivel2, S. Kalai mohan3 1
PhD Research Scholar, Department of Statistics, Govt. Arts College, Udumalpet, Affiliated to Bharathiar University, Tamil Nadu, India – 642 126.
2,
Assistant Professor, Department of Statistics, Govt. Arts College, Coimbatore, Affiliated to Bharathiar University, Tamil Nadu, India – 641 018.
3
PhD Research Scholar, Department of Ecology and Environmental Sciences, Pondicherry University, Pudhucherry, India- 605 014.
Abstract— The retrospective study was conducted to check the trend analysis of area, production and Productivity for Cotton in Tamil Nadu. The findings of the study are based on data during the years (1970 to 2012). Three Models of trend analysis were applied .The models were Linear Trend Model, Quadratic Trend Model and Cubic Trend Model. In the present study was forecasting model for next eight year of area, production and productivity for the cotton were estimated. The exploration of forecasted period from 2013 to 2020 was presented. The best fitted selected model forecasted an area of 1.138(lakh.ha) from 2.083(lakh.ha), production is of about 4.404(lakh.bales) from 5.151(lakh bales) and finally productivity of 981(Kg/ha) from 1370(Kg/ha) respectively were estimated for the years 2013-20. Forecast values are very close to actual values and have positively increased is due to availability of cotton crops in Tamil Nadu.
Keywords: Trend Model, Area, Production, Productivity, Residual Sum of Square, Mean Square Error
I. INTRODUCTION
Cotton is an important cash crop and India cultivates the highest acreage in the world. It provides the basic raw material (cotton fibre) to the cotton textile industry. Cotton also known as ‘White Gold’ dominates India’s cash crops, and makes up 65 per cent of the raw material requirements of the Indian textile. World cotton production is estimated at 118.95 million bales of 480 lb in 2012‐13 (USDA, February, 2013) which is 4 % less than the previous year 2011‐12 and cotton area to the tune of 4.62%. India continued to maintain the largest area under cotton and second largest producer of cotton next to china with 34 % of world area and 21% of world production. Significant drop in the production level in Brazil about 43% due to 40%reduction in area under cotton compared to previous year. Though there is reduction of 3.41% of area under cotton in United States, there is increase of 7.85% in cotton production compared to 2011‐12. China is going to be the largest importer around 14 million bales of Cotton this year and share of 34% of the world total cotton imports. Among the major cotton growing countries, Australia tops the productivity level of 2055 kg/ha followed by Brazil and Turkey (1415 kg/ha). The major cotton growing states in India are Punjab, Haryana, Rajasthan, Madhya Pradesh, Gujarat, Maharashtra, Andhra Pradesh, Tamil Nadu and Karnataka.
Technology (IJRASET)
1) To study the trend and growth of area, production and productivity of Cotton in Tamil Nadu.
2) To examine the contribution of area, production and productivity both are increasing the magnitude for the cotton crop.
II. MATERIAL AND METHODS
The present study has been conducted at Tamil Nadu state in India. Cotton crop secondary data on area during the 1980-11 to 2011-2012 were collected from Cotton Corporation of India (CCI). In his study using different trend growth models are studied for the purpose of estimating the growth rate and fitted the best model, which will help in better future prediction. Data was analyzed by using Zaitun software. Subsequently, goodness of fit statistics, viz. highest R, R2 and smaller Residual Sum of Square and Mean Square Error were also measures indicate a good fitted model with forecasting comparison of the models.
A. Various goodness of fit of Trend analysis Models
The following measure of goodness of fit vis-a-via comparison among different competing model developed. The goodness of fit is
examined by using the co-efficient of determination
(
R
2)
.Kvalseth [8] examined the different forms of(
R
2)
available in the literature. 2 2 2)
(
)
ˆ
(
1
y
y
y
y
R
i
i
i
This is most appropriate for nonlinear statistical model. It would be used as the coefficient of determination for fit. The potential range of values of this
R
2is well defined with end points corresponding to perfect fit and complete lack of fit, such as,
1
0
R
2
whereR
2
1
corresponds to perfect fit andR
2
0
for any reasonable model specification.B. Residual Sum of Square (RSS)
2 1
))
(
(
i n i ix
y
RSS
C. Mean Square Error (MSE)
(
X
X
ˆ
)
2/(
n
p
)
MSE
(MSE = Mean Square Errors = Error Mean Square = Residual Mean Square)
[image:3.612.34.526.553.687.2]Here
n
is the total number of observed values andp
denotes the number of model parameters. These values are smaller of MSE and RSS better the model. Residual sum of square (RSS) is also known as the sum of square residuals (SSR) or sum of squared errors (SSE) of prediction. It is an amount of the difference between data and an estimated model. Where
the estimated value of the constant is term
and
is the estimated value of the slope coefficientb
.TABLE 1: IMPROVING STATISTICAL MODELS TO STUDY THE GROWTH MODELS ESTIMATED OF COTTON CULTIVATED AREA, PRODUCTION AND PRODUCTIVITY
Models Equations Explanation
Linear
Y
t
b
0
b
1t
Y andt
i is area and time period respectively,b
0
b
iisconstants to be an estimated.
Quadratic
Y
t
b
0
b
1t
b
2t
2Y and
t
i is area and time period respectively,b
0
b
iis constants to be an estimated. The quadratic model can be used to model a series that takes off” or a series that dampens.Cubic
Y
t
b
0
b
1t
b
2t
b
3t
3 Y andt
i is area and time period respectively,b
0
b
iisTechnology (IJRASET)
III. RESULT AND DISCUSSION
This section deals with time series data and estimated trends in Tables and Figures form of Cotton area, production and productivity in Tamil Nadu state.
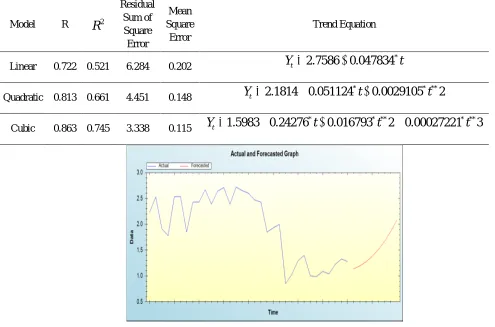
[image:4.612.42.537.181.508.2]The results revealed that all the values of accuracy measures are highest and smaller in cubic trend model Table 2 (a,b,c)), was selected for forecasting the future trends (Table 3) of cultivated area, production and productivity in Tamil Nadu on the basis of smaller values of accuracy measures.
Table 2a: Growth models of area of Cotton crop in Tamil Nadu State
Model R 2
R
Residual Sum of Square Error Mean Square Error Trend EquationLinear 0.722 0.521 6.284 0.202
Y
tt
*
047834
.
0
7586
.
2
Quadratic 0.813 0.661 4.451 0.148
2
.
1814
0
.
051124
0
.
0029105
2
* * * *
t
t
Y
t
Cubic 0.863 0.745 3.338 0.115
1
.
5983
0
.
24276
0
.
016793
2
0
.
00027221
3
* * * * * * *
t
t
t
Y
t
[image:4.612.38.538.560.707.2]Fig.1 The selected model designed for actual and forecasted plot in favor of cotton crop area
TABLE 2B: GROWTH MODELS OF PRODUCTION OF COTTON CROP IN TAMIL NADU STATE
Model R 2
R
Residual Sum of Square Error Mean Square Error Trend EquationLinear 0.290 0.084 31.608 1.019
Y
tt
*
031213
.
0
0948
.
4
Quadratic 0.664 0.441 19.316 0.644
2
.
6001
0
.
28746
0
.
0075365
2
* * * *
t
t
Technology (IJRASET)
Fig.2 The selected model designed for actual and forecasted plot in favor of cotton crop production
TABLE 2C: TREND GROWTH MODELS OF PRODUCTIVITY OF COTTON CROP IN TAMIL NADU STATE
Model R 2
R
Residual Sum of Square Error
Mean Square Error
Trend Equation
Linear 0.913 0.834 260074.3 8389.4
Y
tt
*
891
.
20
43
.
122
Quadratic 0.948 0.899 157373.1 5245.7
259
.
06
2
.
5309
0
.
68887
2
* * * *
t
t
Y
t
Cubic 0.949 0.900 156873.1 5409.4
246
.
7
1
.
5304
0
.
39466
2
0
.
0057689
3
* * * *
* * *
t
t
t
[image:5.612.51.560.335.713.2]Technology (IJRASET)
Fig.3 The selected model designed for actual and forecasted plot in favor of cotton crop productivity
TABLE 3: PROJECTIONS OF AREA, PRODUCTION AND PRODUCTIVITY OF COTTON CROP IN TAMIL NADU STATE
Year Area
(lakh.ha)
Production (lakh.bales)
Productivity (Kg/ha)
2013 1.138 4.404 981
2014 1.194 4.433 1031
2015 1.274 4.485 1082
2016 1.379 4.561 1135
2017 1.510 4.664 1191
2018 1.671 4.795 1248
2019 1.861 4.957 1308
2020 2.083 5.151 1370
Shown in Table 3 results clearly revealed that there is positive increasing trend for area, production and productivity in Tamil Nadu.
III. CONCLUSION
The present study was regression parameter for estimating area of cultivated cotton crop Area, Production and Productivity in Tamil Nadu state India. In our study the developed regression model for cotton cultivated was found to be best fitted cubic regression model respectively. Highest
R
2was obtained in cotton area (74 %) production (49%) and productivity (90%) was obtained even asR
value also highest. The lowest residual sum square and mean square error was the selected for minimum value was obtained Table 2(a,b,c). The future projections of area, production and productivity of Cotton in Tamil Nadu by 2020 were calculated. The projection values were area 2.083(lakh.ha), production 5.151(lakh.bales) and productivity 1370(Kg. /ha). These measures were found to be the best fitted model for projection (Table 3). The authority of the forecasted value can be checked when the data for the lead periods become available.REFERENCES
[1] Ayesha Tahir and Nusrat Habib, 2013, forecasting of maize area and production in Pakistan. ESci J. Crop Prod. 02 (02). 44-48.
[2] Borthakur.S and B.K.Bhattacharyya 1998, Trend analysis of Area, Production and Productivity of Potato in Assam 1951-1993,Economic Affairs. Vol.43. Qr, 4. [3] Dhakre and Amod Sharma. 2009. Growth and instability analysis of ginger production in North-east: region. Agricultural Situation in India. 463-465.
[4] D.P.Sing et al., 2014, Developing statistical models to study the growth rates of paddy crops in different districts of chattisgarh, American International Journal of Research in Formal, Applied & Natural Science. 5(1),102-104.
[5] Finger, R., 2007. Evidence of slowing yield growth the example of swiss cereal yield. Agri-Food and Agri-Environmental Economics Group, ETH Zurich, Switzerland.
[6] Hussaini. Mairiga, 2014, Trend Analysis of Productivity of Some Selected Cereal Crops in Nigeria: 1983-2008.Tahir, Research on Humanities and Social Sciences.Vol.4, No.8, 2014.
[7] Karim, M.R., M.A. Awal and M. Akter, 2010. Forecasting of wheat production in Bangladesh. Bangladesh J. Agric. Res., 35: 17-28.
[8] Kvalseth, T.O. (1985). Cautionary note about
(
R
2)
, Amer.Statistician, 39, 279-85.[9] Rimi, R.H., S.H. Rahman, S. Karmakar and S.G. Hussain, 2009. Trend analysis of climate change and investigation on its probable impacts on rice production at Sathkhira, Bangladesh.Pak. J. Meteorol., 6:37-50.
[image:6.612.137.478.123.278.2]