2016 International Conference on Artificial Intelligence and Computer Science (AICS 2016) ISBN: 978-1-60595-411-0
Analysis of EDM Pulsed Energy Denoise Process and Its Mutation
Characteristic Using Wavelet Packet and S-transform
Xin-kai LIAN
1, Jin-quan LIU
1, Jian ZHUANG
3and Meng ZHOU
4,*1Xuji Group, Xuchang City, Henan Prov, China
3State Grid Tianjin Electric Power Company, Tianjin City, China
4 School of Electrical Engineering Wuhan University, Wuhan City, Hubei Prov, China *Corresponding author
Keywords: Electric discharge machine (EDM), S-transform, Wavelet packet, Filter, Time-frequency analysis.
Abstract. In this paper, the load of electro discharge machining (EDM) is used to extract the mutation characteristics of pulse energy. In this paper, different wavelet basis functions and thresholds are used to denoise the electrical load characteristics of EDM, and the wavelet denoising function and threshold for different practical situations are obtained, which provide the basis for pulse power quality analysis. What’s more, a method to identify the impulsive power quality mutation information based on S-transform is proposed, which realizes the automatic recognition of power quality during EDM operation, and the extraction accuracy is high.
Introduction
EDM corrodes the metal on work surface by energy form pulse discharge corona so that it can realize the processing technical design requirements [1,2]. The energy that can get back to its initial
state quickly when the load mutates in a short time is called pulsed energy. The voltage or current signal of pulsed energy has non-sinusoidal rule with mutation feature and contains complicated noise which can affect electrical power quality. As the requirements of power-net quality improved constantly, pulsed energy becomes a type of load which attracts more and more concerns in power grid. The study on EMD pulsed source is mainly about source control design but not much about analysis and process of load characteristic and pulsed energy quality now [3,4,5].
The output and input of pulsed energy are not isolated. And its voltage or current has mutation characteristic. Therefore, pulsed energy has a great influence on the power quality. The noise must be filtered in the engineering. Besides, mutation parameter is also a vital technological parameter in industrial production. It is important to engineering application and must be extracted efficiently.
Nowadays, analyzing and extracting the feature information in power quality filed has made series achievements [6]. Wavelet-transform is a mature time-frequency domain resoluter in signal
processing now. It can resolve the signal information in time domain and frequency domain in the meantime and identify the noise in the signal. S-transform has avoided the choice of wavelet basis and overcome the defect of fixed STFT window duration. It has become a main method of power energy analysis in recent years. The paper has studied the de-noise processing method for electric spark signal based on wavelet packet. And it also has explored ways for other pulsed energy data analysis by using S-transform to extract the mutation feature information of pulsed energy.
Wavelet Packet Filter Wavelet Packet Theory
The idea of wavelet-transform is using a set of base functions to approach and multiple the original signal immortally. The base functions are called wavelet functions [7]. They have specific features:
It can improve frequency resolution increasingly. The study object in this paper is a group of measured electric spark data. We can allocate the signal to any band by a set of high pass and low pass orthogonal filters.
Wavelet Packet Filter Algorithm
In decomposition process of wavelet packet, the count of electric spark data will halve as the layer increase. Suppose that the length of electric spark data is 2N (the length of measured data in this
paper is N=10), the number of decomposition times is L and the count of electric spark data in any band is 2N-L. Based on the algorithm, the paper resolved the electric spark measured data into
relevant band orthogonally using the feature that wavelet packet can resolve data in any resolution. According to the traditional method of signal analysis, reconstitute any one or more sequences from wavelet packet decomposition. After reconstitution, the length of electric spark signal is still 2N.
And the signal has the advantages of narrow band width, high SNR and so on.
The implementation process of wavelet packet filter algorithm for electric spark data: (1) The study selects orthogonal filter hk with gk=(-1)k-1h1-k.
(2) Determine the decomposition layers N, N>0. If the length of original electric spark signal f
iis 2N and the sampling frequency is f
s , N should be less than L. The bandwidth of any sequence in Lth layer is fs/2L+1. Starting frequency is fn=(n-1)fs/2L+1. Default value of decomposition layers is L=3 in this paper.
(3) The information of frequency spectrum and the original frequency of each sequences after decomposition can be acquired by traditional analysis method. Then figure out which frequency band of Lth layer grid base frequency is in and denoted as {p1, p2, …, pn}.
(4) Resolve the electric spark data layer by layer using wavelet packet. After decomposition, any Lth layer contains 2L-1 groups of sequences which are in different frequency bands. Every group of
sequence consists the low-pass filtering result and high-pass filtering result. Its length is N/2L-1. We
can get the recursion formula with d k0( ) f k( ), hh*n,
*
n g g :
2 1
2 1
j k m j
m z
j k m j
m z
d k h d m
c k g d m
(1)
In formula (1), j=0,1,...,L; k=0,1,...,(N/2L-1)-1.
(5) Setting formula(2)
1 1 1 1 1 1 1 1 N N N 0 N 0j j n
j j n
j n
j n
d k d k j p p p c k c k j p p p
d k j p p p
c k j p p p
, , , , , , , , , , , , (2)
we can get the new sequences Ndj(k), Ncj(k).
(6) Establish reconstitution signal by reconstitution formula (3):
1 1 2 1 2
j j j
k z
d l d k h l k c k g l k
(3)Wavelet Packet Filter Analysis
Harmonic interference affects the power quality seriously and also influence the result of signal process [8,9,10]. Based on wavelet packer transform, this paper has studied the realization of de-noise.
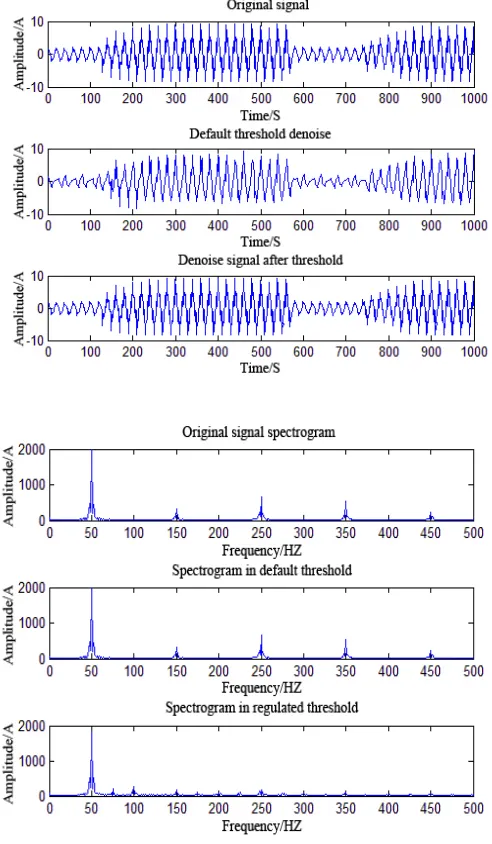
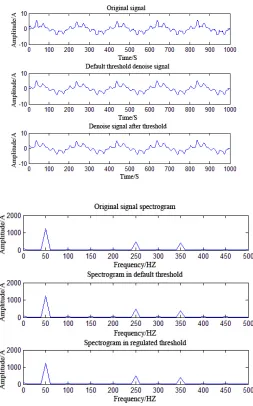
It is in the foundation of three layers’ noise coefficient based on different wavelet basis functions. Take one group of measured electric spark signal for example. The sampling length is N=1k. The
sampling frequency is fs=1kHz. The rated frequency of the signal is 50HZ. The result of calculation and analysis is showed in figure 1 to 3.
[image:3.612.169.436.179.602.2]
Figure 3. Bior4.4 wavelet decomposition of electric spark 10A signal.
From figure 1 to 3, we can see:
(1) The filtering effect of db2 wavelet for electric spark 50A signal is not as good as bior4.4. But db2 wavelet can do better in keeping frequency.
(2) Considering the bior4.4 wavelet's influence on electric spark de-noise in different threshold, the waveform in default threshold is not as good as in regulative threshold. But the waveform in default threshold has filtered the influence of another harmonic out.
(3) Bior4.4 wavelet has different filtering ability as it bases different electric spark signal.
To sum up, it can't meet the engineering requirement using only one way to denoise electric spark signal. For high-current pulsed electric spark signal, we can filter higher harmonics by db2 wavelet in default threshold. And then eliminate noise by bior4.4 wavelets in regulative threshold. As a result, the higher harmonic is filtered and the principal component of electric spark signal frequency spectrum can be saved in the meantime.
S-transform
they are also part of processing requirements for electric spark discharge. It can support discharge control for EDM. S-transform is widely used in power quality detection, identification and so on.
Based on S-transform, the paper has studied the single fluctuation of electric spark data, such as voltage or current swell, sag, arrest, transient, harmonic and other hybrid interference.
The S-transform S(τ,f) of signal x(t) is defined as:
, -
exp 2
S f x t w t f j ft dt
, (4)
exp 2
22 2
f f t
w t f
, (5)
In formula (2), w(τ-t,f) is Gaussian window; τis the time axis parameter to control Gaussian window. It can be seen from the formulas that both time axis and frequency axis of Gaussian window function can change over frequency, which function is produced by S-transform. It can improve the defect of fixed STFT window.
The signal x(t) can be reconstituted well by its S-transform S(τ,f). Its S inversion is:
-
-
,
exp 2
x t S f d j ft df
(6)From definition of S-transform, it can be seen that the result of S-transform is two-dimensional complex matrix. The column of matrix is the time of signal. The row of matrix is the frequency of signal. In matrix, the element's module is amplitude. The parameters that can be extracted from the two-dimensional complex matrix includes: row vector corresponding basic wave of electric signal (the change of basic wave amplitude ), constitution of signal frequency spectrum, incident feature of each frequency component, the variety range and duration time of signal basic wave.
Characteristic Analysis of Electric Spark Extracted Signal based on S-transform
EDM, act furnace and motor start can all result in voltage or current flicker. It could cause the abnormal operation of servo motor when serious [14,15]. Therefore, the key of this paper is the
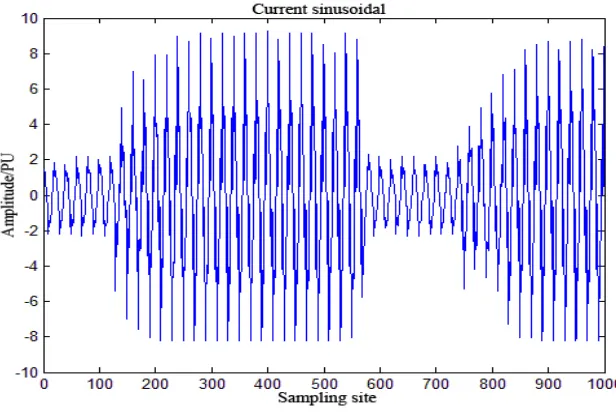
Figure 4. Measured electric spark signal.
[image:7.612.172.436.314.522.2]Figure 5. Amplitude frequency curve.
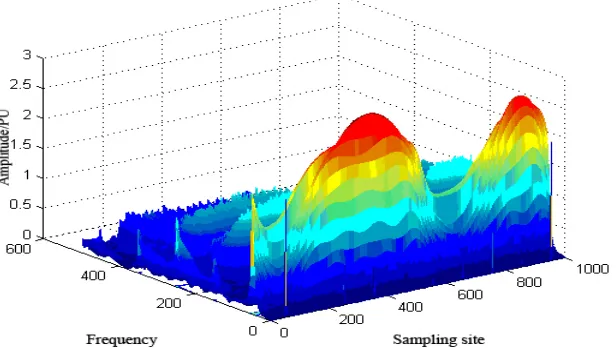
[image:7.612.164.443.564.733.2]Figure 7. Time frequency distribution curve.
From figure 4 and figure 5, we can see that the current swell and sag resulting from EDM start-stop and the two-dimensional curve of base frequency amplitude present the feature that matrix element's module value will fall and then rise or rise and then fall back along sampling interval.
From the three-dimensional (the three dimensions are time-frequency-amplitude) graphic of S-transform in figure 7, it can be seen that its abscissa correspond frequency and ordinate correspond sampling point. And the height of graphic correspond amplitude. According to the graphic, there is a high heave in frequency 50 Hz. And in this frequency, the amplitude curve present concave shape. We can see that S-transform has a great time-frequency analysis capability for electric spark signal. It can resolve the mutation characteristic of pulsed energy signal. Combined with figure 6, S-transformed result shows five ridges indicating that this harmonic contains high frequency harmonic and corresponding frequency clearly. In the amplitude-frequency curve graph, the frequency corresponding each peak value is frequency components of signal. We can get that the amplitude of base wavelet is 4.4 from the graph. The amplitude and frequency of third harmonic are 0.19 and 150Hz. Fifth harmonic are 0.55 and 250Hz.Seventh harmonic are 0.46 and 350Hz. It can get more accurate parameters from the graph.
Conclusions
Based on bior4.4 and db2 wavelet primary functions in default and regulative threshold, the paper has made a comparative analysis for electric spark signal de-noising effect and found the wavelet de-noising base functions and thresholds used in different conditions of electric spark signal. In addition to the local correlation of wavelet coefficient, it has applied the feature of electric spark signal noise and other power quality as well as the domain characteristic of wavelet transform. It can provide the basis for quality analysis of pulsed energy.
The paper has put forward the analysis and process method of time-domain characteristic based on S-transformed disturbance to electric spark signal. And it also has gotten each kind of mutation parameter index accurately. Moreover, this paper has realized the automatic identification of power quality in EDM operation and obtained better testing result. It has high accuracy and can provide the thought of characteristic study for other pulsed energy.
Acknowledgement
Reference
[1] Baoxian Jia, Wansheng Zhao, Zhenlong Wang, et al. Research on micro-EDM machine tool and its key technology [J]. Journal of Harbin Institute of Technology. 2006, 38(3): 401-405.
[2] Fengzhan Zhao, Rengang Yang. Power quality disturbances classification based on S-transform and time domain analysis [J]. Power System Technology. 2006, 8: 90-95.
[3] Weishi Man, Zhiyu Zhang. Fast S transform-based classification of power quality disturbance [J]. Journal of Xi'an Jiaotong University. 2013, 8: 133-140.
[4] Jiliang Yi. Analysis of power quality disturbances using S-transform [D]. Hunan University 2010.
[5] Shouliang Liu, Xianyong Xiao. Detection and classification of short duration power quality disturbance based on S-transform [J]. Xi'an Electric Technology. 2005, 08: 40-47.
[6] Shunfan He, Kaicheng Li and Ming Zhang, "A real-time power quality disturbances classification using hybrid method based on S-transform and dynamics", IEEE Transactions on Instrumentation and Measurement, vol. 62, no. 9, September. 2013.
[7] Yuhui Zhang, Xiaodong Chen. Continuous wavelet-based measuring and classification of short duration power quality disturbances [J]. Electric Power Automation Equipment. 2003, 6: 17-21. [8] Yonghai Due, Xiangning Xiao. Application of wavelet transform in power quality analysis [J]. Automation of Electric Power Systems. 1999, 12: 55-58.
[9] S. Santoso, E. J. Powers, W. M. Grady and P. Hofmann, "Power quality assessment via wavelet transform analysis", IEEE Trans. Power Del., vol. 11, pp.924-930, 1996.
[10] Xiangbin Meng. Research and implementation of power system short-term load forecasting based on wavelet analysis [M]. Dalian University of Technology. 2008.
[11] Shuhua Xia. Research on power quality denoising based on wavelet transform [J]. Computer Similation. 2011, 04: 332-335.
[12] Daichun Qin, Lin Zhou. A new method of power quality de-noising based on the wavelet neural network [J]. Power System Protection and Control. 2010, 07: 88-93.
[13] W. K. Yoon and M. J. Devaney, " Power measurement using the wavelet transform", IEEE Trans. Instrum. and Meas., vol. 47, no. 5, October.1998.
[14] Shen Ouyang, Zhengxiang Song. Application of wavelet soft-threshold de-noising technique to power quality detection [J]. Automation of Electric Power Systems. 2002, 10: 57-60.