Munich Personal RePEc Archive
A Method for Assessing Food Security
Information System
Temel, Tugrul and Kinlay, Dorjee
ECOREC Economic Research and Consulting
8 December 2012
Online at
https://mpra.ub.uni-muenchen.de/43177/
A Method for Assessing
Food Security Information System
Tugrul Temel and Dorjee Kinlay
Abstract
This paper develops a method for assessing food security information system with respect to its structure, connectedness and performance. The paper illustrates how to set up an operational food security information system, identify its leverage components and pathways of information flow, and qualitatively measure its performance in terms of utility obtained from the information. Both a workshop and a questionnaire are designed as means of gathering the data required for the measurement of the performance. The workshop identifies priority information flow patterns and the associated utilities, while the questionnaire gathers the data for the estimation of the organizational learning and information dissemination capacities. Finally, the evaluation of the system is put in perspective by integrating the traditional structure-conduct-performance approach into the method developed.
Keywords: food security information system; system performance; learning and dissemination capacities; informed policy making
2
1.
Introduction
Information is the first and foremost input required in any priority-setting exercise, as well as in the design of the associated plan of actions. However, to be able to use the information, two elements should be in place. First, there should be an information system capable of generating the desired information. Second, users of that information should have the capacity to utilize it. Recently, a wide range of organizations have initiated capacity building programs in support of informed policy making processes in the developing world.1 With a two-tier strategy, they promote the emergence of information systems on the one hand and invest in the improvement of human resource capacities of these systems on the other. Food security, agricultural and market information systems (FAO, 2000, 2011), health information systems (WHO, 2006, 2008) and information and knowledge systems (WB, 2012; FAO, 2012; OECD, 1999, 2011) are only a few examples of information system initiatives.
Methodological developments go hand in hand with these initiatives. They seek to enrich the tool box of practitioners for designing effective and sustainable information systems on the one hand and for monitoring and evaluating the performance of the evolving systems on the other. This paper intends to contribute to this tool box by developing a method for assessing food security information system (FSIS) with respect to its structure, connectedness and performance. The paper illustrates how to set up an operational FSIS, identify its leverage components and pathways of information flow, and qualitatively measure its performance in terms of utility obtained from the information. Both a workshop and a questionnaire are designed as means of gathering the data required for the measurement of the performance.2 The workshop identifies priority information flow patterns and the associated utilities, while the questionnaire gathers the data for the estimation of the organizational learning and information dissemination capacities. Finally, the evaluation of the FSIS is put in perspective by integrating the traditional structure-conduct-performance approach into the method developed (Caves, 1992; Kizito, 2008, 2011).
The method is elaborated within the context of a generic FSIS. We first describe the characteristics related to the FSIS structure: its goal and organizational domain, component formation, type of information flowing among the system components, unit of information flow, means of information transaction, and so on. Then, we elaborate on the characteristics concerning the FSIS connectedness: binary (one-to-one) component linkages, critical gaps in information flow, critical pathways of information flow, component-level learning and information dissemination capacities, dominant and subordinate components, and so on. Finally, the FSIS performance is analyzed in terms of system capacity in generating, disseminating and using the information concerned.
Our review of the literature on information systems has led to a voluminous number of studies, many of which are about computer-based systems. Excluding these computer-based system studies, we identified four regularities about the type of information systems we are interested in.3 Firstly, the government coordinates and facilitates the entire process of the
1
Including European Commission, the World Bank (WB), the Food and Agriculture Organization (FAO) of the United Nations, Organization for Economic Co-operation and Development (OECD) and World Health Organization (WHO).
2
See Temel (2004a) for the workshop design and Dibbon (1999) for the questionnaire.
3
3 creation of an enabling policy environment, with regulatory arrangements, governance and enforcement rules and regulations at all levels. Secondly, owing to public goods characteristics of information, there is ample scope for public-private partnership arrangements motivated by the presence of both private and social benefits. Thirdly, the priority policy issue is cross-sectoral in its solution and cannot be satisfactorily addressed from a limited perspective of a single sector. Stakeholders of the information concerned are aware of this and willing to join forces around a common system goal. Lastly, stakeholders recognize that system performance is conditional not only on the capacities of producers but also on the capacities of the final users of information. The presence of comparable capacities on both sides of the scale is in fact necessary for an effective and sustainable system to emerge. Our method, which embodies these regularities, further stresses the idea that linking food security stakeholders should be considered a critical factor for quality information generation and use. Facilitating the growth of linkages of a wide range of stakeholders would not only increase the flow of the existing information but also offer a way for better representation of different information sources, which would otherwise be ignored. Therefore, linking food security stakeholders should not be left to markets as it needs a continuous nurturing of policy environment.
The rest of the paper is organized as follows. Section 2 describes the method within the context of food security information. In Section 3, the SCP approach is integrated into the proposed method. This section further elaborates on how to operationalize the method. Finally, Section 4 concludes the paper.
2.
The method
The method can be used in assessing the performance of the FSIS and alternative strategies for linking food security information with policy making bodies. The system performance depends not only on the system structure and connectedness but also on the strategies and capacities of organizations. Four groups of factors determine the performance. Group I relates to policies, regulations and the information culture within a country. Group II concerns the structure of the system and its components, the roles of and resources available to these components. Group III is about organizational factors, such as the capacities, attitudes, and motivation of those involved in the production, collection, analysis, use and dissemination of information. Finally, Group IV involves technical factors, including adequate use of information means and mechanisms or data and information quality. Alternative strategies are evaluated based on the degree of linkage between relevant, quality and timely food security information and policy makers and the degree of policy makers' capacity to internalize and use the information concerned.
2.1. Analysis of information flow4
Information is the subject of this paper; therefore, its meaning and distinction from data and knowledge should be clarified. Definitions in the literature converge.5 They commonly
(2009) for a review of health information system frameworks; Shepherd (1997), Diarra, Traoré and Staatz (2004), Staatz et al (2010), Kizito (2011) and FAO (2011) for market information systems; FAO (2000) for food security information systems; WB (2012), FAO (2012) and OECD (2011) for information and knowledge systems; Connor, Thomson, Flasse and Perryman (1998) for environment information systems.
4 assume that data inherently containno meaning. Pure data in a database, for example, does not have any inherent meaning and structure. For data to become information, raw material is shaped by the receiver. The transformation of information into knowledge takes place through a process of information accumulation. Knowledge is generally personal, subjective and inherently local – it is found in the minds of human beings rather than existing objectively without. It can be internalized by the knower, and as such is ‘shaped’ by their existing mental constructs, perceptions and experiences. Tacit knowledge refers to the type of knowledge that is hard to encode and communicate because it is personal, context-specific and hard to formalize, whereas explicit and external knowledge can be stored and shared. In this paper, we define data as symbols not yet interpreted; information as data with meaning; and knowledge as the subjectively interpreted information.
The current paper is about food security information, which encompasses the information on the following dimensions of a food economy: availability of food by considering agricultural production, imports, exports and losses of staple foods and animal products; access to food by considering mainly social indicators and market information such as poverty, food prices, incomes, unemployment etc; stability of availability and access by considering market developments, the status of infrastructure and stocks, external factors including extreme events; and utilization of food by considering health and nutrition status of the population.
For analytical purposes, the FSIS is defined as a set of n components - each of which is a group of organizations with comparable objectives and implicitly organized around a component goal - that jointly and/or individually generate, collect, analyze, distribute and use information to help achieve a common system goal. The FSIS is a soft system, and its organizational domain is subjectively determined by the policy issue at hand as well as the qualifications of policy makers and the participating organizations. From a policy making perspective, the system goal is timely provision of critical food security policy information in a highly summarized and convenient form.
Putting the FSIS into operation requires a clear-cut distinction between formal and informal information. As argued by Wolf et al. (2001), the distinction lies in the medium of communications and the intentions underlying specific interpersonal contact. Formal information is defined as being derived through structured channels generally in the form of text, but also including conferences, phone calls and other forms organized for the explicit purpose of information exchange. Conversations and social interactions among family, friends, and business associates constitute informal information. Certainly, the distinction between social interaction and explicit information exchange is not clear-cut as personal, community and economic spheres overlap. This paper considers formal information only. The information concerned is highly variable and context-sensitive, and its meaning and value (or utility) depends on the competencies of the organizations in S.
Let S denote a FSIS with six components: {P, R, M, A, E, X}. Following clock-wise convention, all the binary interactions between individual components are mapped as:
5
See Ackoff (1989), King (1993), Nonaka and Takuchi (1995), Gallup, Dattero and Hicks (2002), Awad and Ghaziri
5 S =
XX XE XA XM XR XP EX EE EA EM ER EP AX AE AA AM AR AP MX ME MA MM MR MP RX RE RA RM RR RP PX PE PA PM PR PP .
Component P is a group of organizations involved in food security policy making. The terms in the 1st row and 1st column are associated with the activities of the organizations within P. Similarly, R stands for those organizations involved in food security research, and their activities are associated by the 2nd row and 2nd column; M, agricultural and food markets associated by the 3rd row and 3rd column; A, agricultural and food production system associated by the 4th row and 4th column; E, agricultural extension and information services associated by 5th row and 5th column; and X, international organizations associated by the 6th row and 6th column. Off-diagonal cells represent binary information flow between two components without any intermediary component.6 PR in (row 1, column 2) denotes the binary information flow from P to R, while RP in (row 2, column 1) denotes the binary flow in the opposite direction. The off-diagonal cells, PR and RP, differ not only with respect to the direction of information flow but also the content of the flowing information. The type of information that P makes available to the system is different from that that R provides the system because the organizations in P and R are organized around different activities. Those within P concern food security policy, whereas those in R deal with food security research, and hence they are motivated by different component goals and orientations. Information flow between P and R can also be realized through pathways of binary interactions. For example, {P→M→A→R} = {PM, MA, AR} represents a three-edge pathway of interactions showing how the information in P moves into R via M and A. Similarly, {P
→E→M→A→R} = {PE, EM, MA, AR} stands for a four-edge pathway of binary
interactions showing how the information in P moves into R via E, M and A. The information flow within a component (i.e., a loop) is placed in a diagonal cell. The loop within P, for example, is denoted by PP in the 1st diagonal cell and the loop within R by RR in the 2nd diagonal cell and so on.
Binary coding of S - 0 for absence, 1 for presence of information flow - makes it easy to characterize the flow patterns in the system. Let S[c] denote an arbitrarily coded system:
S[c] =
XX 1 0 0 1 1 0 EE 1 0 0 0 0 0 AA 0 0 0 0 0 0 MM 1 0 0 0 0 0 RR 1 0 1 1 1 1 PP 6
The terms "one-to-one" and "binary" are interchangeably used thought the study. A one-to-one relation is one between two
6 which maps out binary information gaps denoted by 0. For example, PX=0 denotes the absence of information flow from P to X. The reasons for this may vary, including the absence of interactions between organizations in P and X or the absence of organizational human, financial and technical capacities or the intellectual ignorance of the linkages.7 Whatever the reasons are, 0 reveals that information does not directly flow from P and X. However, as shown in S[c], information flow may take place in the opposite direction denoted by XP=1. This suggests that S[c] is not necessarily symmetric and helps identify information flow pathways filling the binary information gaps. For example, the binary information gap represented by XA=0 can be partially recovered by the information obtained from the pathway {XE, EA} since XE=EA=1. Similarly, the pathway {XR, RP, PA} would also help recover partial information on XA since XR=RP=PA=1.
S[c] can also be used to identify key qualitative hypotheses. Here, the underlying assumption is that information is a means of exerting "influence", and that information providers exert "influence" on the receivers. This implies that binary paths in S can be regarded as simple causal relations (or simple hypotheses). For example, PA=1 suggests that P (exogenous) influences A (endogenous) through the information flowing from P to A. There are also complex causal relations (or complex hypotheses) such as {PM, MR} or {XP, PM, MR}.8 The first step in deriving all the complex hypotheses in S[c] is to collect information on all the binary causal relations. Questionnaires, structured interviews with representatives of relevant organizations, and workshops for open discussion of organizational linkages are among commonly applied methods to gather the required information. In Box 1, we describe a workshop design for gathering that information and identifying all of the qualitative hypotheses associated with the limited knowledge of the participating organizations.
For illustrative purposes, suppose that a workshop designed following STEP 4 in Box 1 yields:
S[v]=
XX 9 0 0 12 9
0 EE 12 0 0 0
0 0 AA 0
0 0
0 0 0 MM 15
0
0 0 0 0 RR 9
0 3 12 3 6 PP
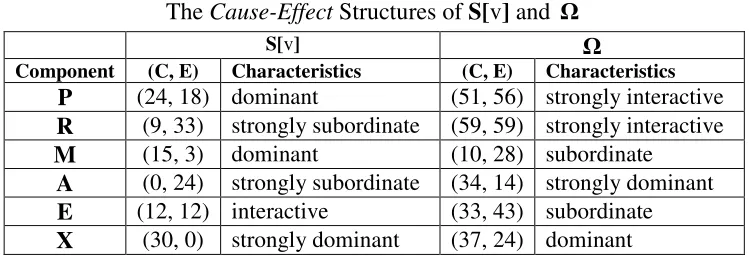
In this example, the information flowing from M to R has a value of 15 points (i.e., MR=15), showing that MR is the top priority causal relation to be studied. PA, EA and XR follow with 12 points each. S[v] has a cause-effect structure in which Cause of a component is defined as the sum of the points in the corresponding row; and Effect, as the sum of the points in the corresponding column. A component with a very high Cause and a very low Effect, denoted by Cause >> Effect, implies that that component is dominant and provides the system with the highest-value (utility) information. A component with a very low Cause and a very high
Effect, denoted by Cause << Effect, suggests that that component is subordinate and extracts the highest-value (utility) from the information obtained from the rest of the system. A
7
A pathway is fully identified if all the binary paths defining it contain information. For example, {RP, PE, EA} is fully identified since RP=PE=EA=1, while {PM, MR, RA} is not identified as RA=0.
7 component with Cause = Effect suggests that that component is interactive and indifferent between the utility it generates for others and the utility it obtains from others.
Table 1 shows the (Cause, Effect) coordinates implied by S[v]. We elaborate on some selected hypotheses only: (i) with 30 points, X is identified to be the dominant source of information, implying that X's information provides the rest of the system with the maximum utility; (ii) with 33 points, R is the subordinate user of information; (iii) with 12 points, E is the most interactive component; (iv) X is an exogenous component of S, implied by (Cause, Effect) = (30, 0) and (v) A is an endogenous component of S, implied by (Cause, Effect) = (0, 24). There are also many complex hypotheses, including {PM, MR}, {XP, PA}, {MR, RP, PA}, {RP, PE, EA} and so on.
8
Box 1: Workshop Design
Below, we describe the structure of a workshop aimed to gather expert knowledge on the use-value of food security information and organizational capacities. This workshop can be organized by implementing the following 5 steps. STEP 1: Define food security (FS), identify FS stakeholders and characterize FS information
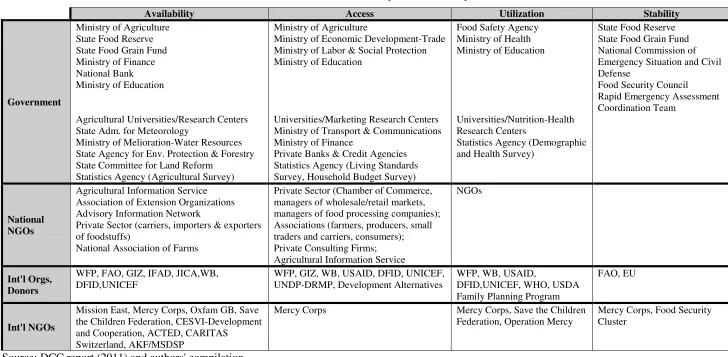
Food security is defined as the state in which all people, at all times, have physical and economic access to sufficient safe and nutritious food that meets their dietary needs and food preferences for an active and healthy life (1996 World Food Summit). Table 2 presents a list of FS stakeholders across four dimensions of FS information: (1) Availability of food by considering agricultural production, imports, exports and losses of staple foods and animal products, (2) Access to food by considering mainly social indicators and market information such as poverty, food prices, incomes, unemployment etc, (3) Stability of availability and access by considering market developments, the status of infrastructure and stocks, external factors including extreme events and (4) Utilization of food by considering health and nutrition status of the population.
STEP 2: Define FS information system S and organize FS stakeholders as individual components of S
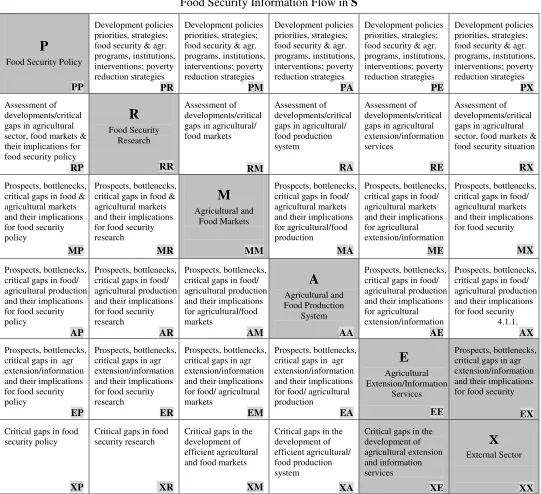
S is defined as a set of FS stakeholders – evolving around a common system goal of eradicating hunger and malnutrition – that jointly and/or individually generate, collect, analyze and distribute food security data and information to help achieve the system goal. Table 3 defines S as six components: {P, R, M, A, E, X}. A component is composed of those stakeholders with comparable objectives. For example, P would be composed of those stakeholders that directly/indirectly contribute to the formation or implementation of food security policy. Naturally, it will include ministries, collaborating international organizations, public and private agricultural banks, etc. Similarly, R would consist of those organizations that conduct food security research, including universities, private and public research centres, international research centres, etc. M would include those stakeholders concerning agricultural commodity and food markets, and so on.
STEP 3: Identify the critical gaps in FS information
Each off-diagonal cell of Table 3 describes the type of information that is expected to flow from one component to another. For example, the cell PR assumes that stakeholders in P generate and make the desired information available to those stakeholders in R. The desired information may include development policy, priority and strategy documents, food security and agricultural reform programs, institutions and interventions, poverty reduction papers, etc. Likewise, ME represents the type of information concerning prospects, bottlenecks, critical gaps in food and agricultural markets and their implications for agricultural extension and information. By construction of S, this information should be produced by stakeholders in M, while demanded by stakeholders in E. Table 3 characterizes the type of data and information necessary to analyze S. This mapping of available information allows us to identify the critical gaps in FS information that warrant better understanding.
STEP 4: Design a voting scheme for identifying dominant/subordinate components and testable hypotheses
A working group (WG) of six members is formed by randomly choosing one representative from each component. Each member is assigned 5 types of votes: a “high-value” vote worth of 5 points; an “above mediocre-value” vote, 4 points; a “mediocre-value” vote, 3 points; a “below mediocre-value” vote, 2 points; and a “low-value” vote, 1 point. Voting is conducted over the use-value for the receiver of the information concerned.9 The use-value refers to the utility of using or the want-satisfying power of that information.In this sense, a "high-value" vote of 5 points for the binary relation PR in Table 3 implies that the information flowing from P to R occupy an important place in the utility function of the stakeholders in R. Voting is neither about the actual flow of information from P to R nor availability of such information, but rather about the expected utility that can be attained from the use of such hypothetical information. Using Table 3, each WG prepares a map of the causal relations that the WG thought to be critical. The resulting six maps are in turn consolidated and all the representatives vote over the relations in the consolidated map by using the "expected utility principle". That is, the degree of "influence" of P on R is expressed in terms of "utility" that R expects to obtain from the information coming from P.
STEP 5: Carry out the questionnaire in Annex A to measure organizational capacities
Each stakeholder in the workshop completes the questionnaire to reflect upon the capacities in his/her organization.
9
9 2.2. Analysis of capacity-adjusted information flow and accumulation
2.2.1. The model
The processes of organizational learning and information dissemination capacity development are extensively studied from a variety of theoretical perspectives.10 With a synthesis of definitions in the literature, we define capacity to learn (λ) as the ability to acquire new or modify existing or synthesize different types of information.11 Learning may occur as part of education, personal development, and training and may be aided by motivation or promotion. Regarding dissemination capacity, there is also a large body of the literature offering alternative definitions. We define capacity to disseminate (δ) as the ability of transforming information into value for potential recipients and communicate it to them. Effective dissemination of information depends on the value of the provider's information stock, the motivation of the provider, the existence and variety of dissemination channels and mechanisms, the motivation and absorptive capacity of the recipient.
Given the exogenous factors (Z), organizational characteristics (Vλ,Vδ ) determine learning
and dissemination capacities, which are specified as:
Z V Z
V ; and ( ;
( λ δ δ
λ
δ
λ
= f = fwhere Z refers to policy and institutional interventions that give shape to information activities; Vλ represents factors that influence organizational learning capacity, including
availability of resources and investment in resource development, organizational culture of information sharing, organizational strategy for information acquisition; and Vδ stands for
factors that influence organizational dissemination capacity, including the work culture of cross-organization information sharing, degree of connectedness with other organizations, the presence of dissemination strategy, availability of resources and investment in resource development.12
The effective information flow in S is modeled as a process endogenous to organizational capacities:
λ
δ
C S
[v]'
≡ =
+
(1)
where
10
For learning capacity, see Dodgson (1993), Lenox and King (2004), Zahra and George (2002), Bosch, Frans, Volberda and de Boer (1999), Lane and Lubatkin (1998), Cohen and Levinthal (1990); for dissemination capacity, see Szulanski
(1996), Gupta and Govindarajan (2000), Martin and Salomon (2003), Parent, Roy and St-Jacques (2007), Joshi and Sarker
(2007), Kuiken and Sijde (2011).
11
For the determinants of learning, see Senge (1990) for the role of leadership, collaborative work culture and shared vision, Fiol and Lyles (1985) for strategy and learning, Berg v.d. and Sleegers (1996) for experimental mind-set and Marquardt (1996) for technology and structure.
12 λ
V and Vδ cover Group III and Group IV determinants of system performance, while Z includes Group I and Group II
10 = + + + + + + + X E A M R P , = XX XR XP RX RR RP PX PR PP . . . . . . . . . . . . . . . . . . . . . . . . . . . , = X E A M R P
S[v] =
XX XE XA XM XR XP EX EE EA EM ER EP AX AE AA AM AR AP MX ME MA MM MR MP RX RE RA RM RR RP PX PE PA PM PR PP ,
=
) , C( . . . ) , C( ) , C( . . . . . . . . . . . . . . . . . . ) , C( . . . C C ) , C( . . . C C X X R X P X X R R R P R X P R P P P ) , ( ) , ( ) , ( ) , ()
,
(
δ
CSince quantitative measurement of information is not possible, the concept "utility" is employed to approximate the use-value of a piece of information. + stands for a vector of
component-level expected utilities at period t+1. An element of this vector, P+ , for example, denotes the average utility accumulated in P. S[v]' denotes the transpose of S[v]; and
)
(
δ
,C is a matrix of component-level capacity index values with 0≤C(δi,λj)≤1 for all i and j. The parameters, 0≤δi≤1 and 0≤λi≤1, represent component i's dissemination and
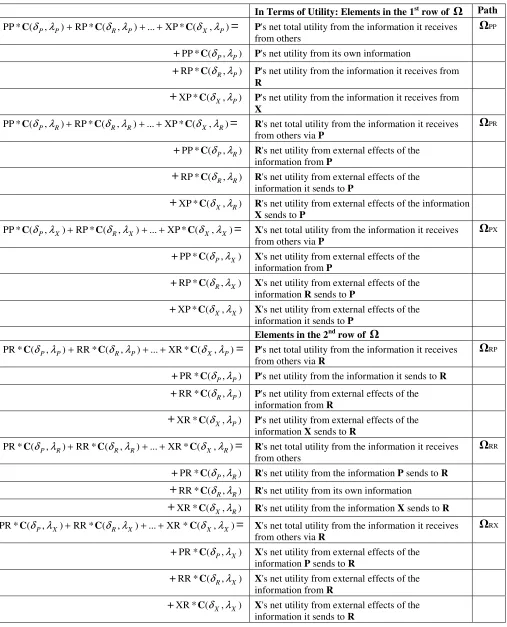
learning capacities, respectively. The term ij in S[v] refers to the utility that component j can obtain from the information coming from i. Accordingly, j's total utility is defined as the sum of the elements in the jth column of S[v]. The sum of the elements in the jth column of , however, represent j's total effective utility. Table 4 describes some of the elements in .
2.2.2. Estimation of average component capacities
Component j's total effective utility depends on the fluidity of information from other components. The fluidity from i to j depends on both i's information dissemination capacity and j's learning capacity. To approximate the degree of fluidity, C
(
δ,)
is calculated using a geometric mean of the two sub-indices: one for learning (λ) and another for disseminationcapacity (δ). This study proposes to use the questionnaire in Annex A, adopted from
Dibbon (1999), to gather data for the approximation of these sub-indices.
11 (lowest) observed value. In addition, the questionnaire in Part 2 intends to measure organizational dissemination capacity with 10 questions, and the maximum (minimum) score is 50 (10), which is the highest (lowest) observed value.
The sub-indices are calculated as follows:13
. score ion disseminat minimum -score ion disseminat maximum score ion disseminat minimum -score ion disseminat actual score learning minimum -score learning maximum score learning minimum -score learning actual = =
δ
λ
Using the geometric mean of the sub-indices,
X E A M R P j i j i j
i
λ
=δ0.5λ0.5 for = = , , , , ,δ
,we define the matrix of information flow as:
=
5 . 0 5 . 0 5 . 0 5 . 0 5 . 0 5 . 0 5 . 0 5 . 0 5 . 0 5 . 0 5 . 0 5 . 0 5 . 0 5 . 0 5 . 0 5 . 0 5 . 0 5 . 0 . . . . . . . . . . . . . . . . . . . . . . . . . . . ,)
(
X X R X P X X R R R P R X P R P P P λ δ λ δ λ δ λ δ λ δ λ δ λ δ λ δ λ δδ
C .The estimation of this matrix offers at least three advantages. First, the areas with poor information flow can be projected, and this would allow policy/decision makers to take measures to release the constraints on the areas concerned before policies/decisions are implemented. Second, the effective information flow can be projected with the identification of dominant and sub-ordinate components in the system. Specific policies/programs and institutions can target the dominant sources and subordinate users of critical information. Third, the estimated matrix together with the underlying institutional structure can provide us with information on the type of the system: flexible versus rigid. A system is said to be flexible (rigid) if the organizational capacities are advanced (undeveloped) and institutions such as property rights and enforcement rules are in place (at embryonic stage). Flexible systems should promote public, private and public-private partnership investments to improve the learning and dissemination capacities through regulatory institutions such as intellectual property rights and enforcement rules.
13
The data are gathered from each stakeholder organization using the questionnaire in Annex A. Since each component
12 2.2.3. Estimation of capacity-adjusted information flow
For illustrative purposes, arbitrary pairs of capacity index values are set as: {δP,λP}={0.6,
0.7}, {δR,λR}={0.4, 0.8}, {δM,λM }={0.7, 0.5}, {δA,λA}={0.7, 0.3}, {δE,λE}={0.4, 0.4},
and {δX ,λX }={0.9, 0.7}. This leads to:
=
)
,
(
δ
C 0.79 0.40 0.46 0.59 0.57 0.65 60 . 0 85 . 0 79 . 0 35 . 0 0.75 0.53 49 . 0 0.42 0.55 0.69 0 0 0 0 0 0 0 0 0 0 0 0 0 0 0 0 0 0 0 0 .Calculation of requires numerical values in the diagonal elements of [v]'S . A diagonal element defines the utility that a component expects to obtain from the information produced within that component. More precisely, the utility refers to the average expected utility over the assessment of individual user organizations within that component. An arbitrary array {P, R, M, A, E, X} = {12, 20, 5, 16, 12, 16} of components' assessments of their own utility is placed in the diagonal elements of [v]'S . This leads to:
= 13 12 17 5 37 20 10 0 0 14 13 7 5 2 10 9 0 11 0 1 10 10 7 11 7 8 8 1 6 2 3 12 24 5 7 21 .
A comparison of the capacity-adjusted Cause-Effect structure of with that of S[v] shows that accounting for the organizational capacities results in a completely different FSIS structure. For example, as shown in Table 1, a dominant component P under S[v] becomes a strongly interactive component under . Likewise, a strongly subordinate A under S[v]
becomes strongly dominant under .
3.
Qualitative Assessment of the FSIS
3.1. Assessing linkages and information flow
13 3.2. Assessing the FSIS
Reflecting upon the method developed in the previous section, Table 6 outlines the dimensions and issues that should be considered in a qualitative assessment of the FSIS. First, the key issues that fall within the reach of our method are presented. Then, the main characteristics of the FSIS are reorganized around the concepts of the traditional SCP approach: structure, conduct and performance. As a final point, various indicators are derived that can be use in the assessment of the FSIS performance.
The SCP approach treats system structure as an exogenous (explanatory) and performance as an endogenous (dependent) factor. It suggests a linear relationship from structure to conduct and then to performance. However, in reality, the relationship is more complex and shows non-linearity as the system structure itself is likely to be affected by organizations’ conduct and performance through feedback mechanisms. Our point of view postulates a non-linear relationship between the system structure, conduct and performance.14 Take, for example, the information flow analysis described in Section 2.1, which can be applied to address the issues in row 1 of Table 6. But, these issues are mixed and have simultaneous implications for both the structure and the conduct at the system level. Likewise, row 2 in Table 6 lists the key issues that can be examined by the capacity-adjusted flow analysis explained in Section 2.2. Again, the issues of concern have simultaneous implications for both the structure and the conduct, but this time, the implications are examined at the component level. All together, the issues given in Table 6 directly or indirectly affect the system performance.
Our point of departure from the SCP approach can be summarized in two assertions. First, the relationship between structure, conduct and performance is non-linear, capturing the effects of feedback mechanisms. Second, the relationship needs to be explored separately at the system and component levels as each level of analysis has its own peculiarity in the assessment of the system performance.
3.3. Monitoring the FSIS performance
The information obtained through the application of our method can be used in monitoring the performance of the FSIS. Table 7 presents a simple performance monitoring framework. Three terms are used consistently: goal, outcome and indicator. Goal is a broad statement of the ultimate target. In our case, the goal is to improve the performance of the FSIS, which is measured by the degree of the generation, dissemination and use of quality and timely information products in food security decision and/or policy making. Outcome (x) is the degree that the information flowing in the system yields the desired impact or change.
Indicator (y) is the specific, measurable information collected to track whether an outcome has actually occurred. A functional relation, x=M(y), is implicitly assumed between x and
y.
14
4.
Conclusions
This study develops a method for the qualitative assessment of the FSIS and monitoring its performance. The method is operationalized by developing indicators for the measurement of the system performance.
The method needs further improvement to overcome various weaknesses. First, the FS information is expressed in terms of utilities (use-value) attached to it. This utility is both context and organization-specific, and the utility of the same piece of information varies over time and across organizations. This makes the quantitative analysis of information accumulation especially demanding. Second, the flow of new information will be slow if no intellectual property rights exist that ensure the appropriation of the benefits by the producer of the information. This would hinder the socially optimal production of new information. Therefore, public interventions are necessary, making the government both a regulator and an indispensable stakeholder of the system. Therefore, a principle-agent problem arises, which hampers the participation of private actors/organizations in the FSIS. The problem is to organize the FS stakeholders around a system goal, as well as around component-level goals consistent with the system goal. Special institutional arrangements are required for stakeholders to have stable preferences over time.
Third, the assessment of component linkages and fluidity of the FS information requires not only the use of comparable means and mechanisms in information exchange but also the presence of context and skilled human resources. A questionnaire is proposed that can be used to approximate component-level linkage capacity (a composite value based on learning and dissemination capacities). The problem, however, is that linkage capacity does not ensure the presence of the actual linkage. This implies that the FSIS should be first assessed whether or not it has sufficient context to support information transactions.
The fourth weakness relates to the SCP approach. System performance is relative, which requires a benchmark (baseline) situation with which the FSIS examined can be compared. Setting a benchmark performance calls for specific performance indicators organized around a system goal, which itself depends on the changing needs of information users. Therefore, it is quite difficult to develop quantitatively testable hypotheses.
15
References
[1] Ackoff, R.L. (1989). From data to wisdom. J of Applied Systems Analysis, 16, 3-9.
[2] Ahsan, S., Shah, A. (2006). Data, information, knowledge, wisdom: A doubly linked chain? In the proceedings of the 2006 international conference on information knowledge engineering, 270-278.
[3] Aldridge, K. M. (1992). A framework for analyzing alternative institutional arrangements for the cereals market information system in Mali. Michigan State University.
[4] Arrow, J.K. (1986). The value of and demand for information. In McGuire, C.B., and Radner, R. (Eds.), Decision and Organization (2nd ed.). Minnesota, Minneapolis: University of Minnesota Press.
[5] Aqil, A., Lippeveld, T., Hozumi, D. (2009). PRISM framework: A paradigm shift for designing, strengthening and evaluating routine health information systems.
Health Policy Plan, 24(3), 217-228.
[6] Awad, M.A., Ghaziri. H.M. (2004). Knowledge management. Upper Saddle River,
USA: Pearson Education International.
[7] Bellinger, G., Casstro, D., Mills, A. (2012). Data, information, knowledge and wisdom. http://www.outsights.com/systems/dikw/dikw.htm accessed Oct. 6, 2012.
[8] Berg, v.d. R., Sleegers, P. (1996). Building innovative capacity and leadership. In K. Leithwood, J. Chapman, D. Corson, P. Hallinger & A. Hart (Eds.), International Handbook of Educational Leadership and Administration. Vol. 1, Part 2, 653-699. Netherlands: Kluwer Academic Publishers.
[9] Bosch, v.d. F.A.J., Volberda, H.W., de Boer, M. (1999). Co-evolution of firm absorptive capacity and knowledge environment: Organizational forms and combinative capabilities. Organization Science, 10(5), 551-568.
[10] Caves, E. R. (1992). American industry; Structure, conduct and performance: Harvard University, Prentice Hall.
[11] Connor, S. J., Thomson, M. C., Flasse, S. P., Perryman, A. H. (1998). Environmental information systems in malaria risk mapping and epidemic forecasting. Disasters, 22(1), 39-56.
[12] Development Coordination Council (DCC). (2011). Food security stakeholders in Tajikistan (unpublished).
[13] Diarra, S., Traoré, A., Staatz, J. M. (2004). Developing sustainable agricultural information services: Lessons from Mali. East Lansing. Michigan State University.
[14] Dibbon, D.C. (1999). Assessing the organizational learning capacity of schools. (Ph.D. dissertation). Toronto, Canada: Department of theory and policy studies in education, Ontario Institute for Studies in Education of the University of Toronto.
[15] Dodgson, M. (1993). Organizational learning: A review of some literature.
Organizational Studies, 14(3), 375-394.
16 [17] FAO. (2011). Enhancing market transparency: Agricultural market information
system. AMIS inception meeting, September 2011. Rome, Italy.
[18] FAO. (2012). An FAO e-mail conference on agricultural innovation systems and family farming. Rome, Italy
[19] Fiol, C.M., Lyles, M.A. (1985). Organizational learning. Academy of Management Review, 10, 803-813.
[20] Gallup, S.D., Dattero, R., Hicks, R.C. (2002). Knowledge management systems: an architecture for active and passive knowledge. Information Resource Management Journal, 15(1), 22-7.
[21] Gupta, A.K., Govindarajan, V. (2000). Knowledge flows within multinational corporations. Strategic Management Journal, 21, 473-496.
[22] Joshi, K.D., Sarker, S. (2007). Knowledge transfer within information systems development teams: Examining the role of knowledge source attributes. Decision Support Systems, 43, 322-335.
[23] King, J.L. (1993). Editorial notes. Information Systems Research, 4(4), 291-298. [24] Kizito, A. (2008). Structure-conduct-performance and food security. FEWS NET
Markets Guidance, No. 2. Washinton D.C., USA: USAID.
[25] Kizito, A. M. (2011). The structure, conduct and performance of agricultural market information systems in Sub-Saharan Africa (Unpublished Ph.D. thesis). Michigan State University, Agricultural, Food, and Resource Economics. Michigan, USA.
[26] Kuiken, J., van der Sijde, P. (2011). Knowledge transfer and disseminative capacity: A review and propositions for further research on academic knowledge transfer. (Unpublished manuscript). Amsterdam, The Netherlands: Faculty of social sciences, department of organization science, VU University Amsterdam.
[27] Lafond, A., Field, R. (2003). The PRISM. Introducing an analytical framework for understanding performance of routine health information system (draft). RHINO Second International Workshop, Sept 20–Oct 4, Eastern Cape, South Africa
[28] Lane, P.J., Lubatkin, M. (1998). Relative absorptive capacity and inter-organizational learning. Strategic Management Journal, 19(5), 461-477.
[29] Lenox, M., King, A. (2004). Prospects for developing absorptive capacity through internal information provision. Strategic Management Journal, 25(4), 331-345.
[30] Lippeveld, T., Sauerborn, R., Bodart, C. (2000). Design and implementation of health information systems. Geneva: World Health Organization.
[31] Marquardt, M. (1996). Building the learning organization. NY, USA: McGraw Hill
[32] Nonaka, I., Takuchi, H. (1995). The knowledge-creating company: How Japanese companies create the dynamics of innovation. NY, USA: Oxford University Press.
[33] OECD. (1999). Managing national innovation systems. Paris, France: OECD.
[34] OECD. (2011). Conference on Agricultural Knowledge Systems (AKS):
Responding to Global Food Security and Climate Change Challenges. June 15-17, OECD Conference Centre, Paris, France
17 [36] Pan American Health Organization. (1998). Information systems and information technology in health – challenges and solutions for Latin America and the Caribbean. Washington, DC, Pan American Health Organization.
[37] Parent, R., Roy, M., St. Jacques, D. (2007). A systems-based dynamic knowledge transfer capacity model. J of Knowledge Management, 11(6), 81-93.
[38] Senge, P. (1990). The leader's new work: Building a learning organization. Sloan Management Review, 32(1), 7-23.
[39] Staatz, J. M., et al. (2010). Pathways from improved market information to better market performance: Implications for the evaluation of investments in agricultural market information systems.
[40] Stigler, G. J. (1961). The Economics of Information. J of Political Economy 69(30),
213-225.
[41] Stiglitz, J.E. (2000). The contributions of the economics of information to twentieth century economics. Quarterly J of Economics, 1441-1478.
[42] Szulanski, G. (1996). Exploring internal stickiness: impediments to the transfer of best practice within the firm. Strategic Management Journal, 17, 27-43.
[43] Temel, T. (2004a). A method for cross-sector priority setting: Gaps and hypotheses in malaria research -Tanzania. European J of Health Economics, 5(4), 317-323.
[44] Temel, T. (2004b). Mapping organizational linkages in the agricultural innovation system of Azerbaijan. International J of Agricultural Resources, Governance, and Ecology, 3(1/2), 134-153.
[45] Wolf, S., Zilberman, D., Wu, S., Just, D. (2001). Institutional relations in agricultural information systems. In Wolf, S., and Zilberman, D. (eds.). Knowledge generation and technical change: Institutional innovation in agriculture. Boston, USA: Kluwer Academic Publishers.
[46] WB. (2012). Agricultural innovation systems: An investment sourcebook.
Washington D.C., USA: World Bank
[47] WHO. (2006). Strengthening country health information systems: Assessment and monitoring tool. Geneva: Health Metrics Network.
[48] WHO. (2008). Framework and standards for country health information systems. http://www.who.int/healthmetrics/documents/hmn_framework200803.pdf
[49] Zahra, S. A., George, G. (2002). Absorptive capacity: A review,
re-conceptualization, and extension. Academy of Management Review, 27(2), 185-203.
18
Annex A: Questionnaire for Measuring Organizational Capacities
Part 1
Measuring Learning Capacity
1. In this organization,...
a) there is little focus on professional learning.
b) most learning focuses on reacting to and trying to solve day-to-day operational problems.
c) staff members and the management body look internally and question themselves
about why errors or successes occurred in the first place.
d) staff members and the management body try to avoid negative results and experiences by identifying the best future opportunities and then finding ways to achieve that future.
e) in addition to (b), (c) and (d), we contemplate our own learning behaviors, in other words we engage in activities that help us learn about our own learning.
2. In this organization...
a) there is little sharing among colleagues.
b) staff members are inclined to share with their departmental colleagues. However, there is a limited ability to transfer information and knowledge beyond the departmental level.
c) people are inclined to share with each other but there is no formal distribution plan. Basically, if I want to know something I know who to see.
d) peer-to-peer sharing and the existence of cross-department teams ensures that information and knowledge diffuse throughout the organization, however, it occurs slowly.
e) we are skilled at moving information and knowledge efficiently and quickly throughout the entire organization.
3. As an organization…
a) we never take time to reflect on what our organization is all about.
b) we take time to reflect on what our organization is about, once or twice a year on professional development days.
c) we take time to reflect on what our organization is all about when we meet as teams or committees and at regularly scheduled staff meetings.
d) challenging the status quo and experimenting with new ways of doing things is a way of life.
e) In addition to (d), we collaborate with each other on action learning projects.
4. In this organization…
a) new ideas are resisted.
19 c) there are groups of staff members who will take a new idea and run with it but
there are others who resist anything that even resembles change.
d) we strongly support innovation and we have become skilled at moving
information and knowledge efficiently and quickly throughout the entire organization, therefore new ideas get implemented quickly.
e) as a result of (d), we are able to successfully implement multiple innovations, simultaneously.
5. In this organization...
a) things are pretty routine; there is not much change.
b) new ideas are usually imposed upon us and we have no choice but to comply. c) new and innovative ideas are acknowledged but most people pay lip service to
them therefore implementation is difficult.
d) staff members and the management body get excited about innovative ideas but they often become frustrated because of a lack of resources to implement the ideas.
e) innovative ideas usually result in new ways of thinking as well as new ways of doing things.
6. This organization acquires high quality and highly relevant information by...
a) accident. Staff members and the management body don’t pay much attention to what happens outside the organization nor are there any internal efforts to be innovative.
b) accident, as well as through the management body and the relevant ministries. c) accident, as well as intentionally scanning the local environment and importing
new information from other organizations. For example, attending conferences, hiring external consultants, using benchmarks from other organizations.
d) in addition to (c), partnering with other organizations and businesses for the purpose of developing new ways of doing things.
e) (b), (c) and (d).
7. In this organization...
a) there is very little investment in learning resources.
b) the management body recognizes the need for qualified workforce and improved
ICT but often becomes frustrated because of a lack of financial resources to acquire them.
c) staff members and the management body regularly discuss the current and expected organizational resource issues and draw an innovative investment plan. d) in addition to (c), the management body allocates funds for the procurement of the
priority resources (physical, human, technical, etc) and effectively acquires what is needed.
e) in addition to (d), staff members and the management body are able to internalize the implications of efficient resource use for the organizational sustainability.
8. In this organization...
20 b) the management body recognize the need for better understanding of the implications on organizational learning of policy and institutional issues, but often become frustrated because of a lack of specialized experts.
c) staff members and the management body regularly review policies and formal institutions (legal rules and requirements) that may affect learning through their effects on market developments resource mobilization and public-private collaboration and the management adjusts the organizational strategy accordingly. d) in addition to (c), the management body mobilizes resources to effectively
implement the strategy.
e) in addition to (d), staff members and the management body proactively initiate the formation of a community of organizations to respond to/influence policy/ institutional changes concerning organizational learning.
Directions: Please circle the letter corresponding to your answer. Then add the number
of circled items in each column. Multiply by the number provided at the bottom of the column. Then add the tallies at the bottom of each column to provide a total category score.
Part 1: Learning Capacity
1. a b c d e 2. a b c d e 3. a b c d e 4. a b c d e 5. a b c d e 6. a b c d e 7. a b c d e 8. a b c d e
21 Part 2
Measuring Dissemination Capacity
1. In this organization the work culture...
a) there is very little professional and cross-organizational sharing or collaboration.
b) professional and cross-organization sharing or collaboration is focused on resisting change and defending the status quo.
c) staff members and the management body work together on information sharing or dissemination problems.
d) in an attempt to improve the dissemination process, staff members and the management body frequently collaborate with other organizations to develop new dissemination means and mechanisms.
e) in addition to (d), staff members and the management body take responsibility for and contribute to one another’s information sharing or dissemination as they go about their daily activities. As well, staff members are provided with time to meet, share ideas and plan collaboratively.
2. In this organization the linkages with its environment…
a) virtually no one recognizes the interrelationships between the organization and its environment.
b) the management body appears to understand the complex relationship between the organization and its environment but it experiences difficulty explaining these relationships to staff members.
c) staff members and the management body understand the complex relationships that exist between the organization and the environment.
d) in addition to (c), staff members and the management body are able to think and act with a comprehensive understanding of the entire system.
e) in addition to (d), staff members and the management body understand the concept of leverage and how a small well-focused change in one organization can produce significant, long lasting improvements in another.
3. In this organization, strategies for information dissemination (e.g. dissemination plans, innovative dissemination means and mechanisms, professional networking)...
a) are virtually non-existent.
b) have been developed but they are not widely accepted by staff members. c) focus on improving individual staff learning.
d) focus on individual staff learning, team learning and organizational goals.
e) in addition to (d), they are carefully designed and implemented in such a way to promote the organization by reflecting upon the needs of other organizations in its environment.
4. In this organization, when people come together to discuss information dissemination strategies...
a) we do not discuss dissemination strategies.
22 c) the discussion operates like a democracy and results in decisions that are based on the
opinions of the majority.
d) staff members recognize the diversity and expertise of the group and work towards a consensus.
e) in addition to (d), there is a free flow of ideas and creativity that generate new ideas about the dissemination of the information across other organizations.
5. In this organization the dissemination of information...
a) does not occur on a large-scale basis. When it does occur it is by chance, on an informal basis.
b) does not occur on a large-scale basis. The few new ideas are usually protected by the owners and are not willingly shared or disseminated
c) is common. It happens as a result of informal networks and between organizations and through peer-to-peer communication. It is often a response to a demand or crisis.
d) is common. It happens as a result of carefully planned events and processes (e.g. reports, bulletin boards, staff meetings, briefings, cross-organizational work teams, and electronic communication networks).
e) both (c) and (d).
6. This organization disseminates high quality & highly relevant information by...
a) there is little evidence that this organization disseminates any new information. b) experimenting with new ideas to see what works.
c) staff members and the management body working closely together on organizational dissemination issues.
d) staff members and the management body taking some piece of existing information and adding theirs to it, in order to create and disseminate something new.
e) staff members and the management body creating new information, adopting it to the needs of other organizations in its environment and making it available to those in its environment.
7. In this organization...
a) there are few resources to facilitate new dissemination initiatives.
b) there are plenty of skilled people and non-human resources (e.g. time, money, technology) but there is little information dissemination.
c) there are plenty of non-human resources but no skilled people to facilitate information dissemination.
d) there are plenty of skilled people who are anxious to engage in new dissemination initiatives but they are handcuffed by a lack of non-human resources.
e) we are fortunate. There are many skilled people who are engaging in new dissemination initiatives and we have the non-human resources to make the experience worthwhile.
8. In this organization, computer and communications technologies have...
a) had no real effect on professional/organizational information dissemination.
23 c) been adopted by a large percentage of staff members and/or the management body who use the new technologies (e.g. World Wide Web, E-mail, presentation software) in their day-to-day information exchange with other organizations.
d) been adopted by everyone in the organization. Everyone has access to the information highway and all staff members use the new technologies (e.g. World Wide Web, e-mail, presentation software) in their day-to-day information exchange, and all staff members communicate via email.
e) in addition to (d), have stimulated new dissemination methods. Staff members are constantly looking for new ways to apply the technologies to their information exchange.
9. In this organization...
a) when leaders and other knowledgeable staff members leave we usually find ourselves in a state of crisis, because information is not retained.
b) there is no formal plan for storing and disseminating information but undeclared information is stored with department members and is available to other members if they know where to look and who to ask.
c) in addition to (b), staff members and the management body are aware of the need to retain and disseminate the undeclared information to other organizations.
d) staff members and the management body are aware of the need to disseminate organizational information. They have systems and structures in place (e.g. teams, documents, and/or electronic files) to ensure that important information is not lost and shared with other organizations.
e) in addition to (d), the stored information is organized in such a way that it is easily accessible to other organizations when it is needed.
10. In this organization...
a) Attention is not paid at all to policies/formal and informal institutions that may affect information dissemination.
b) the management body recognize the need for better understanding of the implications on information dissemination of policy and institutional issues, but often become frustrated because of a lack of specialized experts.
c) staff members and the management body regularly review policies and formal institutions (legal rules and requirements) that may affect information dissemination through their effects on market developments resource mobilization and public-private collaboration and the management adjusts the organizational strategy accordingly.
d) in addition to (c), the management body mobilizes resources to effectively implement the strategy.
24
Directions: Please circle the letter corresponding to your answer. Then add the number of circled
items in each column. Multiply by the number provided at the bottom of the column. Then add the tallies at the bottom of each column to provide a total category score.
Part 2: Dissemination Capacity
1. a b c d e 2. a b c d e 3. a b c d e 4. a b c d e 5. a b c d e 6. a b c d e 7. a b c d e 8. a b c d e 9. a b c d e 10. a b c d e
_______x1 _______x2 _______x3 _______x4 ______x5 Score _______ + _______ + _______ + _______ + ______ = _____
25 Table 1
The Cause-Effect Structures of S[v] and S[v]
Component (C, E) Characteristics (C, E) Characteristics
P (24, 18) dominant (51, 56) strongly interactive
R (9, 33) strongly subordinate (59, 59) strongly interactive
M (15, 3) dominant (10, 28) subordinate
A (0, 24) strongly subordinate (34, 14) strongly dominant
E (12, 12) interactive (33, 43) subordinate
26 Table 2
Stakeholders in the Food Security Information System
Availability Access Utilization Stability
Government
Ministry of Agriculture State Food Reserve State Food Grain Fund Ministry of Finance National Bank Ministry of Education
Agricultural Universities/Research Centers State Adm. for Meteorology
Ministry of Melioration-Water Resources State Agency for Env. Protection & Forestry State Committee for Land Reform
Statistics Agency (Agricultural Survey)
Ministry of Agriculture
Ministry of Economic Development-Trade Ministry of Labor & Social Protection Ministry of Education
Universities/Marketing Research Centers Ministry of Transport & Communications Ministry of Finance
Private Banks & Credit Agencies Statistics Agency (Living Standards Survey, Household Budget Survey)
Food Safety Agency Ministry of Health Ministry of Education
Universities/Nutrition-Health Research Centers
Statistics Agency (Demographic and Health Survey)
State Food Reserve State Food Grain Fund National Commission of Emergency Situation and Civil Defense
Food Security Council Rapid Emergency Assessment Coordination Team
National NGOs
Agricultural Information Service Association of Extension Organizations Advisory Information Network
Private Sector (carriers, importers & exporters of foodstuffs)
National Association of Farms
Private Sector (Chamber of Commerce, managers of wholesale/retail markets, managers of food processing companies); Associations (farmers, producers, small traders and carriers, consumers); Private Consulting Firms; Agricultural Information Service
NGOs
Int'l Orgs, Donors
WFP, FAO, GIZ, IFAD, JICA,WB, DFID,UNICEF
WFP, GIZ, WB, USAID, DFID, UNICEF, UNDP-DRMP, Development Alternatives
WFP, WB, USAID,
DFID,UNICEF, WHO, USDA Family Planning Program
FAO, EU
Int'l NGOs
Mission East, Mercy Corps, Oxfam GB, Save the Children Federation, CESVI-Development and Cooperation, ACTED, CARITAS
Switzerland, AKF/MSDSP
Mercy Corps Mercy Corps, Save the Children Federation, Operation Mercy
Mercy Corps, Food Security Cluster