EUR 4218
e
EUROPEAN ATOMIC ENERGY COMMUNITY - EURATOM
PROGRAM FOR PLUTONIUM UTILIZATION
IN THERMAL REACTORS
1969
@
Report prepared by ENEL
Ente Nazionale per !'Energia Elettrica - Rome, Italy
l
LEGAL NOTICE .~
This document was prepared under the sponsorship of the Commission of the European Communities.
Neither the Commission of the European Communities, its contractors nor any person acting on their behalf :
make any warranty or representation, express or implied, with respect to the accuracy, completeness, or usefulness of the information con-tained in this document, or that the use of any information, apparatus, method, or process disclosed in this document may not infringe privately owned rights; or
assume any liability with respect to the use of, or for damages resulting from the use of any information, apparatus, method or process disclosed in this document.
This report is on sale at the addresses listed on cover page 4
at the price of FF 10.- FB 100.- DM 8.- Lit. 1250 FI. 7.25
When ordering, please quote the EUR number and the title, which are indicated on the cover of each report.
Printed by Guyot, s.a. Brussels, August 1969
This document was reproduced on the basis of the best available copy. • 'I
t
I'
I
EUR 4238
e
EUROPEAN ATOMIC ENERGY COMMUNITY - EURATOM
PROGRAM FOR PLUTONIUM UTILIZATION
IN THERMAL REACTORS
1969
®
Report prepared by ENEL
Ente Nazionale per !'Energia Elettrica - Rome, Italy
ABSTRACT
The contract is articulated in eight technical tasks and one for coordination; during this reporting period, no work was performed on Task V, whilst Task I was terminated during the first year of implementation.
TA SK I I : Development of a calculation method for Pu lattices
Several computer codes (FLARE, TURBO, RIBOT, BURNY, GAM-THERMOS-SQUID) were further developed and checked against experimental data from DIMPLE, SAXTON and PRCF critical measurements.
TA SK I II : Minimum critical load with Pu prototype elements
The minimum critical loads with U and Pu fuel elements were calculated. The optimal configuration of a 3 X 3 core for power distribution measurements was determined. The gamma-scan equipment to be used for these measurements was thoroughly checked out.
TA SK IV : Isotopic composition measurements on irradiated uranium fuel Preparation for these measurements at the European Institute for Trans-uranium Elements at Karlsruhe is in progress.
TA SK VI: Detailed study of Pu fuel cycles
12 prototype Pu bearing fuel bundles are to be loaded into the Garigliano core at the beginning fuel cycle No. 2. The optimal positioning, the power distribution and the reactivity life have been determined.
TA SK VII: Reactor safety analysis, plant behaviour during operating transients and accidents
Work under this task was limited to the health physics problems associated with Pu fuel handling.
TASK VIII: Conceptual mechanical design of the fuel element and technical specifications for fuel procurement
A meeting with the Community manufacturers on the problems associated with the fabrication of a second series of Pu prototype elements was held in Brussels on September 19-21, 1967.
KEYWORDS
PLUTONIUM
THERMAL NEUTRONS REACTORS
INDEX
Page
INTRODUCTIQN
7
TASK II - DEVELOPMENT OF A CALCULATION
METHOD FOR PLUTONIUM LATTICES 8
1. Development and verification of calculation methods
for mixed uranium and plutonium lattices 8
2. Development and modification of the codes used for t~e
research program I I
FLARE code I I
AGENA code I I
BURNY code I I
BURNY-2 code I I
RIBOT-5-SQUID code system I I
TASK Ill - MINIMUM CRITICAL LOAD WITH PLUTONIUM
PROTOTYPE ELEMENTS 12
1. Determination of the minimum critical loads and selec-tion of the 3x3 configuraselec-tion for power distribuselec-tion
measurements I2
1. 1 Evaluation of the perturbation induced by a bank
of control rods on the radial power distribution I2
1. 2 Determination of the minimum critical load for
enriched-uranium and plutonium elements
I4
1. 3 3x3 assembly for power distribution measurements I8
2. Preliminary measurements for the development of a
gamma scanning technique for plutonium fuel rods 22
2. 1 Description of the equipment 26
2. 2 Measurements 26
2. 3 G aroma measurements
JJ
2. 4 Difficulties encountered during the measurements
Jo
2. 5 Test results
37
2. 5 . 1 Radiation levels
4
-Page
2. 6 Analysis of the results
Ju
2. 6. 1 Gross gamma measurements
J7,
2 .. 6 .. 2 La-140 measurement
42
2 .. 6 .. 3 Relafionship between the two counting
chains
43
2. 6. 4 Determination of the radiation levels 43
2. 7 Conclusions
45
2. 8 Proposed procedure for the measurements during
the refueling outage
45
TASK IV - ISOTOPIC COMPOSITION MEASUREMENTS ON
IRRADIATED URANIUM FUEL
47
1. Schedule of tests to be performed on rods of element
A-106
47
2. Problems associated with transport of irradiated fuel
rods to the Karlsruhe Center
49
TASK VI - DETAILED STUDY OF PLUTONIUM FUEL CYCLES
50
1. Analysis for the positioning of plutonium elements in
the Garigliano core at the beginning of cycle 2
50
2. Characteristics of the reload fuel elements
50
3. Reload uranium element
52
4. Prototype standard plutonium elements
52
5. Prototype advanced plutonium elements
52
6. Preliminary determination of the core burn-up
distribution at the end of Cycle IC
52
7, Preparation of the library for the FLARE code
57
8. Positioning of prototype plutonium elements
6I 9. Analysis of the perturbations in the loacal power
distribution caused by lack of one rod in the reload fuel elements
5
-TASK VII - REACTOR SAFETY ANALYSIS, PLANT BEHAVIOUR DU.RING OPERATING TRANSIENTS AND
Page
ACCIDENTS
70
TASK VIII - CONCEPTUAL MECHANICAL DESIGN OF THE FUEL ELEMENT AND TECHNICAL SPECIFICATIONS FOR FUEL PROCUREMENT
LIST OF REPORT ISSUED DURING THE SECOND YEAR OF IMPLEMENTATION OF THE ~NEL EURATOM CONTRACT 092-66-6-TEEI
72
PROGRAM
FOR PLUTONIUM UTILIZATION IN
THERMAL
REACTORS
INTRODUCTION
(*)
This report contains the main results of the work carried out under the ENEL-EURATOM contract, No. 092-66-6-TEEI, during the second year of implementation.
The contract is articulated in eight technical tasks and one for coordination; during this reporting period, no work was performed on Task V, whilst Task I was terminated during the first year of implementation, Therefore, these tasks have been omitted in this report.
In addition to a summary description of the work performed and under way for each task, the report describes the twelve prototype plutonium fuel elements that will be inserted in the Garigliano reactor during the first refueling shutdown scheduled for the summer of 1968. Eight of these elements are made entirely of plutonium and are called "standard", whereas the other four contain both enriched-uranium and mixed uranium-plutonium rods and are called "advanced".
In this reporting year, ENEL and EURATOM jointly decided to issue an ·invitation· to bid for a se,::ond · set of prot6type plutonium elements to be supplied by a Community manufacturer for insertion in the Garigliano reactor during the refueling shutdown scheduled for the end of 1969.
A list of documents issued between 1 June 1967 and 31 May 1968 - - available at the EURA TOM offices - - is attached.
8
-TASK II - DEVELOPMENT OF A CALCULATION METHGD FOR PLU-TONIUM LATTICES
The work under this task consisted essentially in developing codes and calculation procedures to use in the research program. The proce-dures followed for the calculation of power distribution from experimental data are discussed in a separate topical report, "Development and Veri-fication of Calculation Methods for Mixed Uranium and Plutonium
Lat-tices",
Doc. 4. 811/12. The more important of the results obtained with these procedures are illustrated below.The preparation of the codes necessitated the compilation of several programs and their adaptation to the IBM 360/65 at the Com-mon Research Center at Ispra.
1. · Development arid verification of calculation methods for mixed ura-nium and plutoura-nium lattices
The power distribution calculation methods used for the work under this research program were subjected to extensive investigation aiming at ascertaining their adequacy in handling the various aspects of
uo
2 and U0
2-Pu02 cores.
Two categories of codes can be envisaged for this purpose:
(a) Codes whkh permit the determination of the macroscopic power dis-tribµtion of the whole core as a function of irradiation.
(b) Codes which permit the assessment of the effect of local disunifor-mities on power distribution over the fuel lifetime.
For the determination of the macroscopic power distribution in
BWR's, the FLARE code was chosen because of its flexibility and eco-nomic advantages. A TURBO type code ( CONDOR) appeared more
suited to PWR problems; the microscopic library was generated by means of the RIBOT code.
For the second task, use was made of the BURNY code in the two-group and five-group (two thermal and three fast) versions. These versions were checked against experimental data to assess the increased accuracy attainable from a more detailed representation of the neutron spectrum, and against experimental distributions of U-235 and Pu-23 9 fission rates to ascertain their capability of representing the variation in the fissile isotope content with irradiation.
The survey was also extended to the three-group (one thermal and two fast) GAM-THERMOS-SQUID system; the thermal constants of the peripheral cells of elements were calculated by THERMOS on the basis of a slab model of the fuel cell and adjacent water gap.
9
-out at the Garigliano BWR station during the first two operating cycles. The experimental data utilized for the CONDOR code were constituted of Aeroball measurements carried out at the Trino PWR station. The calculated data compare favourably with the experimental ones.
The local power distribution codes were verified against the fol-lowing experimental data:
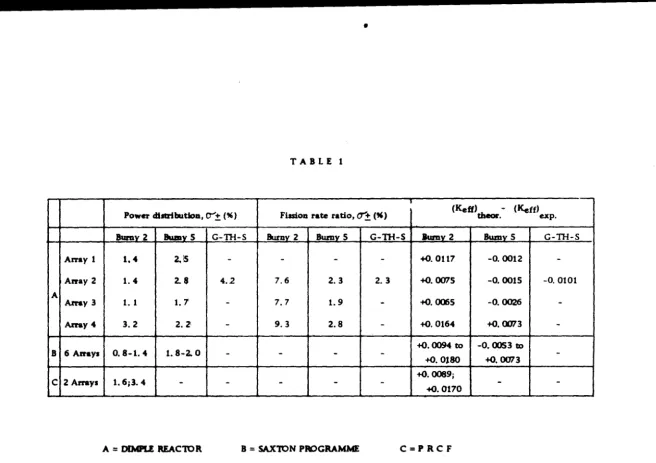
(1) DIMPLE measurements, performed by UKAEA for ENEL, of U-235 and Pu-239 fission rates; by means of foils on four different 5x5 arrays of fuel modules, each module containing 8x8 Al-canned pins. Rod pitch and gap between modules closely resembled those of the twelve plutonium fuel elements to be loaded in the Garigliano reac-tor~ Array 1: all uranium-enriched (3%) modules. Array 2: as Array 1, except for plutonium-enriched (2.1 %) central module. Array 3: as Array 2, except that the four corner pins of the central module had lower enrichment (1. 2% Pu). Array 4: as Array 1, exc~pt that the plutonium module was loaded at the periphery.
(2) Saxton plutonium program data. These data constitute a valid check because they provide the power perturbations due to water-gap and power sharing effects in cores of high plutonium content.
(3) PRCF 1967 data from Battelle. These data were very interesting for the checks, as they were obtained on plutonium fuels with sub-stantially different isotopic compositions.
The comparison results summarized in Table 1 indicated that: (a) the one-thermal-group technique generally gives better agreement with the actual power distribution; (b) the corner rod power is sligl;ttly overestimated by the two-thermal-group technique and underestimated by the one-group technique; (c) the Pu-239 and U-235 fissj.on rate tatios are evaluated better by the two-thermal-group technique; (d) the GAM-THERMOS-SQUID system shows that the allowances for the spectrum softening due to the water gap permit the one-thermal-group technique to achieve the same accuracy as the two-thermal group system; how-ever, the GAM-THERMOS-SQUID technique is very time-consuming.
For flexibility and simplicity in use, codes which calculate the constants automatically by a fitting procedure, E?Uch as BURNY, are very convenient for power distribution calculations also in the two-· group version. For calculations over the fuel lifetime the five-group version (two thermal) appears to be more precise.
A further check will be provided by the performance of the plu-tonium elements at the Garigliano.
Array l
AJTay 2
A
Array 3
Anay4
B 6 Affay1
C 2 Arrays
•
TABLE l
•
Power dblribution, er-'±(%) Fission rate ratio, O'"'± (9') (Keff) theor -. (Keff) e.xp.
Burov 2 BumvS G-rn-s Burnv 2 Bumv S G-IB-S lurnv 2 BwnvS G-11-I-S
l, 4 2. \S - -
-
-
+o. 0117 -0. 0012-1. 4 2. $ 4.2 7.6 2. 3 2.3 +o.0075 -0. 0015 -0. 0101
l. 1 1. 1
-
7.7 1.9-
+o.0065 -0.0026-3. 2 2. 21
-
9.3 2.8 - +o.0164 +o.0013--+-0. 0094 to -0. 0053 to
o.
8-1. 4 1. 8-2. 0-
-
-
--+o.0180 -+-0. 0073
1.6;3. 4 - -
-
-
- +o. 0089;-
-+o.0170
A = DIMPLE REAC10R B = SAX10N PROGRAMME C=PRCF
,_.
[image:12.894.116.772.134.596.2]11
-2. Development and modification of the codes used for the research program
FLARE code
To improve the FLARE code as a calculation tool, it was trans-lated from the FORTRAN II to FORTRAN IV language so that it could be used with an IBM 360/65. At the same time. a sub-routine was developed to enable the FLARE code to use Haling' s technique which determines the optimum power distribution over an entire irradiation phase on the basis of the operating conditions at the end of that phase. In addition. the number of nodes was increased from 12xl2x8 to 16x 16xl6,whichthus permits a more accurate representation of local con-ditions in the core, especially in the axial direction.
AGENA code
Like FLARE. this code for fuel cycle cost calculations was trans-lated from FORTRAN II into FORTRAN IV for use with the IBM
360/65.
RIBOT code
The translation of this code, which is a point burnup code, into FORTRAN IV language was rather painstaking as several variables had to be transformed from single to double precision because the first
re-sults were not quite in agreement with those obtained with the FORTRAN II code. This inconvenience was due to the fact that the data are rep-resented with a slightly smaller number of significant digits
in the
processor of the IBM 360 than in that of the IBM 7090, and at times, especially in the case of differences between almost identical data. the result loses precision.
BURNY-2 code
This code was also fitted for use with the IBM 360/65 computer.
RIBOT -5-SQUID code system
Work is under way to link the 5-group RIBOT and SQUID codes. This burnup code system, which can be used in both the five-group (two thermal+ three fast) and two-group (one thermal+ one fast) versions.
permits the solution of problems having a larger number of poi~~. com-ponents and geometries and thus affords an analytical tool by far
S'!Jpe-rior to the BURNY -2 code. At any rate, the latter is still an e~ceUent means to solve optimization problems. thanks to its. flexibility and low time consumption. The RIBOT-5-SQUID system. however. is still themost suited to represent the relationship between U-235 and Pu-239 reaction rates in uo
12
-TASK III - MINIMUM CRITICAL LOAD WITH PLUTONIUM PROTOTYPE ELEMENTS
The work performed under this task consisted in determining the minimum critical loads and in selecting the 3x3 configuration with ura·-nium and plutoura·-nium elements on which to perform the power distribu-tion measurements. In addition, preliminary measurements on short fuel pins were performed at the station to perfect the technique for gam-ma scanning on individual plutonium rods.
1. ·· Determination of the minimum critical loads and selection of the 3x3 . configuration for power distribution measurements
For this purpose it was necessary to perform a number of calcula-tions to evaluate the reactivity involved and the related power distribu-tion. One of the criteria that were to be met in setting up the 3x3 con-figuration was that criticality was to be reached with the control rods inserted the least po::;sible so that they would not affect the power dis-tribution measurements, This condition can be met by replacing a
certain number of Zr channels with SS channels, thus rendering the 3x3 assembly just slightly overcritical,
An analysis was also conducted to find the relationship between control rod insertion, absorbed reactivity and level at which the induced perturbation of the radial power distribution becomes negligible. This analysis gives a rough idea of the maximum overcriticality of the 3x3 assembly which the rods can control, while meeting the condition set above.
1.1 Evaluation of t~er-turbation induced byy_bank of control rods on the radial power distribution__
· To evaluate the perturbation caused in the radial power distribu-tion of a 3x3 assembly by a bank of control rods, use was made of a three-dimension diffusion code (TRITON). For application to reactivity and axial power distribution measurements_, this code was verified by means of a one-dimension calculation with the FOG code applied to a typical ·channel. The results of the two calculations showed excellent agreement.
In view of the limitation of the TRITON code, it was necessary to exploit the characteristic modular nature of a core affected by bank in-sertion of all the control rods. Under these conditions it is possible to isolate a fuel element having partially inserted control rods at two of its corners.
'
'
'
'
I,,
ft,.
,,
II
to
t'I
,.
,,
"
I• JfII
ll =It ~&
lr---1.---'
1
I
'
8
-'I
fo
..._
'
.,
'
'I
'
'
7
'
-'I
-'
1
.,
t
4
Schematizazion on the horizontal plane
I
5
'
'
I
'
a
.,
,,
"
3
2
Schematization on the vertical plane
REGIONS
1.
Upper reflector Z. Lower reflector 3. Control rod 4. SS rod handle 5. Water gap6.
Z r Channel and adjacent water gap 7. Corner rod (Us= 1. 831,)8. Peripheral rod (U
2
=1. 831,)
9. Peripheral rod (Us=z.
411,) 10. Inner rod (Us=
Z, 411o)14
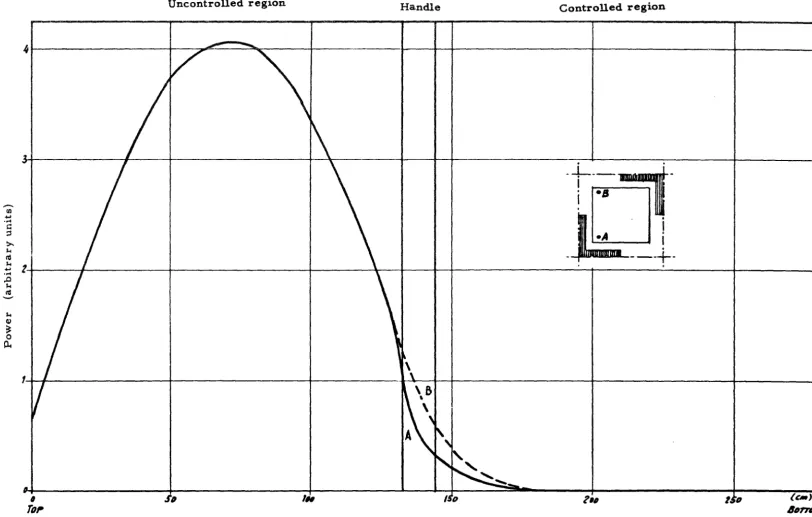
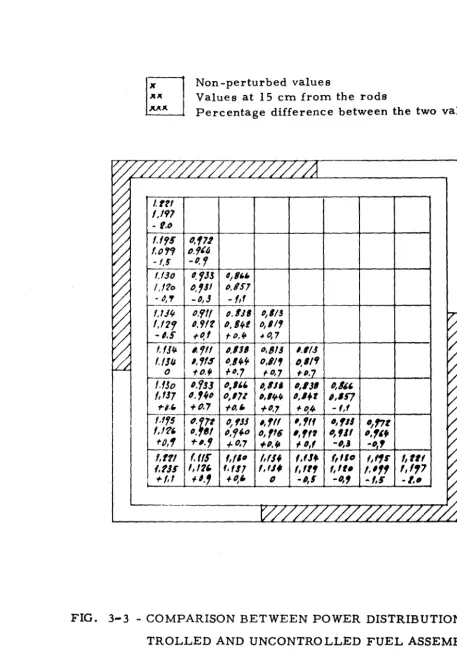
-Inc omparing the axial power distribution in position A (nearest the control rods) with that in position B (Fig. 3. 2), the curves appear to nearly coincide at about 15 cm from the rod insertion height (from the top of the control rods). The local power distribution of the fuel element at this level is compared with that of an uncontrolled element in Fig. 3. 3 The maximum deviation is found to be 2%.
At greater distances the deviation becomes negligible; so, it seems reasonable to conclude that a distance over 30 cm is sufficient to offset the perturbation. This is true also for other insertion levels, as in the
conditions of interest (2QOC) the characte-ristics of the moderator are axially uniform. A confirmation was provided by a calculation performed for the control rods positioned on the 28th notch.
The reactivity absorbed by the control rod bank, at the two insertion levels, was:
18th notch 28th notch
1. 41
/J.
K/K% 0~
24/J.
K/K%.On the basis of the foregoing considerations and of the fact that the gamma scanning equipment does not permit the upper 50 cm of fuel rod to be monitored, it may be concluded that the control rod bank is not to exceed 2/3 of total insertion. This means that the 3x3 assembly must be supercritical by 2. 5% at the most.
1. 2 Determination of the minimum critical load for enriched-uranium and plutonium elements
The purpose of these experiments is to evaluate the accuracy with which the calculation method determines K of plutonium elements. In order to obtain meaningful data for this as~ssment, it would be advisa-ble to have two configurations, one of enriched-uranium el.ements and the other of plutonium elements. Thus, through a comparison with the results obtained for the enriched uranium it would be possible to deter-mine the order of approximation which the calculation methods gives for plutonium elements.
In critical assemblies of these dimensions, radial neutron leakage is very high and any errors in their evaluation may compensate for er-rors in the K • As a result, it is necessary to form the two minimum
critical load~with the same number of elements and the same geometry so as to assume, with a fair degree of approximation, that. the errors on neutron leakage are the same in both cases.
Uncontrolled region Handle Controlled region
-
Cll....
....
i::
::,
L
k·A
I .
-
~
IA k •
---+-
'~
.
-J.4
Cl)
~
0
114
I
,
l\
_I I I I I'
To,-.,,
h• ISOFIG. 3 - Z - COMPARISON BETWEEN AXIAL POWER DISTRIBUTIONS IN THE TWOCOB.NER RODS
{C/IIIJ
[image:17.885.25.838.14.531.2]16
-Non-perturbed values
Values at 15 cm from the rods
Percentage difference between the two values
I.ft!
1,197
-
l.l'/5'·"
IJ,fl.tI.on IJ.?,~
- I.!
-0.1
(,/,30 I. 'f J!,
',''"
l,l?o /),
,,,
l>,8$7- J,,, -/J, J -f,f
UJ~ /J,f// o.lJI o, Ill
Ul'f /), 9/'l I>, lt,t o, 11, -1.5' +l>,f
t "·"" +O, 7
1./Jfl. ,. '!ff l>,111 0,8/J 1.1/.J
l.!!IJ I, '/IS 0,lt,.'; D,l/'I D,ll'I
0 +o.t, f d,7 fD,7 tD.1
/.fJo l>.'/JJ
11,,,,
~,,,
0,131 t>,I"f,fJ7
"·'""
IJ,171 D,l!ft,. l>,l+,t 1,6,Jt-U, + IJ.'7 f~I, +0,7 + 0,4
-
,,,
-;.,,s-
,_i;rz
"'fJJ,,,,,
,,,,,
0,,11 o,f7tf,l'l, fJ, ~, 1>, 'f f.O D,ff6
,,,,,
"''''
"·''"
+P,'f
.,.,.,
+ 0,7 +P,1/, f D,f -1,J_,,,,
f,t'll f. (IS' ,,, 111 /,fJ#
,,,J ..
1,110,,,,,,
l,ttf(,?JI
,,
'"'
f, , , ,,,,u
f,111 !,It• /,lff,,
,,,.,
+f,f+l.f
+ 0,1, (J -1,I-~,
-1,G -1,oFIG. 3-3 - COMPARISON BETWEEN POWER DISTRIBUTION OF
[image:18.715.144.601.96.751.2],,,,
,.,-0
,
1
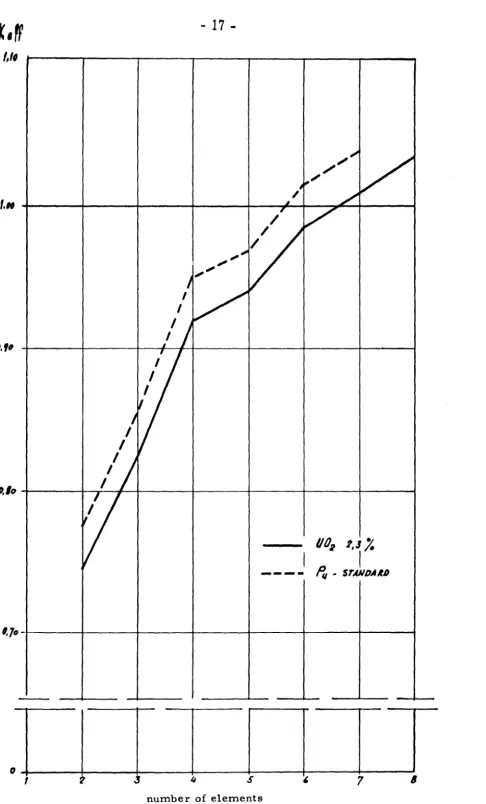
Fig. 3-4 - K eff
17
-U0
2 2,JJ.
I
- - - - ,1 -
STANDA~D.,
"
s'
7'
number of elements
[image:19.713.62.549.43.848.2]18
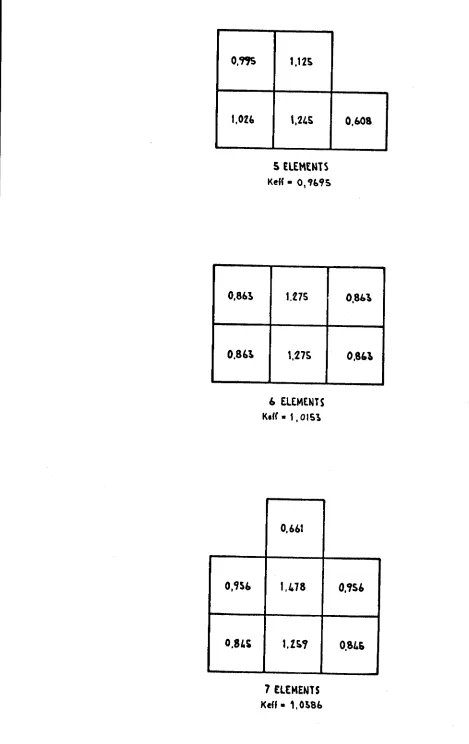
-K ff as a function of the number of elements for both types of fuel. Fig-uies 3, 5 and 3. 6 give the corresponding bundle power distributions.
As well be noted in Fig. 3, 4, the forecast indicates that critical conditions will be reached with a different minimum number of elements, that is, six for the plutonium fuel and seven for the uranium. To satisfy the condition formulated previously, the plutonium fuel assembly should contain seven elements. Fig. 3. 4 also shows that an ass·eml:51y bf this size would be supercritical by about
4%.
On the other hand, in view of the uncertainty in the evaluation of the excess reactivity of an assembly through control rod calibration, it is advisable not to exceed a certain supercriticality value (less than 2%).
For this reason, it is deemed preferable to set up a uranium assembly containing a few plutonium elements, in the same geometry of the ura-nium minimum critical load.
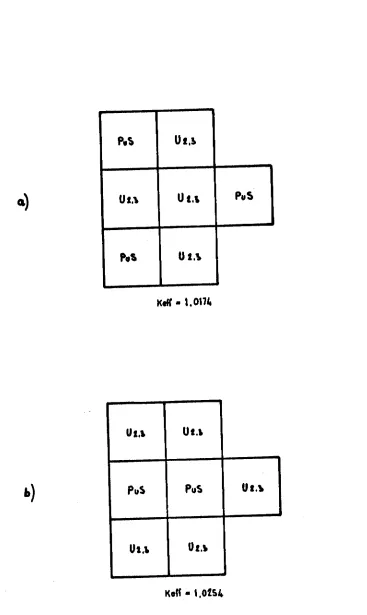
Reactivity calculations were performed for the two mixed configura-tions shown in Fig. 3. 7, comprising respectively two and three plutonium elements. The expected K ff values for these two configurations are
1. 0254 and 1. 01 74 respectively, which are quite acceptable for the pur-pose of the measurements, If the expected figures should turn out to be incorrect and the criticality- of the uranium assembly should require other than seven elements, the final size of the plutonium assembly will be
selected on the basis of the information available at that time ..
1. 3 3x3 assembly for power distribution measurements
In selecting the configuration of the 3x3 assembly for power distribu-tion measurements of the individual elements, the following criteria were adopted.
a) Limitation of supercriticality
As stated in the previous paragraph, control rods cause perturbation in the radial power distribution within 30 cm from their tips. So, for these
measurements it is necessary to contain the supercriticality within lim-ited values (below 2. 5%) so that excessive rod insertion will not be re-quired. The use of SS instead of Zr channels will help meet this condi-tion,
b) A sufficiently flattened radial power distribution.
For measurement of local power peaks inside the fuel elements, it is well to have as flat a power distribution as possible; this can be achieved by proper positioning of the different elements and an appropriate use of SS channels.
c) High degree of symmetry.
0.1,2
0,84f
o.,"
0,81.4
0.,,1
,
0,1l.l.
1,21,
,.n,
I, ELEMENTS KeH •
o,
,8&10,,,1
1,481
1.1,1
7 ELEMENTS
l(eff • 1,009t
0,8,t
\,&51
1,110
8 £LEMtNTS KeH • 1,0'!.\'
0,8'91
0,8'-t
o.,ss
0,81.4
0.71.a.
t
,170
0,8?.\
o.m
1,024,
0,86?.
o.s,1
0,9S6
o.s,,
1,12S
1,21.S
S ELEMtNTS
KeH • O,
''-9~
l.t7S
1,27S
6 ELEMENTS Kell• 1,0IS'?.
0,661
1,478
1.z,,
7 ELEMENTS Keff • 1, 0!>86
o.,oa.
0,861
o.s,i
o.,s,
0,&4&
[image:22.698.138.607.45.789.2]21
-P,\ Ut,i
UI,\
u,.,
PuS,.,
Ut.\Keff' • I. 0174
U1.1 Ut.1
Pu$ Pu\ U1.,
Ui., Uu,
Koff• 1,01S4
[image:23.577.86.453.80.695.2]22
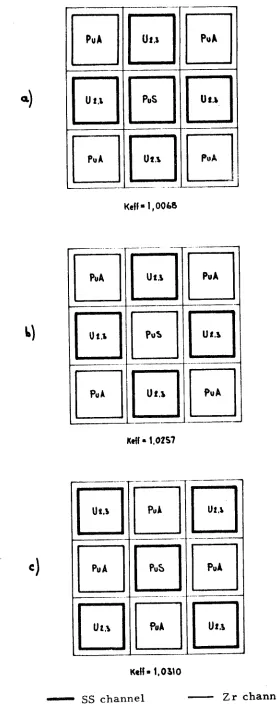
-d) Presence in one octant of the three types of fuel elements (2. 3% enriched uranium., standard plutonium and advanced plutonium). For practical reasons, the measurements will be limited to three elements, one for each type, and they will have to be located in the same octant so that the study may be carried out on a compact region.
e) Proximity of uranium elements to standard plutonium elements. This condition will permit the theoretical assessment of the power sharing effect to be checked.
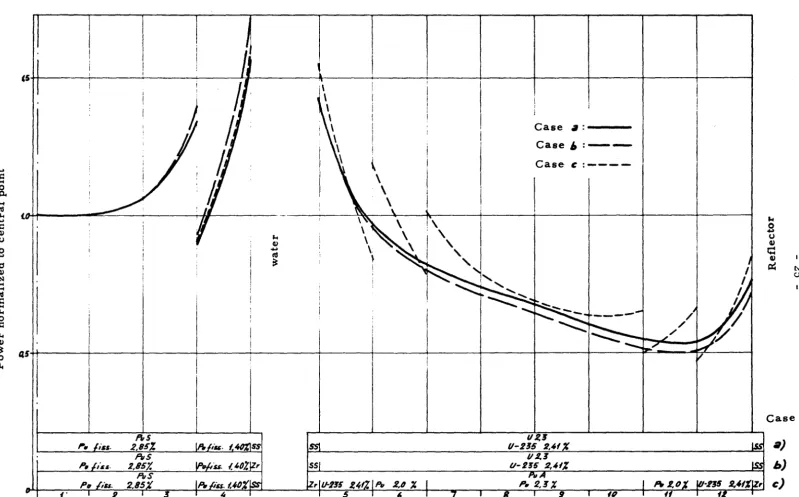
Fig. 3. 8 shows the three selected configurations meeting the above-listed criteria. The detailed calculations were performed with the RIBOT-5-SQUID code and the Keff obtained for configuration a)
- - which is the best from the standpoint of power distribution - - was 1. 0068. Since this figure is on the same order of magnitude as the error to which the calculation method is subject (0. 7%) the calcula-tions were repeated also on the other two configuracalcula-tions b) and c), which gave respectively 1. 0257 and 1. 0310.
In Figs 3. 9 and 3. 10 the calculated power distributions for the three configurations refer respectively to one of the main axes and the diagonal.
The rod power distributions will be calculated on the basis of the actual plutonium contents in each rod, of the position and actual orien-tation of the fuel elements. Data on this point are still being collected. A verification of the shutdown margin was performed on configuration a) of Fig. 3. 8. The reactivity was found to be 0. 82 with all rods in, and 0. 92 with the highest-worth rod out. These margins are so wide that it was not considered worth while to extend the verification to configurations b) and c).
2. Preliminarv measurements for the development of a gamma scanning technique for plutonium fuel rods
The purpose of these measurements was to:
a) Test the equipment
b) Determine how the fission product gamma spectra varied with time c) Establish the counting and data processing techniques
d) Determine exposure and decay times, neutron flux levels, and the doses received by the personnel handling the elements.
For the measurements, six short pins were procured with the fol-lowing isotopic compositions:
- . ·-·--·
[:]
B B
a.)
E] [:] E]
· - - ·
-[:][:][:]
. -··- . l
Kefl • 1, 004'&
- - - · · - - ··- ~ - -·--·--- -·-r- ·- ----·
G
G
G
B
[:]
B
---~
-[:]
G
G
· -
·
-Ktff • 1,02S7
- - - - -
----
---·-··---GEJG
-----c)
[:J [:]
G
---
-·-- --- ·-·-G EJ -G
Kell• 1, Ol\O
- SS channel Zr channel
[image:25.703.123.400.64.775.2]....
i::...
0 0.-C5 t
\
\
Case
a=----Case
I , =
-Case c :
-"'
,... (D:II-
~ . I'1
\ \
....
i:: Qj u 0....
"Cl Qj N...
-
"'
s
,... 0 i:: ,... Qj ~ 0 p.. ,... Qj....
"'
~ti1!1
I
I
I
!
I
I
I
I
I
=,r=-
17
I
~. liss.
P,
/,16S-,.
P,, 2,11 %~
'
V-Z,8 V-2~5 R,4f
Vl.8
U-2~fi ~,,ff%_
P, ~-~ X
g
FIG. 3-9 - POWER DISTRIBUTIONS CALCULATED ALONG THE MAIN AXIS FOR THE 3x3 ARRAY
P. ,I.D
'"
Fuel rods'
...
B
u G) ~ Qj~ (\j
01
Case
a)
b)
[image:26.914.34.834.153.650.2]....
i::....
0 p......
Cl! ,..."i= (DI ~ ----=J
U
Q) I II ~ n ·• I
0
....
'O (1) N....
....
Cl!a
,... 0 i:: ,... Q) ~ 0~
aGr:,
---+--P,,£,_~g,_85% F,,c Q)
....
Cl!;::
Case a :
-case 1 : , : -Case t::
-I·
PuA
2.4f%1 P, 2.0% I Pu !.2% Pu 2.0"/. IV·23'S
Pv2,0J.
p,,A
P,,fiu. 2,85% Pu fin. (401. Fi, fiss. 0, 74% r f'll/-23'5 {.83'%!U-2J5 2.41%1 Pu 2,0%
l
Pu !2 %P,,S II 2,3
D Pr 2,86%, R, ,u.lAO% I'll U-2~5 /,BJ'); V-2:!~ 2,41% • --- .,.- _
1 2 3 5 6 7 8 9 {0 ff
·-FIG. 3-10 - POWER DISTRIBUTION CALCULATED ALONG THE DIAGONAL FOR THE 3x3 ARRAY
[image:27.893.153.830.9.527.2]26
-These pins were approximately 15 cm long and had the same struc-tural characteristics of the normal plutonium and enriched-uranium fuel rods as shown in Fig. 3. l 1.
2.1 Description of the equipment
The test equipment is the same as will be used on the actual elements and it consists of three main parts:
a) Rod movement and positioning mechanism b) Shield and detector system
c) Detector pulse analyzing system.
Figs 3 .12 and 3.13 show the rodpositioningmechanism;Figs 3.14 and 3.15
show the shield and detector system. This equipment has all been installed in the fresh fuel vault.
The pulse analyzing system comprises two 400-channel analyzers of Laben make, complete with multiscaler and printer. The print-out system for the two analyzers differs in that one (chain 1) is very fast (400 channels in one minute) and operates in parallel., whereas the other (chain 2) has a lower printing speed (400 channels in 16 minutes) and operates in series. Because of this, a different measurement technique has been adopted: in chain 1 each spectrum is printed before inte gr at ion, whereas chain 2 is used only for integration of the spectra and print-out of the integrals.
All the instruments are located on a walkway at about 4 meters above ground (Fig. 3.16).
2. 2 Measurements
The measurement program was subdivided into the three following stages:
a) Measurement of the neutron flux in the irradiation channel b) Development of the measurement system and pin irradiation c) Miscellaneous measurements.
The thermal neutron flux measurements in the position where the short pins were to be located were taken between May 6 and 12, 1968. Copper disc monitors, 9 mm in diameter and O. 2 mm thick, were irra-diated in pairs, one disc being cadmium-coated to provide the epither-mal component. After irradiation, a 2"x2" photoscintillator and a multi-channel analyzer were used for the counting.
The neutron flux distribution along the channel was first measured with a tungsten wire and then with a copper wire. The channel in ques-t ion is normally used for inserques-ting neuques-tron counques-ters as parques-t of ques-the reac-tor control equipment; it crosses the main biological shield obliquely till it emerges in the gap between the shield and the pressure vessel in
~ .
i
-·t1.-(fJ
q>
I
ITEM
1
2
3
4
5
~
-
,,o-DESCRIPTION N.off
END CAP 1
THREADED END CAP I
FUEL PELLET 11
RETAINING SPRING 1
CAN 1
FIG. 3-11 - PLUTONIUM OR ENRICHED URANIUM SHORT PINS USED IN PRELIMINARY MEASUREMENTS
-w-MATERIAL
ZIRC 2
ZIRC 2
PuO /UO
2 2
E.N. 49
ZIRC. 2 I
i
N
[image:29.889.18.835.33.600.2]11111111111111111
uuJU.IUUUI I I
t
FIG. 3-12 - FUEL ROD POSITIONING MECHANISM FOR
[image:30.697.138.688.52.757.2]FIG. -3-15 - VIEW OF GAMMA-SCANNING MEASUREMENT SYSTEM
C..:>
FIG. 3-16 - SCAFFOLDING FOR GAMMA-SCANNING EQUIPMENTS
w
[image:34.868.61.784.24.538.2]33
-Fig.3. 17 shows the thermal neutron flux distribution in this channel. It will be noted that the only area with an acceptable flux gradient lies between 11. 5 and 12. 5 meters' depth. This was the area selected for pin irradiation.
During the second stage, completed on May 19, the shield was built, the detector chains were calibrated and the first adjustments in the
mea-surement technique were made.
Three pins, one of each type, were irradiated one hour each together with the flux monitors. The thermal neutron fluxes and the cadmium ratio for the three pins were:
U pin
Pu - Type A pin Pu - Type C pin
f,
n/cm2/sec 5.0. 109 3.1.109 2. 7 . 109CR
6.4
4.4
3.6
The day after the irradiation, the fission product distribution along the three pins was measured, The results of this measurement is given in Fig.3.18, and it indicates that the distribution is rather uniform in the central part of the three pins.
The short pins were then inserted in one of the guide tubes for the other measurements.
The third stage began on May 19 and was completed on June 19. It covered the main measurements, namely,
a) Measurement of the background radiation spectra and specimen spec-tra at different times.
b) Measurement of the radiation level on the guide tube surface in cor-respondence of the specimens.
Measurement (a) was taken twice a day during working days and once a day on holidays. Measurement (b) was always taken once a day.
2. 3 Gamma measurements
After a few modifications, the technique for the measurement of gamma ray spectra was finalized on May 23, as follows:
a) The guide tubes carrying the pins were placed on the gamma scanning equipment at a certain constant angle.
b) The analyzer was calibrated on 400 channels, with a threshold at 200 keV, corresponding to 5 keV / channel.
Date: 7-5-68 Thermal power: 480, 8 MW
Electrical power: Max Flux peak
154 MW
3 x 10⁹ n/cm2 sec.
~o---.---"T""---..---.---...---1~---~---~
.a
><
;j
...
4-<
... nS
E
,.,
Q)
..c: ... ,I,
Q)
>
....
... nS~
I
.4
·'
7
I
I
I
I
I
I
I
I
I
I
IO
,,
If 13FIG. 3-17 - THERMAL NEUTRON FLUX DISTRIBUTION ALONG THE
CHANNEL CHOSEN FOR SHORT-PIN m.RADIATION
\ I
'"'
I
I'S
Depth (m)
I c.:,
[image:36.882.98.720.42.466.2]8r>-r---r---r---.---,---.
Pu
i:'"
,o
i.n
0
-
~-
.
u
~
rn
"
u->,
.;: 4-0
>
--~-t>u-;.1
~....
...u Cl!
~
8
8
Cl!
OD
rn rn 0
i..
d
•I
I
1
I
--1'.
I
0
.s
(cm) l!J ~I}
es
10
FIG. 3-18 - GAMMA-ACTIVITY ALONG THE THREE SHORT PINS
c.:)
[image:37.875.35.822.11.511.2]36
-d) Since the 480-keV reference peak did not always occur in correspond-ence of the same channel, a correction was made for the asymmetry of the peak channel by means of a computer program which determines a fraction of a channel used as the starting point.
e) The 1. 6 MeV La-140 peak occurred between channels 268 and 272; by adjusting the amplification it was possible to keep the peak within these limits except for a short period. However, it was experimentally proved that even when the peak shifted to channel 277, the integral re-mained constant within the measurement error. The integration was performed on 40 channels, the first and last being selected across the peak so that the line joining them was horizontal. When this was not possible, two adjacent integrals were averaged so that the lines join-ing the channels at the extremes intersected.
f) The background radiation was measured a first time with the unirra-diated pins in front of the collimator and immediately after without the pins. Subsequently, the background radiation was measured every day without the pins, The difference between the first two measure-ments represented the radiation contributed by the unirradiated ura-nium and plutoura-nium, for which all the spectra were to be corrected. Instead, the daily measurements gave the external radiation which must be detracted from every spectrum.
2. 4 Difficulties encountered during the measurements
a) The high temperature in the measurement room, normally between 3 9 and 400C, interfered considerably with the whole test. It particularly affected the operation of one of the two analyzers so that the second chain was in service only for a limited number of days. Moreover, it was not deemed advisable to keep the instrument in continuous opera-tion, and the scheduled automatic night measurements were given up.
b) The rotating equipment could not be used at that time as it had not been completed.
c) Sometimes the spectrum integrator gave erroneous results, so that all integrations had to be performed by hand. This inconvenience, however, appeared to be due to the high temp~rature, because when the instrument was brought to a room temperature of about 200c it operated continuously for 24 hours and always gave correct results.
37
-2. 5 Test results
2. 5.1 Radiation levels
Table II gives the radiation levels measured on the surface of the guide tube in correspondence of the three pins. The values were ob-tained with two different portable ion chambers: CUTIE PIE (CP) and
ECKO 555. The discrepancies between the two sets of values depend on the larger sensitive area of ECKO which tends to average the levels and thus does not permit a good localization of the point of measurement. Fig.3.19 gives the radiation versus time curve, normalized for a thermal neutron flux of lx109 n/cm2 /sec for the pin with the highest activity, that is, the type C plutonium pin with 2. 855% of fissile plutonium.
2. 5. 2 Gamma spectrometry
Table III summarizes the results of the gamma spectrometry ob-servations for the period between 15 and 30 days after irradiation. Column 1 gives the number of filed spectra. Column 2, subdivided in three parts, gives the date, the time of the measurement, and the in-terval between irradiation and measurement. Column 3, also subdivided
in three parts, one for each pin, gives the gross gamma integral ex-pressed in pulses per second, net of the background and pin activity. Column 5 gives the time function, f(t), for La-140 decay.
2. 6 Analysis of the results
2. 6.1 Gross gamma measurements
On the basis of the technical literature, an analytical expression was sought to express the results (C} of the gross gamma scanning in the form:
C = A t-B
where A is constant for a given neutron flux, macroscopic fission cross-section, detection efficiency and geometry of the source;
B is constant for each type of fuel.
The following expressions were found for the three
U pin
Type A Pu pin Type C Pu pin
C = 890 OOO t-1.401 C = 654, 460 t-l. l 6 lO C = 1 532, OOO t-1. 1876 , ,
pins:
The cooling time during which these expressions are applicable is the period between the 15th and 30th day after irradiation, but the
expres-sions can certainly be extrapolated for a few days beyond this interval.
38
-TABLE II
RADIATION LEVELS (mR/h)
DATE CUTIE PIE EKCO 555
~ T lf
Days u Pu "A" Pu "C" u Pu "A" Pu "C" Days
13
-s
0 - - 250,000-
--14 ,..5 0,7 - - 500 - -
-16 -5 1,6 - - 100
-
--17 -5 2,7 - - 70 - -
-20 -5 5,6 - - 44 -
-
-21 - 5 6,6 - - 34 - -
-22 -5 7,6 24 20 31 25 21 31
23 -5 8,7 21 17 25 20 18 28
24 -5 9,6 18 15 24 18 15 20
25 -5 10,7 17 13 22 17 15 25
26 -5 11, 7 13 11 21 14 13 20
27 -5 12,6 14 13 20 14 12 14
28 - 5 13,6
-
- - 12 11 1829 -5 14,6 - - - 13 11 18
30 -5 15,6 11 9 14 11 11 15
31 -5 16,6 7 5,5 11 13 10 17
1 -6 17,7 7 6 10,5 10 8,5 14
2 -6 18,7 7 6 11 8,5 8,5 11
3 -6 19,6 6 5,5 8.5 - -
-4 -6 20,6 5,5 5 8.5 - -
-5 -6 22,0 5 5 8.5 8 7 11
6 -6 22,7 5 5 7 7 7 13
7 -6 23,6 5 4,5 7 7 5,5 9
8 -6 24,7 5 4,5 7 7 6 10
9 -6 25,7 5 4 5. 5 6 5,5 9
10 -6 26,6 4,5 4,5 7 5,5 5,5 to
11 -6 27,6 5 5 7 5,5 5;5 8
12 -6 28,6 5 4 6 5 5 8
[image:40.584.52.529.202.720.2]-•
•
'
•
~-'
•
I-•
'
1•
I 4 I'
t:'
•
.,
I I•
I•
t 11 • « ·-I I I · .. 'i I\
\
\
-~
- --I ~1lii...
-~-
,,
.
•
'-~
•
[image:41.708.15.564.39.806.2]~
h..•
--~
. --····-·---·-~
•
•
...
--··-···---·...
T
.
.
.
.
,1 .
,.
.
.
. .
..
; to
days after irradiation
FIG. 3-19 - DOSE VARIATION VERSUS TIME FOR THE Pu "C11
PIN (Puf 2. 855%) NORMALIZED FOR A THERMAL NEUTRON FLUX OF 109 n/cm2 s
..
-•
40
-TABLE III
ANALYSIS OF SPECTRA - CHAJN I
(Values of integrals in cps)
140
DATE GROSS-GAMMA INTEGR. La INTEGR.
N.
f(r)
Spectru Day Hour A, T,h u Pu "A" Pu "C" u Pu "A" Pu "C"
16 27-5 16,30 335, 0 1170,5 770, 5 1547,3 95,7 57,4 113, 1 0,4667
17 28 9,30 35Z0 1110, 6 715,7 1447, 8 93,0 55,0 108,0 0,4498
18 28 16,00 358, 5 1091, 7 703, 7 1413, 7 90,7 54,4 107,0 0,4434
19 29 10, 30 377,0 1022,7 667,2 1332,4 86,8 52, 3 100,4 0,4258
20 29 16,00 382, 5 1010, 2 656,0 1310, 6 85,75 51,4 100,6 0,4207
21 30 10, 30 401, 0 953, 1 620,5 1232, 9 82,0 49,0 96,1 0,4037
22 30 17,00 407,5 949,2 614,4 1214, 5 81,8 49, 1 95,0 0, 3980
23 31 10,00 42~5 898, 1 584,1 1157, 8 77,7 47,4 91,5 0,3833
24 31 16,00 43Q 5 884,9 574,5 1138, 6 76, 7 46,0 90,2 O, 3781
25 1-6 11,30 45QO 836,2 548,7 1046,6 73, 1 44,5 85,7 0,3620
26 2 11,00 473, 5 796,3 506,4 1018. 1 70,05 41,2 80,5 0,3434
27 3 10,00 496, 5 758, 7 484,5 964,4 66,2 39,96 77,2 0,32616
28 3 16,30 503, 0 748,9 478,8 948,6 65,8 39,0 76,4 0,3214
29 4 10,00 52Q 5 714,5 462,4 910, 1 62, 3 38,4 73,0 0,3093
30 4 16,00 526, 5 703, 1 455,7 896,2 60,8 37,·0 72,2 0, 30475
31 5 17,30 552, 0 672,2 429,6 852,8 58,9 35,3 68,1 0,2878
32 6 11,00 569,5 649,7 412,8 821,0 56,8 33, 7 65,5 0, 2733
33 6 16,30 575,0 643,7 406,3 810,3 56,3 33,3 64,7 0, 2733
34 7 10,00 59Z5 613,8 399,4 783,3 53,5 32,2 62,8 0,2627
35 7 16,30 599,0 610,2 394,6 774,2 52,8 3115 62,2 0,2589
36 8 11,00 617,5 591,2 377,8 746,4 50,45 30,1 58,8 0,2484
37 9 10,30 641, 0 568, 1 357,0 712, 9 48,1 28,3 56,0 0,2355
38 10 10,00 66'\ 5 535,2 347,0 682 3 45,0 26,9 53,3 0,2234
39 10 16,30 671,0 528,5 345,7 675,6 44, 1 26,95 52,6 0, 2201
40 11 9,30 688, 0 516,5 332,8 654,a 43,0 25,95 50,1 0,2119
41 11 16,30 695, 0 509, 1 327,6 645, 5 42,3 25,6 49,9 0,20855
42 12 10,00 712,5 497,2 319,6 623,0 41,4 24,6 47,60
'3 12 16,00 718, 5 493,3 315, 2 622,8 40,24 24,18 47,23
44 13 11,30 739,0 475,0 304,6 599,0 38,8 22,9 44,8
[image:42.706.157.682.210.749.2]41
-TABLE IV
PERCENTAGE DEVIATIONS BE'IWEEN CALCULATED AND EXPERIMENTAL VALUES
140
CROSS GAMMA La
N. 6 T, h
Spectrum u Pu "A" Pu "C" u Pu "A" Pu "C"
16 335,0 0,57 - 0, 53 -0,60 -0,59 -0,52 -1, 73
17 352,0 0,17 1,09
o,
10 - 1, 43 0,06 -0,7918 358,5 0, 19 0,65 0,30 -0,35 -0,27 -1,3;>
19 377,0 0,59 0, 15 0,20 - -0,38 0,02
20 382,5 9,20
o,
15 0, 10 - 0, 14 -0,3821 401,0 0,60 0,24 0, 70 0,35 0,79 0,06
22 407,5 -0,82 -0,66 0,20 -0,82 -0,83 -0,20
23 424,5 0,06 -0,33 0,20 0,55 -1,07 -0,21
24 430,5 -0,06 -0,30 0,20 0,48 0,56 -0, 15
25 450,0 0,55 -0,86
-
0,93 -0,47 0, 6126 473,5 -0, 37 1, 25 0, 10 -0,07 1,94 1, 58
27 496,5 -0,94 0, 19 0, 10 0,42 0,13 0,63
28 503,0 -1,12 -0, 15 - -0,43 0,82 0,20
29 520,5 -0,31 -0,72 - 1,18 -1,47 0,91
36 526,5 -0,01 -0,51 0,20 2,12 0,76 0,54
31 552,0 -0,92 -0, 09 -0,30 -0,40 -0,24 0,66
32 569,5 -1, 07 0, 27 -0,20 -0, 70 0,45 0,62
33 575,0 -1,24 0,73 -0, 10 -1,06 0,41 0, 61
34 592,5 0, 10 -1, 04 -0, 30 0,08 -0, 18 - 0, 35
35 599,0 -0,56 -1, 10 -0,40 -0,05 0,55 - 0,85
36 617,5 -0, 85 -0, 27 -0,30 0,36 0,96 0,62
37 641,0 -1,14 1, 05 -0,20 -0,20 1, 78
o,
1738 664,5 0,72 -0,29 -0, 10 1,17 1,58 -0, 16
39 671,0 1, 53 -0,35 0,40 1, 70 -0,07 -0,32
40 688,0 0,33 -0, 15 - 0,44 -0,09 0,74
41 695,0 0,61 0,27 - 0,49 -0,32 -0,44
42 712,5 0, 14 -0, 16 0,60 -0,59 -0,30 0,30
43 718,5 -0,02
o,
25 -0,20o,
17 0,06 -0, 2644 739,0 0,54 0,42 0,20 -0,79 0,89 -0,41
45 762,5 1, 52 1, 02 - 0,63 0, 18 -0, 19
··-~ ., .... ·
-negative deviations 14 (-) 16 (-) 11 (-) 13 (-) 14 (-) 14 (-)
zero deviations 5 (0) 2 (0)
positive deviations 16 (+) 14 (+) 13 (+) 15 (+) 16 (+) 16 (+)
____
.._ [image:43.709.21.556.234.806.2]42
-negative and positive deviations, the distribution of the points suggests a discrepancy between the analytical expression and the experimental re-sults.
At any rate, the formula was accepted because, within an error of 1
%,
it provides a linear interpolation for fuels whose enrichment is inter-mediate between the enrichments of the fuels used for the tests accord-ing to the followaccord-ing formula:5 5 9 9
df
r
.c:,{+df.f
/3
B = - - - -
5 5 9 9er ·
f
+
Ct"f • ~where
o·r
g are the fission cross-sections for U-235 and Pu-239r/'
9are the enrichments in U-235 and Pu-239, respectively
ot.,~
are the indexes for U-235 and Pu-239, respectively.Since for enriched uranium oc = 1. 1401, and assuming
~Iv!=
1.38 which corresponds to a Maxwell spectrum, the formula applied to type C fuel gives/3
= 1. 198, With these values of« and (3 it is possible to com-pile decay tables for the various types of fuel that will be used during the measurements in order to refer the experimental data to a given time.2. 6. 2 La-140 measurement
The data in Table III, referred to the period between the 15th and 30th day of cooling, were used to determine the apparent halftime for the three fuels according to the minimum square method. The following values were obtained:
u
Type A Pu Type C Pu
h. t, ~ 12 7 9 days
.±:
1 % h, t, = 12, 78 days.±: 1 % h . t . = 1 2 , 7 9 days .±: 1 %As one can see, the deviation from the value of 12. 8 days given in the literature is within the experimental error,
The deviations between theoretical and experimental values are listed in Table IV- as a function of cooling time. The standard deviation with a 95% confidence level is comprised between the following limits:
0. 64 - 1. 08 for U
0. 63 - 1. 06 for Type A Pu 0, 55 - O. 92 for Type C Pu
43
-2, 6, 3
Relationship between the two counting chainsSo far, only the data of chain 1 have been analyzed. In fact, chain 1 operated continuously, whereas chain 2 permitted only a limited num-ber of measurements and, owing to its low printing speed, it did not permit complete spectra to be preserved.
At any rate, by performing the same kind of calculations which led to the compilation of Table III, and by dividing the values in Table III by the corresponding ones of chain 2, the results tabulated in Table V were
obtained. The ratio between values is always very near unity; this means that, within an error of 1-2%, the two chains are identical from the
stand-points of efficiency and geometry.
2. 6. 4 Determination of the radiation levels
If on the basis of the data in Table II and Fig.3 .. 19 we wish to deter-mine the radiation level on the surface of the upper part of the fuel ele-ment to be disassembled and re-assembled for gamma scanning, it is necessary to start with a few empirical-theoretical considerations. Owing to the complex geometry and difficult location of the points of measure-ment, it is necessary to keep to a mere estimate of the order of magni-tude of the radiation levels. In doing this, the following data must be taken into account:
a) Unirradiated pins have a surface radiation level of about 1 mrem/h.
b) Irradiated pins, after 15 days' decay, have a surface radiation level of about 10 mrem/h.
c) Unirradiated fuel elements stored in the measurement room have a surface radiation level of 5 mrem/h at mid height and 0, 5 mrem/h at the top.
d) Since the neutron flux for these measurements will be twice the flux for the preliminary measurements, through a simple proportion we may expect to have a surface radiation of 100 mrem/h at mid height of the irradiated element and 10 mrem/h at the top after 15 days' decay.
e) The adoption of a safety factor of 3 is also recommended in order to take into account any inaccuracies in the measurements, the approx-imate assumptions at the basis of the calculation, and the possibility that the neutron flux is higher than antic :ipated.
In view of the foregoing, the following average surface radiation levels are to be expected:
44
-TABLE V
RATIOS BETWEEN THE DATA OF THE TWO COUNTING CHAINS
GROSS GAMMA LANTANIO
N. 6T, h
Spectrum U 2,4% Pu "A" Pu "C" U 2,4% Pu "A" Pu "C"
32 569,5 0,9949 - 0,9999 1,0125 0,8553 1,0077
33 575,0 1, 0072 1,0125 - 1,0199 1,0215 0,9985
34 592, 5 1,0026 1, 0104 1, 0169 1,0113 1, 0158 1,0145
35 599,0 1,0126 1, 0082 1, 0150 1,0000 1, 0194 1, 0130
36 617,5 1, 0137 1, 0093 1,0124 0,9980 1,0033 0,9932
37 641,0 1,0149 0,9969 0,9971 1,0148 1,0000 0,9947
38 664,5 0,9940 0,98/i7 0,9972 1,0022 0,9890 1, 0038
39 671,0 1, 0051 1, 0169 1, 0152 0,9977 1,0187 1, 0333
40 688,0 0,9943 1,0099 1,0009 0,9953 1,0097 0,9891
41 695,0 1,0033 1,0021 1,0148 0,9952 1,0322 1,0309
45
-2. 7 Conclusions
a) 'The Instrumentation provided for the measurements proved to be adequate as long as the room temperature remained within accept-able limits (20-250C).
b) It is advisable to increase the shield thickness to allow for the larger number of fuel elements present during the measurement.
c) The element should be irradiated for one hour and, to improve count-ing statistics, the maximum neutron flux on the 3x3 assembly should be 5x1 o9 n/ cm2 / sec at the elevation of the point of measurement.
d) Measurements should prefer2"!Jly not start before 15 days' cooling.
e) The procedure described in paragraph 2. 8 below takes about an hour in total for the measurements on one rod, esclusive of rod handling and repetitions in th~ event of erroneous measurements and instru-ment malfunctioning. The procedure tends to exclude instruinstru-menta- instrumenta-tion and integrainstrumenta-tion errors; statistical errors can be taken to be on the same order as those of the preliminary measurements, i. e. 1
%
with a confidence level of 95%.
2. 8 Proposed procedure for the measurements during the refueling outage
a) Use will be made of the same instrumentation utilized for the prelim-inary measurements, namely, two phototubes, two analyzers, and the lead shield with a 3-cm slot. The only difference will be the raising of the shield base by 40. cm to permit axial scanning of the whole rod (active length 275 cm).
b) The analyzers will be calibrated in the same way as for the preopera-tional ~sts, that is, with a threshold at 200 keV, and analysis of 400
channeis"'4p to 2.2 MeV.
c) Integration for gross gamma radiation will start 10 channels before the 480-keV peak and continue for 100 channels after the beginning of the lantanum peak. The integration for lantanum will be extended to 40 channels according to the technique described earlier.
d) The complete measurement of a rod will consist of the following opera-tions:
(1) 10-minute counting
(2) Print-out of the spectrum of chain 1
(3) Integration for lantanum and gross gamma scan on the two chains with double print-out of the integral
(4) New print-out of the spectrum of chain 1 to check that the memory content has not changed
(5) Repetition of operations 1 to 4 twice
(6) At this point, all integrals will be referred to a common time with the aid of the tables giving the time functions for lantanum and
measure 46 measure
-ment chains must be consistent; in the negative, it is necessary to find out which chain gave erroneous results and possibly also re-peat the measurement from the beginning.
e) After every two or three rods, it is necessary to measure the back-ground activity and to check the instrumentation efficiency by means of a calibrated sour~e, according to the procedure in d) above.
f) Three short pins of the type used for the preliminary measurements will be irradiated in a dummy element next to the 3x3 critical assem-bly and then subjected to counting as described in d).
47
-TASK IV - ISOTOPIC COMPOSITION MEASUREMENTS ON IRRADIATED
URANIUM FUEL
To integrate the experimental results available for the development of the calculation method under Task II, isotopic composition measure-ments and gamma scanning will be performed on a few uranium rods of one of the fuel elements discharged during the May 1967 shutdown, name-ly element A-106.
The measurements will be performed by the Institute for Transuranic Elements of the Common Research Center at Karlsruhe in the second half of 1968.
The work performed in connection with this task includes the pre-paration of a schedule for non-destructive (gamma scanning) and destruc-tive (isotopic composition) tests, and the study of the problems associated with the transport of the irradiated fuel rods from the Garigliano station to the Karlsruhe Center.
1. Schedule of tests to be performed on rods of element A-106
The element selected for the tests is A-106 which had reached an average burnup of about 9500 MWD/t when it was discharged on May 27, 1967. The average isotopic composition estimated from calculations performed on a tentative basis by ENEL is as follows:
U-235 1.18%
Total Pu 0.44%
Pu-239
o.
32%Pu-240 0. 08%
Pu-241 0.03%
Pu-242 abt 0. 005%
This element was selected because for the following reasons it lends itself well to provide a confirmation of the validity of the calcula-tion methods used in the design:
a) it has reached a sufficiently high burnup level so that the plutonium content is of the same order as the U -2 35 content;
b) it was located in a sufficiently central core location to minimize the effect of power tilting;
c) it was not affected by the proximity of control rods during the last 2000 MWD/t or so of burnup.