International Journal of Emerging Technology and Advanced Engineering
Website: www.ijetae.com (ISSN 2250-2459, ISO 9001:2008 Certified Journal, Volume 8, Issue 2, February 2018)
154
Image Denoising Using Empirical Wavelet Transform
K. G. Kirar
1, Nidhi Soni
21
Department of E&I, Samrat Ashok Technological Institute, Vidisha, India
2
Department of E&C, Samrat Ashok Technological Institute, Vidisha, India
Abstract—During image capturing and transmission, some interference are also included. The process of removing these kinds of unavoidable interferences is called denoising. This paper presents an adaptive approach for image denoising based on Empirical Wavelet Transform (EWT) method. Empirical wavelet transform builds a number of components adapted to the processed image. These components are analyzed and relevant components are chosen using threshold and denoised image is obtained from these chosen components. Experiments are done on image containing Gaussian and salt & pepper noise and results are analyzed on performance parameters such as mean square error, peak signal to noise ratio and structural similarity index measure.
Keywords—Empirical wavelet transform, Image denoising, mean square error (MSE), mean structural similarity index measure(MSSIM), peak signal to noise ratio (PSNR).
I. INTRODUCTION
The image usually has some unwanted interferences which gets introduced during image capturing or transmission, which is coined as noise [1]. In image processing, this noise is removed by various types of processes. Different types of methods have been developed to denoise the image; these are broadly classified into two categories which are spatial domain processing and transform domain processing [2]. In spatial domain image processing, the manipulations are done on pixels itself while in transform domain processing, the image is first transformed to other domain and then processing is carried out.
Sami Hussein Ismael, Dr. Firas Mahmood Mustafa and Dr. Ibrahim Taner [3] presented an image denoising technique based on discrete wavelet transform (DWT). This study includes coif, bior, rbio, dbey, haar, sym4 and db4 wavelet transforms for variable size of grayscale image. In this gaussian noise is used and finally, the denoised image is compared with original image using quantitative parameters such as standard deviation, MSE and PSNR.
The Empirical wavelet transform [4] is an adaptive method to decompose the image into its 2D amplitude modulated-frequency modulated (AM-FM) components or EWT components. This component decomposition is flexible in nature unlike the Fourier or wavelet transforms.
EWT constructs basis directly based on information contained in input image. This paper presents an approach to remove noise from image using EWT method. The results are then presented and compared on the basis of various performance parameters such as MSE, PSNR and SSIM.
The remaining of the paper is organized as given. Section II desribes literature review of existing methods. Methodology entitled has been discussed in section III which has two sub-sections. First sub-section of section III recalls the principle of EWT method and second one describes the proposed algorithm. Section IV depicts experiments performed and their results. Finally
conclusions are made and perspectives are given in section V.
II. EXISTING METHODS
In the field of image processing, noise removal is fundamental problem. There are various type of image denoising techniques but it can be broadly classified into two categories: Spatial domain image denoising and Transform domain image denoising techniques. It is then further classified into many other types. In spatial domain technique, direct manipulations are done on image pixels itself and its main advantage is its speed but on other side it fails to preserve edges of image. In transform domain image denoising techniques, first the image is converted into other domain, say transform domain, processing is carried out there and then inverse transform is performed to get back results in spatial domain. Wavelet domain approach is able to preserve edges significantly. It has excellent performance due to its multiresolution analysis structure.
A. Spatial Domain Techniques
This is a traditional method used to achieve denoised image from noisy one. This method conatins mainly two type of filters names as linear and non linear filters as explained below.
International Journal of Emerging Technology and Advanced Engineering
Website: www.ijetae.com (ISSN 2250-2459, ISO 9001:2008 Certified Journal, Volume 8, Issue 2, February 2018)
155
(a) Mean Filter: This filter follows simple sliding window
concept in which the central value of window is replaced by average of all nearest pixels. It is optimal spatial filter for removal of gaussian noise. Convolution mask is used to implement mean filter.
(b) Wiener Filter: To imply wiener filtering process on
image, the information of noise spectra and original signal should be known [5]. The performance of this filter suits well on smooth images.
2)Non Linear Filters: To remove noise using spatial filter,
low pass filtering method is applied on the pixels assumption that the noise occupies higher frequency region [6]. Non linear filtering removes noise to great extent but on other side it introduces blurr in image due to which edges becomes less visible. Simplest type of non linear filter is median filter.
(a) Median Filter: Median filter tends to remove impulse noise of random value. It is somewhat similar to averaging filter where rather than mean, the value of output is determined by replacing each pixel by median value of neighbourhood pixels. For extreme values, median is less sensitive than mean and therefore it helps to remove extreme values without reducing image sharpness.
(b) Spatial Median Filter: Spatial median filter (SMF)
filters by calculationg spatial depth between a point and set of point as given in equation 1
Sdepth = 1 – 1 ∑i χ – χi
N-1 || χ – χi || (1)
(c) Weighted Median Filter : In WMF, more weightage is
given to certain pixels in a window. As in centre weighted median filter, the centred pixel in window is given more weightage than others.
B. Transform Domain Techniques
Let f be the original image, „N‟ a white noise and V = f + N. Let D be a frequency domain filter. Define the risk of D as
r(D, f) = E{||f − DV ||2} (2)
where the expectation is taken over the noise distribution .
According to the basic functions, transform domain techniques is subdivided. The base functions can be either data adaptive or non adaptive.
1) Data Adaptive Transforms: In projection detection, key component analysis and factor analysis Independent Component Analysis (ICA) method gained importance.
To remove noise from non gaussian data, this ICA method was successfully implemented [7]. Application area of ICA includes data mining, machine fault detection, image processing, audio signal processing, radio communication etc. ICA assumes the input to be non-gaussian due to which, it helps to remove noise with gaussian as well as non-gaussian distribution. In comparision to wavelet based methods, ICA has more computational cost. ICA uses sliding window and it involves samples of same scene as in [8].
2) Non-Data Adaptive Transforms: (a) Spatial Frequency
Filtering : In this type of noise removal transform, noise is
removed by designing a frequency domain filter and adapting a cut-off frequency such as low pass filter is used by fast fourier transform. This transform may produce some artificial frequencies and it is time consuming.
(b) Wavelet Domain : Wavelet domain filtering is divided into linear and non linear filtering futher. In wavelet domain, generally wiener filter is used as linear filter. This filter is used for optimal results in case where gaussian noise is present and accuracy criteria is mean square error. Non linear threshold filtering uses the property of wavelet transform to map the noise in signal domain to noise in transform domain. By this, signal energy becomes more concentrated in fewer coefficients than noise energy. It includes non adaptive threshold method such as VISUShrink [9] which is totally dependent on number of data points. It provides smooth images and performance is measured in terms of MSE. The adaptive threshold technique includes SUREShrink, VISUShrink and BayesShrink method. SUREShrink has better performance than VISUShrink because SUREShrink is combination of universal threshold and SURE (Stein‟s Unbiased Risk Estimator) threshold. Wavelet Coefficient Model method uses the multiresolution chracteristics of wavelet transform. It provides better outputs but it is more complex and costly as in [10]. The wavelet coefficient modelling can be done in either statistically or deterministic way.
III. METHODOLOGY ENTITLED A. Empirical Wavelet Transform
International Journal of Emerging Technology and Advanced Engineering
Website: www.ijetae.com (ISSN 2250-2459, ISO 9001:2008 Certified Journal, Volume 8, Issue 2, February 2018)
156 This AM-FM components have a compactly supported Fourier spectrum. Here, segmentation of Different modes is equivalent to the segmentation of Fourier spectrum. Assume that the Fourier spectrum is divided into N segments. There is a limit between each segment ωn. Segmentation of the spectrum is an important task, because, this segmentation provides adaptability. Our aim is to separate different portions of the spectrum that corresponds to different modes. In order to divide the spectrum into N segments, we need a total of N+1 boundaries, but the limit of Fourier spectrum is in between 0 and π we need a total of n-1 extra boundaries. To find such boundaries first detect the local maxima in the spectrum and arrange them in the decreasing order. Assume that the algorithm found M maxima, two cases can appear: M≥N: The algorithm found enough maxima to define the required number of segments, and then we keep only the first N-1 maxima.
M<N: The signal has less modes than expected, then we keep all the detected maxima than expected, then we keep all the detected maxima and reset N to appropriate value.
With this set of maxima plus 0 and π we define the boundaries ωn of each segment. This is the centre between two consecutive maxima. (ω0=0 and ωn=π).
The Empirical scaling function and Empirical wavelet can be expressed as follows.
Scaling Function:-
1 if |ω|≤ωn-𝜏n
1(ω)= cos[𝜋/2β(1/2𝜏(|ω|-ωn+𝜏n))]
if ωn- 𝜏n ≤|ω|≤ ωn+ 𝜏n
0 otherwise (3)
Empirical Wavelet Function:-
1 if |ω|≤ωn- 𝜏n
sin[𝜋/2β(1/2𝜏(|ω|-ωn+1+ 𝜏n +1))]
if ωn+1 - 𝜏n +1 ≤|ω|≤ ωn+1+𝜏n +1
n (ω) = sin[𝜋/2β(1/2𝜏(|ω|-ωn+ 𝜏n )]
if ωn- 𝜏n ≤|ω|≤ ωn+ 𝜏n
0 otherwise (4)
B. Proposed Algorithm
Wavelets are useful mathematical tool which are can be efficiently used for image processing. 2D Empirical wavelet transform [11] provides a better approach for adaptive representation in which the basis is generated according to the information contained in the image itself. It consists of three main steps: first, detects the Fourier supports, secondly, build the corresponding wavelet according to those supports and at last, filters the input signal with the constructed filter bank to get different components. These EWT components are then analyzed and threshold technique is applied to select relevant components among them. The basic task of wavelet denoising is to effectively separate the image components from noise components in wavelet domain [12]. EWT component selection is done using some threshold techniques [13] [14]. There are two crucial parameters involved in wavelet denoising that are threshold value and selection of threshold function. The decomposed wavelet components are processed by setting a threshold. It is very important to select the optimum value of threshold because if the threshold is large, then useful image components might be neglected and if the threshold is small, then noise components might also be included in selected EWT components.
In this proposed method, universal threshold is applied on all EWT components using
T = σ√2*log M (5)
Where T is threshold;
σ is standard deviation; M is total number of sample
International Journal of Emerging Technology and Advanced Engineering
Website: www.ijetae.com (ISSN 2250-2459, ISO 9001:2008 Certified Journal, Volume 8, Issue 2, February 2018)
[image:4.612.85.309.137.579.2]157 Fig. 1 Flow diagram of implementation of EWT for image denoising
Different quantitative measures are calculated for this denoised image for result comparison. MSE is statistical parameter which measures the average of squares of errors, it is always non-negative and its values closer to zero is better. PSNR is the ratio of maximum possible power of signal to maximum power of corrupting noise. High PSNR represent better quality of reconstruction of image. SSIM [15] is measured to calculate the similarity between two images and the mean of all SSIM values are calculated for quality measure of denoised image that is MSSIM.
IV. EXPERIMENTAL RESULTS AND ANALYSIS
To perform these experiments, MATLAB R2011b software is used for simulation. System specifications are HP Windows-7, 64 bit operating system with Intel core i3 500 5U CPU @2.00GHz processor containing 4GB of RAM. Many tests are performed on various test images. Fig. 2 shows Lena, cameraman and pepper image of resolution 512*512 are taken as test images. Gaussian and salt & pepper noise is added using „imnoise‟ function with different noise densities.
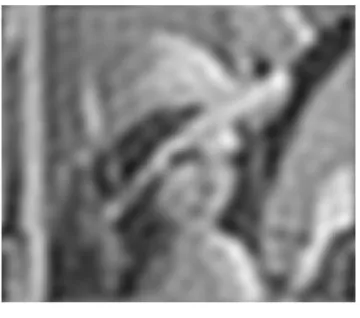
EWT is applied on these noisy images and their components are extracted. Fig. 3 shows first EWT component of noisy image and rest of the extracted components are shown in Fig. 4. The decomposed EWT components of noisy image are thresholded by universal threshold. Through these threshold values some components are selected as image components and rest are ignored as noise component. By many experiments and experience, the threshold value of first EWT component is kept as selection criteria for EWT components. In case of lena image with 0.10 noise variance, the value of first EWT component is 46.6624. Hence, the EWT component whose threshold is less than or equal to the threshold of first EWT component is selected and rest are not taken on account.
Fig. 2 (a) Lena image (b) Cameraman image (c) Pepper image (d)Gaussian noise added to Lena image (e) Gaussian noise added to Cameraman image (f) Gaussian noise added to Pepper image (g) Salt & Pepper noise added to Lena image (h) Salt & Pepper noise added to Cameraman image (i) Salt & Pepper noise added to Pepper image Test Image
Noise Addition
EWT
EWT compon
ent-1
EWT
compo
nent-2
EWT compon
ent-3
EWT compo nent-n
Threshold
EWT component Selection Criteria
Inverse EWT
[image:4.612.340.547.421.669.2]International Journal of Emerging Technology and Advanced Engineering
Website: www.ijetae.com (ISSN 2250-2459, ISO 9001:2008 Certified Journal, Volume 8, Issue 2, February 2018)
[image:5.612.79.259.134.293.2]158 Fig.3 First EWT component of noise added image
The image is reconstructed using selected components of EWT by applying inverse EWT method. Various statistical parameters are then measured for performance illustration of proposed method
.
MSE (Mean Square Error) is calculated using following equation
MSE = (6)
Where is reconstructed image component and is original image component.
PSNR (Peak Signal to Noise Ratio), is defined using
PSNR = 10log10(Max2 /MSE) (7)
Where Max is maximum possible value in an image
Fig. 4 EWT components of Lena test image
SSIM (Structural Similarity Index Measure) metric is defined as
SSIM = 2𝜇r𝜇d +c1)(2σrd+c2) (8)
(𝜇r2+𝜇d2+c1) (σr2+σd2+c2)
Where 𝜇r, 𝜇d are mean of test reference image and denoised image respectively and σr, σd are variances of test reference image and denoised image respectively. σrd is covariance of test image and denoised image. The constants C1 and C2 are given by
c1 = (0.01L)2 (9)
c2 = (0.03L)2 (10)
Where L = 255 for grayscale images
Table 1 shows result comparison of EWT denoising results with DWT results presented in [1].
Fig. 5 represents corresponding graph. Here the best results of DWT method is taken for cameraman image in state HH sub-band deletion on the basis of quantitative measures like PSNR and MSE. The EWT denoising result shows an improvement over DWT method used with different filters results.
TABLEI
COMPARISON OF RESULTS OF DWT+FILTER AND EWT WITH NOISE VARIANCE OF 10 FOR CAMERAMAN IMAGE IN STATE HH SUB-BAND
DELETION
Method MSE PSNR
Coif 81.712 29.008
Bior 75.985 29.324
Rbio 68.232 29.791
db 80.373 29.080
Sym 80.422 29.077
Haar 105.967 27.879
Dmey 104.085 27.957
[image:5.612.77.269.461.680.2] [image:5.612.331.555.465.670.2]International Journal of Emerging Technology and Advanced Engineering
Website: www.ijetae.com (ISSN 2250-2459, ISO 9001:2008 Certified Journal, Volume 8, Issue 2, February 2018)
[image:6.612.64.275.128.299.2]159 Fig. 5 Comparison graph of DWT+filter and EWT with noise
variance of 10 for cameraman image in state HH sub-band deletion TABLE II
MSE,PSNR AND MSSIM VALUES FOR DIFFERENT IMAGES DENOISED BY EWT AT DIFFERENT GAUSSIAN NOISE DENSITIES.
Test Image
Noise variance
MSE PSNR MSSIM
Lena
0.10 0.0184 65.4720 0.9982
0.20 0.0458 61.5910 0.9945
0.25 0.0651 59.9923 0.9919
Cameram an
0.10 0.0187 65.4032 0.9982
0.20 0.0492 61.2014 0.9944
0.25 0.0680 59.8083 0.9916
Pepper
0.10 0.0175 65.7116 0.9983
0.20 0.0447 61.6237 0.9946
0.25 0.0667 59.8911 0.9916
Many experiments have been performed on Lena, cameraman and pepper images with different noise variances and their results are shown on the basis of MSE, PSNR and SSIM parameters.
TABLE III
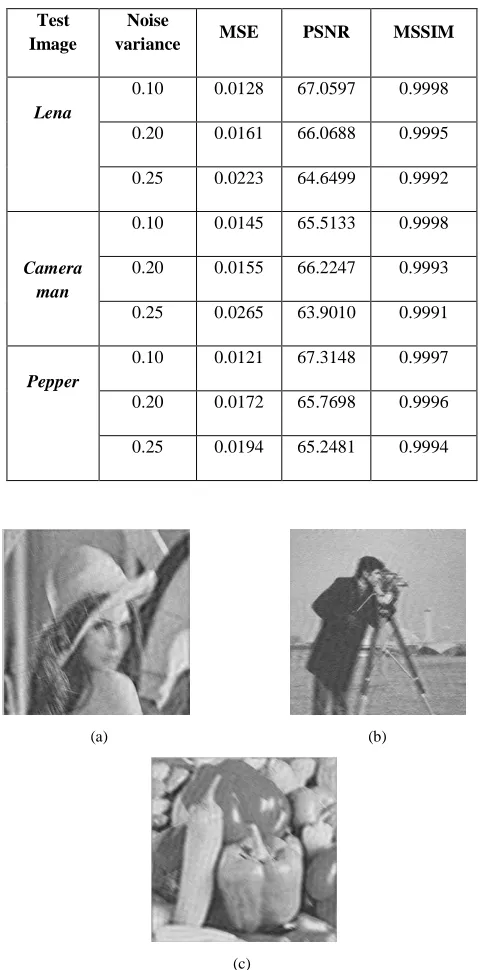
MSE,PSNR AND MSSIM VALUES FOR DIFFERENT IMAGES DENOISED BY EWT AT DIFFERENT SALT &PEPPER NOISE DENSITIES Test
Image
Noise
variance MSE PSNR MSSIM
Lena
0.10 0.0128 67.0597 0.9998
0.20 0.0161 66.0688 0.9995
0.25 0.0223 64.6499 0.9992
Camera man
0.10 0.0145 65.5133 0.9998
0.20 0.0155 66.2247 0.9993
0.25 0.0265 63.9010 0.9991
Pepper
0.10 0.0121 67.3148 0.9997
0.20 0.0172 65.7698 0.9996
0.25 0.0194 65.2481 0.9994
(a) (b)
(c)
[image:6.612.323.563.165.650.2] [image:6.612.52.286.361.601.2]International Journal of Emerging Technology and Advanced Engineering
Website: www.ijetae.com (ISSN 2250-2459, ISO 9001:2008 Certified Journal, Volume 8, Issue 2, February 2018)
[image:7.612.338.547.129.336.2]160 Table 2 presents the results for gaussian noise while the Table 3 presents the results for salt & pepper noise. Fig. 6 shows denoising results for gaussian noise of noise variance 20 for Lena, Cameraman and Pepper image respectively.
Fig. 7 PSNR values for Lena image
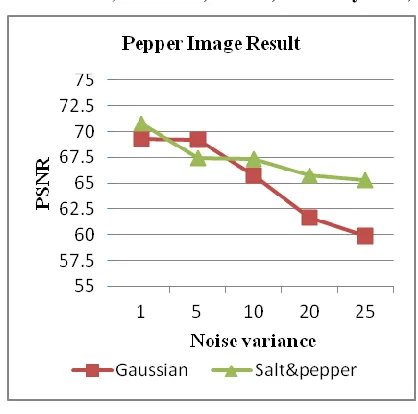
[image:7.612.63.273.200.377.2]Fig. 7, Fig. 8 and Fig. 9 shows graphical representation of PSNR values for Lena, Cameraman and Pepper image respectively plotted against different noise variances. Inferences can be made by these graphs that image denoising using EWT method produce better results for salt & pepper noise as compare to gaussian noise
.
Fig. 8 PSNR values for Cameraman image
Fig. 9 PSNR values for Pepper image
V. CONCLUSION
In this paper a new approach has been proposed for denoising an image. This paper presented the EWT method for denoising of different images. Firstly, EWT has been explained and many experiments were performed with different noise densities then the results are shown in tables.According to which, EWT gives better MSE and PSNR values and hence, MSSIM values than DWT method. For denoising application, EWT method produce better results for salt & pepper noise as compare to gaussian noise. Therefore this method is very useful for future research perspective. One can further use EWT for color image denoising in future.
Acknowledgement
The author acknowledges all the staff members of Electronics and Communication Engineering, Samrat Ashok Technological Institute for their support for fulfilling this work and their valuable comments for improving this paper.
REFERENCES
[1] Sukhjinder Kaur, Noise types and various removal techniques, International journal of advanced research in Electronics and Communication Engineering, Volume 4, Issue 2, February 2015 [2] Ms. Shweta Gupta, Ms. Meenakshi, A review and comprehensive
[image:7.612.64.271.471.646.2]International Journal of Emerging Technology and Advanced Engineering
Website: www.ijetae.com (ISSN 2250-2459, ISO 9001:2008 Certified Journal, Volume 8, Issue 2, February 2018)
161
[3] Sami Hussein Ismael, Dr. Firas Mahmood Mustafa and Dr. Ibrahim Taner, A new approach of image denoising based on discrete wavelet transform, 2016 World Symposium on Computer Applications & Research ,978-0-7695-5832-5/16 $31.00 © 2016 IEEE, DOI 10.1109/WSCAR.2016.30
[4] Jérôme Gilles, Empirical Wavelet Transform, IEEE
TRANSACTIONS ON SIGNAL PROCESSING, VOL. 61, NO. 16, AUGUST 15, 2013
[5] A.K.Jain, “Fundamentals of digital image processing”. Prentice-Hall,1989
[6] A. Buades, B. Coll and J. M. Morel, “Image Denoising Methods A New Nonlocal Principle” Society for Industrial and Applied Mathematics 2011.
[7] A. Jung, “An introduction to a new data analysis tool: Independent Component Analysis”, Proceedings of Workshop GK "Nonlinearity" -Regensburg, Oct. 2001.
[8] Florian Luisier, Thierry Blu, Brigitte Forster and Michael Unser, “Which Wavelet bases are best for Image Denoising”, SPIE Proceedings, Vol. 5915, Sept. 17,2005.
[9] David L. Donoho and Iain M. Johnstone,“Ideal spatial adaption via wavelet shrinkage”, Biometrika, vol.81, pp 425-455, September 1994.
[10] Kostadin Dabov, Alessandro Foi, Vladimir Katkovnik, and Karen Egiazarian, “Image denoising with block-matching and 3D filtering” Image Processing: Algorithms and Systems, SPIE ,Electronic Imaging,Vol.6064,2006.
[11] Jerome Gilles and Giang Tran and Stanley Osher, 2D Empirical Transforms: Wavelets, Ridgelets and Curvelets revisited, SIAM J. IMAGING SCIENCES, Vol. 7, No. 1, 157-186, 2014
[12] Anjana Francis, Muruganatham C, An adaptive denoising method using empirical wavelet transform, International journal of computer application(0975-8887), Vol. 117, No. 21, May 2015
[13] Hari Om, Mantosh Biswas, An Improved Image Denoising Method Based on Wavelet Thresholding, Journal of Signal and Information
Processing, 2012, 3, 109-116,
http://dx.doi.org/10.4236/jsip.2012.31014
[14] G.P.Nason, Choice of the threshold parameter in wavelet function estimation, Wavelets and statistics, Springer-Verlag, Vol. 103, No. 261-280,1995
[15] Zhou Wang, Member, IEEE, Alan Conrad Bovik, Fellow, IEEE, Hamid Rahim Sheikh, Student Member, IEEE, and Eero P. Simoncelli, Senior Member, IEEE, Image Quality Assessment: From Error Visibility to Structural Similarity, IEEE TRANSACTIONS ON IMAGE PROCESSING, VOL. 13, NO. 4, APRIL 2004
Author Description
Krishna Gopal Kirar received B.E. degree from Department of Electronics & Instrumentation, Samrat Ashok Technological Institute, Vidisha, India in 2003, then completed his M.Tech in Digital communication from Maulana Azad National Institute of Technology, Bhopal in 2010
He is currently working as an Assistant Professor in Department of Electronics & Instrumentation, Samrat Ashok Technological Institute, Vidisha, India since 2005. His research interests span a wide range of topics in the image processing techniques, signal processing and wireless communication.