International Journal of Emerging Technology and Advanced Engineering
Website: www.ijetae.com (ISSN 2250-2459,ISO 9001:2008 Certified Journal, Volume 4, Issue 1, January 2014)
34
A Comparative Study on Global and Local Alignment
Algorithm Methods
Abhilash C B.
1, Rohitaksha K
21,2
Assistant Professor, Department of CSE, JSSATE-Bangalore
Abstract— Pair wise sequence Alignment is one of the ways to arrange the two biological sequences to identify regions of similarity that may indicate functional, structural, and/or evolutionary relationship between the sequences (proteins or nucleic acids). In Pair wise sequence alignment we have two methods- Local Alignment (Smith-waterman algorithm) and Global Alignment (Needleman-Wunsch algorithm). In Local Alignment we treat two sequences may or may not be related and see whether a sub-string in one sequence align well with sub-string in the other, which can be applicable in searching for local similarities in large sequences. Whereas in Global Sequence Alignment we treat two Sequences as potentially equivalent, which identifies conserved regions and differences which can be applicable in comparing two genes with same functions. By using both alignment methods we are trying to find that on what conditions we can get the highest similarity between the pair of biological sequences. Smith-waterman and Needleman- Wunsch are the two algorithms used to check the percentage of similarity between the pair of biological Sequences.
Index Terms—Local Alignment, Global Alignment, Needleman-wunsch, Smiths-waterman .
I. INTRODUCTION
The recent large amount of data from genome sequences and functional genomics has given rise to new field called bioinformatics which combines elements of biology and computer science. Bioinformatics is also called by the term computational biology in which it is the science of developing computer databases and algorithms for the purpose of accelerating and enhancing biological research. The most important aspect in bioinformatics at the molecular level is sequence alignment providing an explicit mapping between two or more biological sequences such as DNA and proteins.
DNA (deoxyribonucleic acid) and protein are biological macromolecules built as long linear chains of chemical components. In the case of DNA, these component are the so-called nucleotides, of which there are four different ones, each denoted by one of the letters A, C, G, T where A stands for Adenine, G stands for Guanine, C stands for Cytosine and T for Thymine.
Proteins, however, are made up of 20 different amino acids (or residues) which are denoted by 20 different letters of the alphabet. The below table describes some of the names of the different amino acids and their single-letter code and three-letter code.
Databases of protein sequences has increased in size, it becomes more and more reliable to depend on previously classified proteins to determine the structure and function of a novel protein. The dependency of one protein sequence on another protein sequence is nothing but a sequence that evolved from any other sequence that is two organisms sharing a common ancestor which is called by the term homology, or sequences that are functionally or structurally related to another sequence.
Pair wise alignment, as the term suggests, aligns two sequences at one time whereas multiple sequence alignment method align more than two sequences at a time. Pair wise sequence alignment is a base of sequence alignment. Molecular biologists frequently compare bio sequences to determine whether any similarities can be found hoping that in what way the sequences are similar, that is whether physically or functionally related. Generally, such comparison involves aligning sections of the two sequences in a way that exposes the similarities between them. In this project we mainly focused on pair-wise sequence alignment.
International Journal of Emerging Technology and Advanced Engineering
Website: www.ijetae.com (ISSN 2250-2459,ISO 9001:2008 Certified Journal, Volume 4, Issue 1, January 2014)
35
II. RELATED WORKS
Sequence alignment is a way of arranging the sequences of DNA, RNA, or protein to identify regions of similarity that may be a consequence of functional, structural, or evolutionary relationships between the sequences. Before aligning the sequences let us study about what all the work have been done till today on sequence alignment. Here we list those literatures on sequence similarity and recentl research on efficiency of the algorithms which are proposed. In this section we are going to look at various approaches that are proposed by researchers in order to get best possible similarity.
The first DNA sequences were obtained in the early 1970s by academic researchers using laborious methods based on two-dimensional chromatography. Following the development of dye-based sequencing methods with automated analysis [15].
Genes are unique in activity. Similarity is a quantitative term that defines the degree of sequence match between two compared sequences [14]. Genes that share an arbitrary threshold level of similarity determined by alignment of matching bases are termed homologous. Homology implies that the compared sequences diverged in evolution from a common origin. Genome-wide association studies are commonly used to identify possible associations between genetic variations and diseases [1].
Global alignment technique is the one which attempts to align every residue in every sequence which is most useful when the sequence in the query set are similar and of roughly equal in size. However, for two sequences of 100 residues there are more than 10alternativealignments, such an approach would be time consuming and infeasible for longer sequences. The dynamic programming algorithm were first utilized for protein sequence comparison by Needleman and Wunsch[2], though similar methods were independently devised during the late 1960's and early 1970's for use in the fields of speech processing and computer science [3].
In early studies of protein sequences, statistical analysis of segment comparison scores was used to infer homology between sequences. Today, segment comparison methods are most commonly used in association with a dot plot or diagram[4] and can be a more effective method of finding repeated sequences than using
dynamic programming, but they have less effective in global and local alignment.
McLachlan [5] introduced two further refinements into segment comparing methods. The first was the inclusion of weights in the comparison of two segments in order to improve the definition of the ends of regions of similarity. For example, the scores obtained at each position in a 5- residue segment comparison might be multiplied by 1,2,3,2,1 respectively before being summed. The second refinement was the development of probability distributions which agreed well with experimental comparisons on random and unrelated sequences and which could be used to estimate the significance of an observed comparison.
Local alignments are more useful for dissimilar sequences that are suspected to contain regions of similarity or similar sequence resides within their large sequence. For protein sequences, the most commonly used local alignment algorithm that allows gaps is described by Smith and Waterman [6]. When insertions and deletions have occurred, the match may be disrupted for a region of the order of the length of the segment. In order to by-pass these difficulties, basic global alignment methods are modified and a new algorithms have been developed to locate common subsequence including a consideration of gaps [7][8][9].
III. PAIR WISE SEQUENCE ALIGNMENT
Very short or very similar sequences can be aligned by hand. However, most interesting problems require the alignment of lengthy, highly variable or extremely numerous sequences that cannot be aligned solely by human effort. In some cases, when one has a lot of information about the proteins, such as active site residues, secondary structure, 3D structure, mutations, etc, it may still be necessary to make a manual alignment to all the data. The available automatic methods may not be able to produce a good enough alignment in such cases. Hence this chapter discus about the algorithms that automates the sequence alignment method. This chapter also tells about how the input will be taken, how it is processed and what will be the output format of that process.
International Journal of Emerging Technology and Advanced Engineering
Website: www.ijetae.com (ISSN 2250-2459,ISO 9001:2008 Certified Journal, Volume 4, Issue 1, January 2014)
36
1. Global Alignment 2. Local Alignment
Alignments are commonly represented in both graphically and in text format. In almost all sequence alignment representation, sequence are written in rows arranged so that aligned residues appear in successive columns containing identical or similar characters are indicated with a system of conservation symbols.
Sequence alignment is an important application where dynamic programming is necessary. Sequence alignment problem consists of transforming one sequence into another sequence using edit operations that replace, insert, or remove a residue of the sequence. Each operation has an associated cost, and the goal is to edit the sequence with the lowest total cost. The partial alignments can be tabulated in a matrix, where cells of the matrix contains the optimal alignment cost of two sequences. Hence the dynamic program is suitable for pair wise alignment technique.
The procedure of the algorithms is shown as follows: 1.Initialization- creating a matrix with M + 1 columns
and N + 1 rows where M and N correspond to the size of the sequences to be aligned.
2.Matrix fill (scoring)- finds the maximum global alignment score.
3.Trace back (alignment)-The trace back step determines the actual alignment(s) that result in the maximum score.
IV. NEEDLEMAN-WUNSCH ALGORITHM DESCRIPTION
The Needleman-Wunsch Algorithm performs a global alignment on two sequences. It is commonly used in bioinformatics to align protein or nucleotide sequences. The Needleman-Wunsch algorithm is an example of dynamic programming, and it is the first application of dynamic programming to biological sequences comparison. It is sometimes referred to as Optimal matching algorithm.
The Needleman-Wunsch algorithm provides a method of finding the optimal global alignment of two sequences by maximizing the number of amino acid matches and minimizing the number of gaps necessary to align the two sequences. Because the Needleman-Wunsch algorithm finds the optimal alignment of the entire sequence of both proteins, it is a global alignment technique, and cannot be used to find local regions of high similarity. In pair wise sequence alignment algorithms, a scoring function, F, must exist such that different scores can be assigned to different alignments of two proteins relative to the number of gaps and number of matches in the alignment.
Thus, the alignment with the largest score must be the optimal alignment.
To find the alignment with the highest score, a two- dimensional array (or matrix) D is allocated. The entry in row i and column j is denoted here by F(i,j). There is one column for each character in sequence A, and one row for each character in sequence B. As the algorithm progresses, the F(i, j) will be assigned to be the optimal score for the alignment of the first i=0,….,n characters in A and the first j=0,….,m characters in B. The F(i, j) is the maximum value of D(i-1; 1)+s(i; j), D(i-1; j)+g, D(i; j-1)+g.
Needleman-WunschAlgorithm:
Input – Treat the two sequences as potentially equivalent.
Goal – Identify conserved regions and difference. Algorithm – Needleman-Wunsch Algorithm
Application – Comparing two genes with same functions
Comparing two proteins with similar functions
Initialization is the first step where the F matrix is created. Upper border position (i, 0) represents the alignment of X1….i to the empty prefix of y. That is the prefix X1……i has been matched with gaps in y. With the simple linear gap costs, the score is d * i. The trace back pointer at (i, 0) points to (i - 1, 0), and the same thing happens on the left-hand border. So the border can be initialized as follows:
Creating substitution matrix: For i=0 to length (A)
F (i, 0) = i*d For j=0 to length (B)
F (0, j) = j*d
Assigning maximum values to the matrix: For i=1 to length (A)
For j=1 to length(B) {
Diag = F(i-1,j-1) + S(Ai, Bj) Up = F(i-1, j) + d Left = F(i, j-1) + d
International Journal of Emerging Technology and Advanced Engineering
Website: www.ijetae.com (ISSN 2250-2459,ISO 9001:2008 Certified Journal, Volume 4, Issue 1, January 2014)
37
Once the F matrix is computed, the entry Fnm gives the maximum score among all possible alignments. compute an alignment that actually gives this score, you start from the bottom right cell, and compare the value with the three possible sources (Match, Insert, and Delete) to see which it came from. If Match, then Ai and Bj are aligned, if Delete, then Ai is aligned with a gap, and if Insert, then Bj is aligned with a gap.
Alignment A = Ø Alignment B = Ø
i = length (A) j = length (B) while (i > 0 and j >
0) Score = F(i, j)
Score Diag = F(i – 1, j - 1) Score Up = F(i, j - 1)
Score Left = F(i -1 , j)
If (Score == Score Diag + S(Ai, Bj)) Alignment A = Ai + Alignment A Alignment B = Bj + Alignment B
I = I - 1 J = j - 1 End if
Else if (Score == Score Left + d) Alignment A = Ai + Alignment A Alignment B = “-” + Alignment B I = i=1
End if
Otherwise (Score == Score Up + d) Alignment A = “-” + Alignment A Alignment B = Bj + Alignment B
J = j – 1 End while While (i
> 0)
Alignment A = Ai + Alignment A Alignment B = “-” + Alignment B I = i – 1
End while While (j > 0)
Alignment A = “-” + Alignment A Alignment B = Bj + Alignment B
J = j – 1 End while
Local alignments are more useful for dissimilar sequence that are suspected to contain regions of similarity or similar sequence motifs within their large sequence. A general Local Alignment technique is Smith-Waterman Algorithm which is also based on dynamic programming. 1) Smith-Waterman Algorithm Description
The Smith–Waterman algorithm is a well-known algorithm for performing local sequence alignment; that is, for determining similar regions
between two nucleotide or protein sequences. Instead of looking at the total sequence, the Smith–Waterman algorithm compares segments of all possible lengths and optimizes the similarity measure. Local sequence alignment is a method for aligning segments of two sequences with the highest density of matches.
The Smith-Waterman algorithm was published in 1981 and is very similar to the Needleman-Wunsch algorithm. Yet, the Smith-Waterman algorithm is different in that it is a local sequence alignment algorithm. Instead of aligning the entire length of two protein sequences, this algorithm finds the region of highest similarity between two proteins. This is potentially more biologically relevant due to the fact that the ends of proteins tend to be less highly conserved than the middle portions, leading to higher mutation, deletion, and insertion rates at the ends of the protein. The Smith-Waterman algorithm allows us to align proteins more accurately without having to align the ends of related protein which may be highly different.
Here in Smith-Waterman, F(i, j) is the maximum value of D(i-1; j-1)+s(i; j), D(i-1; j)+g, D(i; j-1)+g, 0.
Smith-Waterman Algorithm:
Input–The 2 sequence may or may not be related. Goal–See whether a substring in one sequence aligns well with a substring in the other.
Algorithm–Smith-Waterman algorithm Application– Searching for local similarities in large sequences.
Looking for conserved domains or motifs in two proteins.
International Journal of Emerging Technology and Advanced Engineering
Website: www.ijetae.com (ISSN 2250-2459,ISO 9001:2008 Certified Journal, Volume 4, Issue 1, January 2014)
38
Creating substitution matrix: For i=0 to length (A)
F (i, 0) = i*d For j=0 to length (B) F (0, j) = j*d
Assigning maximum values to the matrix: For i=1 to length (A)
For j=1 to length(B) {
Diag = F(i-1,j-1) + S(Ai, Bj) Up = F(i-1, j) + d
Left = F(i, j-1) + d
F(i, j) = Max(Diag, Up, Left) }
For (int i=1;i<=n;i++)
for(int j=1;j<=m;j++)
int s=score[seq1.charAt(i-1)][seq2.charAt(j-1)]; intval=max(0,F[i-1][j-1]+s,F[i-1][j]-d,F[i][j-1]-d);
F[i][j]=val; If(val=0) B[i][j]=null;
Else if(val==F[i-1][j-1]+s) B[i][j]=new Traceback2(i-1,j-1); Else if(val==F[i-1][j]-d)
S[i][j]= new Traceback2(i-1,j); Else if(val==F]i][j-1]-d) B[i][j]= new Traceback2(i,j-1); V. IMPLEMENTATION AND RESULTS
Finding Similarity
Once the alignment is done, next step is to find the number of residues that are aligned each other in a pair if sequences. The residues that are aligned are the one which are similar and other residues which are not aligned or which are aligned with the gaps are dissimilar residues. To find the similarity value here we come up with the method which gives the number of similarity in a pair of sequence, following are the steps involved in finding similarity.
1. First step is to find length of sequence1 and is assigned as M.
2. Next step is to find number of character in sequence by removing gaps assigned, and is taken as count1. 3. Same procedure is continued with sequence2 will
get N and count2 value respectively.
4. Next step is to add those two count values i’eres1= count1+count2 will give total number of characters in a sequence.
5. Then add sequence length i’eres2= M+N-2, where we decrease value by 2 because string always uses one extra memory for storing it at the end that is null pointer which shows end of string.
6. Then res= res2-res1 will gives number of mismatch in sequence
7. Finally subtract this res value by length of any one of the two sequence will gives similarity among two sequences, i’esim =(M or N) – res -1
Alignment between the protein sequences of Homo sapiens that belongs to the family DNA (cytosine-5)-methyl transfer as e, that is within the species is done first and the results are tabulated as shown below.
In all the tables BA refers to before alignment, AA- after alignment.
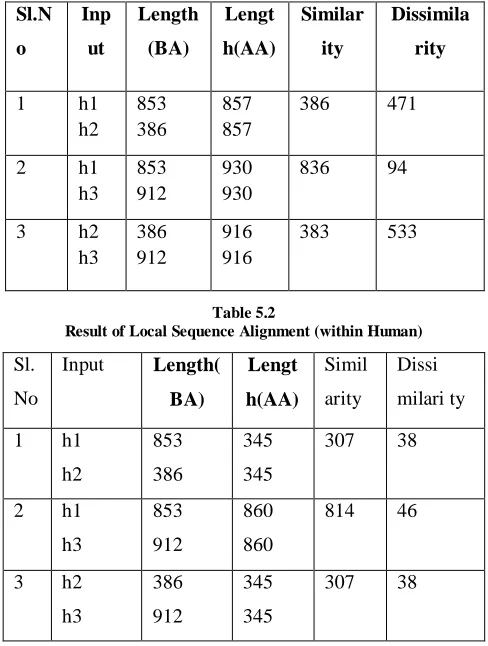
Table 5.1
[image:5.612.322.566.379.702.2]Result of Global Sequence Alignment (within Human)
Table 5.2
Result of Local Sequence Alignment (within Human)
Sl. No
Input Length( BA)
Lengt
h(AA)
Simil arity
Dissi milari ty 1 h1
h2
853 386
345 345
307 38
2 h1 h3
853 912
860 860
814 46
3 h2 h3
386 912
345 345
307 38
Sl.N
o
Inp
ut
Length
(BA)
Lengt
h(AA)
Similar
ity
Dissimila
rity
1 h1
h2
853 386
857 857
386 471
2 h1
h3
853 912
930 930
836 94
3 h2
h3
386 912
916 916
International Journal of Emerging Technology and Advanced Engineering
Website: www.ijetae.com (ISSN 2250-2459,ISO 9001:2008 Certified Journal, Volume 4, Issue 1, January 2014)
39
Sl.No
Input Length (BA)
Lengt
h(AA) Simil
arity Dissi
milar
ity
1 m1
m2
908 421
911 911
419 492
2 m1
m2
908 859
925 925
843 82
3 m2
m3
421 859
860 860
421 439
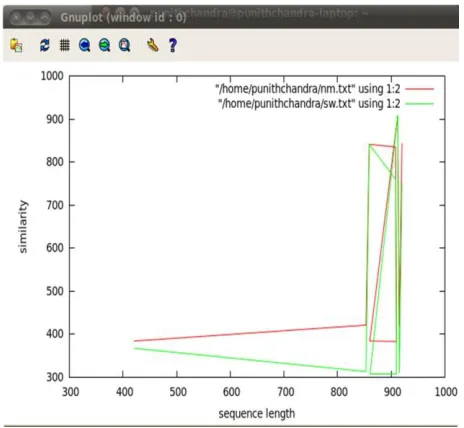
Figure 5.1 Similarity Graph for DNA (cytosine-5)- methyltransferase family of Human
In the graph red line indicates the similarity calculated between a pair of sequence using Needleman- Wunsch algorithm, green line indicate similarity calculated between a pair of sequence using Smith-Waterman algorithm. Here in the graph we can see that both Needleman-Wunsch and Smith-Waterman algorithm gives roughly equal similarity between a pair of sequences that belongs to the family DNA (cytosine-5)-methyltransferase of Homo sapiens.
[image:6.612.64.275.134.332.2] [image:6.612.324.574.158.544.2]Alignment between the protein sequences of Musmusculus (Mouse) that belongs to the family DNA (cytosine-5)-methyltransferase, that is within the species is done first and the results are tabulates as shown below.
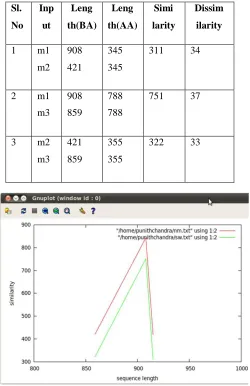
Table 5.3
Result of Global Sequence Alignment (within Mouse)
Table 5.4
Result of Local Sequence Alignment (within Mouse)
Sl.
No Inp
ut
Leng
th(BA) Leng
th(AA) Simi
larity
Dissim
ilarity
1 m1
m2
908 421
345 345
311 34
2 m1
m3
908 859
788 788
751 37
3 m2
m3
421 859
355 355
322 33
Figure 5.2 Similarity Graph for DNA (cytosine-5)- methyltransferase family of Mouse
[image:6.612.53.275.527.715.2]International Journal of Emerging Technology and Advanced Engineering
Website: www.ijetae.com (ISSN 2250-2459,ISO 9001:2008 Certified Journal, Volume 4, Issue 1, January 2014)
40
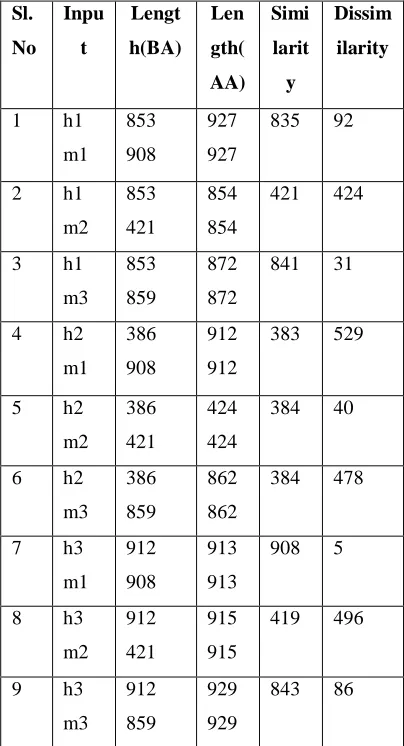
Sl. No Inpu t Lengt h(BA) Len gth( AA) Simi larit y Dissim ilarity 1 h1 m1 853 908 927 927 835 92 2 h1 m2 853 421 854 854 421 424 3 h1 m3 853 859 872 872 841 31 4 h2 m1 386 908 912 912 383 529 5 h2 m2 386 421 424 424 384 40 6 h2 m3 386 859 862 862 384 478 7 h3 m1 912 908 913 913 908 5 8 h3 m2 912 421 915 915 419 496 9 h3 m3 912 859 929 929 843 86 [image:7.612.344.544.162.553.2]Alignment between the protein sequences of Homo sapiens and the protein sequence of Musmusculus (Mouse) that belongs to the family DNA (cytosine-5)- methyltransferase, that is across the species is done first and the results are tabulates as shown below.
Table 5.5
[image:7.612.63.265.221.594.2]Result of Global Sequence Alignment (Human- Mouse)
Table 5.6
Result of Local Sequence Alignment (Human- Mouse)
International Journal of Emerging Technology and Advanced Engineering
Website: www.ijetae.com (ISSN 2250-2459,ISO 9001:2008 Certified Journal, Volume 4, Issue 1, January 2014)
41
Sl.
No Inp
Ut
Lengt
h(BA) Lengt
h(AA) Simil
arity
Dissimil
arity
1 h1
h11
853 267
854 854
267 587
2 h2
h11
386 267
387 387
267 120
3 h3
h11
912 267
913 913
267 646
4 h1
m11
853 259
854 854
259 589
5 h2
m11
386 259
387 387
259 128
6 h3
m11
912 259
913 913
259 654
7 h11 m11
267 259
278 278
[image:8.612.53.285.133.347.2]249 29
Figure 5.3 Similarity Graph for DNA (cytosine-5)- methyltransferase family across Species
In the graph red line indicates the similarity calculated between a pair of sequence using Needleman- Wunsch algorithm, green line indicate similarity calculated between a pair of sequence using Smith-Waterman algorithm.As we start to align a pair of sequence across the species that is between Human and Mouse that belongs to the same family, the similarity value calculated usind Needleman-Wunsch and Smilth-Waterman algorithms varies.
Alignment between the protein sequences of Homo sapiens (Mouse) that belongs to the family peptidase S1 family. Elastase subfamilyand the protein sequence of Musmusculus that belongs toIRAK1BP1 family, that is across the species of different family is done first and the results are tabulates as shown below.
Table 5.7
Result of Global Sequence Alignment (across family Human-Mouse)
Table 5.8
Result of Local Sequence Alignment (across family Human-Mouse)
Sl.
No Inp
Ut
Lengt
h(BA) Lengt
h(AA) Simil
arity
Dissimil
arity
1 h1
h11
853 267
107 107
95 12
2 h2
h11
386 267
22 22
18 4
3 h3
h11
912 267
23 23
19 4
4 h1
m11
853 259
74 74
65 9
5 h2
m11
386 259
67 67
62 5
6 h3
m11
912 259
913 913
259 654 7 h11
m11
267 259
49 49
[image:8.612.336.563.160.434.2] [image:8.612.341.565.451.667.2]International Journal of Emerging Technology and Advanced Engineering
Website: www.ijetae.com (ISSN 2250-2459,ISO 9001:2008 Certified Journal, Volume 4, Issue 1, January 2014)
[image:9.612.51.288.133.322.2]42
Figure 5.4 Similarity Graph Across Species of Different FamilyIn the graph red line indicates the similarity calculated between a pair of sequence using Needleman- Wunsch algorithm, green line indicate similarity calculated between a pair of sequence using Smith-Waterman algorithm. Here we can clearly see that the global alignment method (Needleman-Wunsch algorithm) gives more similarity compared to the local alignment method (Smith- Waterman algorithm) when a pair of sequence which belongs to different family of different species are aligned.
Alignment between two protein sequences is done within the species and within the family, across the species and within the family, within the species and across the family; of Homo sapiens and Musmusculus (Mouse) is done and the results are tabulated above with the similarity and dissimilarity values that are calculated using the above described method.
The similarity and dissimilarity value gives the percentage of relationship between the pair of sequences. The similarity and dissimilarity value varies across each and every pair of sequences. When the alignment is done within the species and family, we will get more similarity between the sequences. And same thing works even when the alignment is done within the family and across the species. But when the alignment is done across the species and family the similarity value decreases and dissimilarity value increases. Hence the homology between a pair of sequences taken from different species and different family is less than the homology between a pair of sequences taken from different family of same species and same family of same species.
And also the local similarity between the pair of sequences taken from different species and different family is less than the local similarity between a pair of sequences taken from different family of same species and same family of same species.
VI. CONCLUSION
This paper implements two dynamic programming algorithms and their application in biological sequence alignment. Sequence alignment is a very important tool in analysis of the structures and functions of DNA and protein molecules, so the selection of better algorithms for aligning those sequences is very critical to get an optimal result.
Despite the many applications, automatic pair wise alignment is a difficult task. To align two sequences, the Needleman-Wunsch algorithm produces optimal global alignment with gaps and the Smith-Waterman algorithm will locally align sub sequences. Both of these algorithm use dynamic programming to optimize the scores based on substitution matrices.
This study focuses on dynamic programming algorithms because dynamic programming algorithms are guaranteed to find the optimal scoring alignment or set of alignments. In this project, global alignment algorithm and local alignment algorithm, are discussed and analysed extensively.
Alignment of a sequence or comparison of a sequence, particularly when combined with the systematic collection of data and search of database containing bimolecular sequences, has become essential in modem molecular biology. Biological sequence alignment makes use of the fact that high sequence similarity usually implies significant structural or functional similarity. When we find two or more sequences can be related by aligning them; that is, many characters in one sequence are in the same order as they are in the other sequence, then we say that the two sequences are similar.
International Journal of Emerging Technology and Advanced Engineering
Website: www.ijetae.com (ISSN 2250-2459,ISO 9001:2008 Certified Journal, Volume 4, Issue 1, January 2014)
43
REFERENCES
[1] Marc A. Schaib, Irene M.Kaplow, Marina Sirata and SerafimBatzaglau (2009). A Classifier Based approach to identify genetic similarity between diseases.
[2] Needleman S.B. and Wunsch C.D. (1970) A general method application to the search for similarities in the amino acid sequence of two proteins. Journal of Molecular BioLogy 48:443-453. [3] KruskaJ J.B. (1983) An overview of sequence comparison, In
Sankoff D. and Kruskal J.B., (ed.) Time warps, string edits and macromolecules: The theory and practice ofsequence comparison, ppl-44, Addison Wesley.
[4] Gibbs AJ. and McIntyre G.A. (1970) The diagram, a method for comparing sequences. Its use with amino acid and nucleotide sequences. European Journal of Biochemistry 16:1-11.
[5] McLachlan A.D. (1972) Repeating sequences and gene duplication in proteins. Journal Molecular Biology 64:417-437.
[6] Smith T.F. and Waterman M.S. (19g I ) Comparison of bio-sequence. Advances in Applied Mathematics 2:482-489.
[7] Boswell D.R. and Mclachlan A.D. (1984) Sequence comparison by exponentially damped alignment. Nucleic Acid Research 12:457-464.
[8] Smith T.F. and Waterman M.S. (1981) Identification of common molecular subsequences. Journal ofMolecular Biology 147: 195-197.
[9] Sellers P.H. (1984) Pattern recognition in genetic sequences by mismatch density. Bulletin in Mathematical Biology 46:705-708 [10] Waterman M.S. and Jones R. (1990) Consensus methods for
DNA and protein sequences alignment, in Molecular Evolution: Computer Analysis ofProtein and Nucleic Acid Sequences, (eds. Doolittle R.E) 183:221-237, Academic Press, Inc., San Diego.
[11] Barton G.J. (1993).An efficient algorithm to locate all locally optimal alignments between two sequences allowing forgaps. Computer Applications in the Biosciences 9:729-734
[12] String Alignment using Dynamic Programming by Gina M. Cannarozzi
[13] HekkiHyyro, Ayumi Shinohara, A new bit- parallel-distance algorithmNikoltseas. LNCS 3772,2005
[14] An Information-Theoretic Definition of Similarity, DekangL in, Department of Computer Science University of Manitoba, Winnipeg, Manitoba, Canada R3T 2N2
[15] Olsvik O, Wahlberg J, Petterson B et al. (January 1993). “Use of automated sequenceing of polymerase chain reaction-generated amplicons to identify three types of cholera toxin subunit B in vibrio cholera O1 strains” J. Clin.Microbiol.31(1):22-5.