Elicitation of expert knowledge to inform
objectbased audio rendering to different
systems
Woodcock, JS, Davies, WJ, Melchior, F and Cox, TJ
10.17743/jaes.2018.0001
Title
Elicitation of expert knowledge to inform objectbased audio rendering to
different systems
Authors
Woodcock, JS, Davies, WJ, Melchior, F and Cox, TJ
Type
Article
URL
This version is available at: http://usir.salford.ac.uk/id/eprint/44895/
Published Date
2018
USIR is a digital collection of the research output of the University of Salford. Where copyright
permits, full text material held in the repository is made freely available online and can be read,
downloaded and copied for noncommercial private study or research purposes. Please check the
manuscript for any further copyright restrictions.
J. Woodcock, W. J. Davies, F. Melchior, and T. J. Cox, “Elicitation of Expert Knowledge to Inform Object-Based Audio Rendering to Different Systems,” J. Audio Eng. Soc., vol. 66, no. 1/2, pp. 44–59, (2018 January/February.). DOI: https://doi.org/10.17743/jaes.2018.0001
Elicitation of Expert Knowledge to Inform
Object-Based Audio Rendering to Different
Systems
JAMES WOODCOCK1, WILLIAM J. DAVIES1, FRANK MELCHIOR2, AND TREVOR J. COX,1 AES Member
1Acoustics Research Centre, University of Salford, Salford, M5 4WT, United Kingdom 2BBC R&D, Dock House, MediaCityUK, Salford, M50 2LH, United Kingdom
Object-based audio presents the opportunity to optimize audio reproduction for different listening scenarios. Vector base amplitude panning (VBAP) is typically used to render object-based scenes. Optimizing this process object-based on knowledge of the perception and practices of experts could result in significant improvements to the end user’s listening experience. An experiment was conducted to investigate how content creators perceive changes in the perceptual attributes of the same content rendered to systems with different numbers of chan-nels, and to determine what they would do differently to standard VBAP and matrix based downmixes to minimize these changes. Text mining and clustering of the content creators’ responses revealed six general mix processes: the spatial spread of individual objects, EQ and processing, reverberation, position, bass, and level. Logistic regression models show the relationships between the mix processes, perceived changes in perceptual attributes, and the rendering method/speaker layout. The relative frequency of use for the different mix processes was found to differ between categories of audio objects suggesting that any downmix rules should be object category specific. These results give insight into how object-based audio can be used to improve listener experience and provide the first template for doing this across different reproduction systems.
1 INTRODUCTION
Object-based broadcast has been described as the “logi-cal next step” in broadcast technology [1]; this is reflected in current large scale research projects [2–4], standardiza-tion activities [5, 6], interest from broadcasters [1], and commercialization [7, 8]. Object-based audio (OBA) is an approach to sound storage, transmission, and reproduction whereby individual audio objects with associated metadata are transmitted and rendered at the client side of the broad-cast chain. An object will typically consist of an audio sig-nal and metadata indicating the object’s position and level; objects may also contain semantic metadata indicating, for example, the language of a dialogue track or whether the object is positioned on or off screen. This is in contrast to traditional channel based audio, where pre-rendered con-tent for a fixed reproduction system is broadcast. One of the main benefits of OBA is that the content can be rendered optimally for the given reproduction setup, environment, or listening context. For example, the same audio content could be rendered over loudspeakers, mobile devices, or binaurally over headphones for a VR. However, there are
many open questions regarding how to render OBA content optimally for different reproduction systems.
knowledge into object-based rendering. The presented re-sults provide the first evidence of what expert mixers would do when mixing object-based audio for different systems and improves confidence that OBA can deliver on promises of format agnosticism and improved listener experience.
1.1 Intelligent Systems in Audio Production There have been a number of investigations into intelli-gent systems for audio production. These systems include automatic microphone mixing [10, 11], automatic panning algorithms [12], gain normalization algorithms for feed-back prevention [13], algorithms designed to reduce mask-ing [14], automatic equalization [15], and automatic music mixing [16, 17]. Generally, these systems operate on low level signal and psychoacoustic features.
Ren et al. [18] proposed an automatic music production system based on embedded expert knowledge. The system extracts a feature set based on the musical score such as pitch and marks of expression, musical features such as loudness and pitch deviation, and technical audio features such as signal to noise ratio. These features are then used to model the probability of different processes being applied to the production. Pestana and Reiss [19] used a grounded theory approach to investigate current practices in mix en-gineering to inform intelligent production strategies. This study included an extensive literature search, along with interviews with a large panel of successful mix engineers. The main outcome of this work was a set of rules related to mixing best practices.
The systems described in this section have generally been designed for music applications and operate within a channel-based framework. To date there has been no in-vestigation into how professionals mix non-musical object-based content for 3D audio systems. The results presented in this paper, therefore, provide data that will be useful in bringing together object-based audio and intelligent sys-tems in audio production.
1.2 Perception of Spatial Audio
There have been numerous studies that have aimed to elicit perceptual attributes for reproduced sound [20–29]. Generally, the outcome of these studies is a non-orthogonal set of attributes that can be used to rate perceptual dif-ferences between different reproduction conditions (loud-speaker layouts, rendering methods, etc.). Generally, these attribute sets describe various timbral (such as clarity and coloration) and spatial (such as envelopment and horizontal width) perceptual attributes. An overview of these studies is given by Francombe et al. [30].
Recently, Francombe et al. [31, 32] conducted a study to determine which perceptual attributes contribute to the lis-tener preference of reproduced audio. Their study included state of the art reproduction methods including systems with height such as 4+5+0 and 9+10+3 speaker layouts1.
An elicitation experiment was conducted with a group of
1The convention for describing loudspeaker layouts from [33]
is used in this paper.NU +NM +NB describes the number of
expert and non-expert listeners that resulted in two sets of attributes (one for each of the listener groups) covering a range of timbral and spatial attributes. This attribute set is utilized in the present study (see Sec. 2.3).
The studies described in this section provide useful tools to assess the perception of reproduced sound. However, little is known about how perceptual attributes are degraded when the same object-based content is rendered to systems with different numbers of channels and how professional mix engineers would alter the downmix to compensate for these changes.
1.3 Conceptual Model
Conceptually, the work presented in this paper assumes the following model of perception. It is assumed that when object-based audio is rendered to different loudspeaker lay-outs, changes in the physical sound field will cause a change in the auditory scene perceived by the listener. According to Coombs [34], differences between pairs of stimuli represent a distance in a latent high dimensional psychological space, which can be described by a finite number of perceptual di-mensions. In the perception of complex sound stimuli, these dimensions are assumed to relate to some combination of perceptual attributes [35]. Therefore, if a sound designer is tasked to remix content to a different loudspeaker lay-out with the aim of preserving the production intent of the original content, their judgments of similarity between the original and the re-rendered content will be based on differ-ences in the positions of the stimuli in this perceptual space. When a change in these perceptual attributes is detected by the sound designer, they will make changes to the mix of the re-rendered content to attempt to compensate for the change in the perceptual attribute. It is this relationship be-tween perceptual attributes and general mix processes that is of interest in this paper.
1.4 Aims and Objectives
At present, there has been no systematic investigation of how professionals mix object-based content for different reproduction systems or how perceptual attributes change when object-based content is rendered to different loud-speaker systems. This paper reports on an experiment that was conducted to investigate:
1. Which perceptual attributes change when the same object-based content is rendered to systems with dif-ferent numbers of channels, and;
2. What professional content creators would do differ-ently to a standard VBAP renderer when content is rendered to systems with different numbers of chan-nels.
The first objective of this exploratory study is to iden-tify a small number of the most common mix processes used by professionals when remixing object-based content
loudspeakers in the upper layer (NU), middle layer (NM), and
for systems with different numbers of channels. A second objective is to explore how the perceptual attributes of the rendered soundfield change between VBAP renderings of the same content to different speaker layouts. The identified mix processes can be used by designers of OBA systems and by researchers in OBA, intelligent audio systems, and spa-tial audio generally. The processes will also inform future research, the aim of which will be to determine quantitative rules that can be used when rendering OBA for different loudspeaker layouts.
1.5 Structure of Study
The work presented in this paper consists of three main phases. First, experiments were conducted with profes-sional audio content producers in which they were asked to compare a 9+10+5 channel rendering of an object-based audio drama scene to a rendering of the same content to a system with fewer channels. The content producers were asked what they would do differently if they had control over mix for the system with fewer channels and indicate what perceptual attributes changed between the reference and the lower channel version. As this is an exploratory study, aiming to elicit the common mix processes a con-tent producer might employ when remixing object-based content for loudspeaker systems with different numbers of channels, the test participants were asked openly about their intentions rather than asking them to directly operate on the mix. A follow-up experiment will give the content producers direct control over a small number of the most commonly suggested processes to determine quantitative downmix rules for those processes.
The open text data collected in the first phase were an-alyzed using text mining techniques and follow-up inter-views with the test participants to identify a small number of common changes suggested by the sound designers. Fi-nally, the relationships between the data relating to changes in perceptual attributes, the identified mix processes, and the rendering method/speaker layout were explored using logistic regression models.
2 MATERIALS AND METHODS
2.1 Ethics
The experiment described in this paper was approved by the University of Salford ethics committee. Participants took part in the experiment voluntarily, and written consent was taken prior to the test session. Participants were free to withdraw from the experiment at any time without needing to give a reason to the researcher.
2.2 Stimuli
[image:4.585.298.531.72.253.2]Stimuli for the experiment were generated using pro-fessionally produced object-based audio drama content, produced as part of the S3A project [36]. The clips were originally mixed for a 9+10+5 channel setup (9+10+3 as specified in Recommendation ITU-R BS.2051 [33] with 2 additional speakers in the lower layer at±135o); subwoofer signals in the listening room during the mix were generated
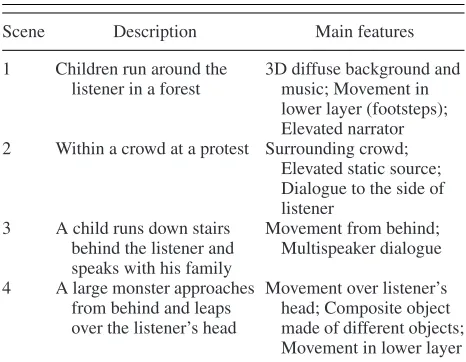
Table 1. Description of stimuli used in the listening experiment. The scenes are available from
https://doi.org/10.17866/rd.salford.3120112.
Scene Description Main features
1 Children run around the listener in a forest
3D diffuse background and music; Movement in lower layer (footsteps); Elevated narrator 2 Within a crowd at a protest Surrounding crowd;
Elevated static source; Dialogue to the side of listener
3 A child runs down stairs behind the listener and speaks with his family
Movement from behind; Multispeaker dialogue
4 A large monster approaches from behind and leaps over the listener’s head
Movement over listener’s head; Composite object made of different objects; Movement in lower layer
by an IOSONO Core bass management system. Four clips, each with a duration of around 20 seconds, were selected from this material to be used in the test. The clips were se-lected to demonstrate a wide range of features of advanced 3D audio systems and to include a range of different object types [37, 38]. Descriptions of the four clips are provided in Table 1.
Object-based renderings of the clips were generated for 4+9+0, 0+5+0, and 0+2+0 speaker layouts (as specified in Recommendation ITU-R BS.2051 [33]) using VBAP. These systems were selected to include a 3D surround lay-out, a 2D surround laylay-out, and a standard stereo layout. The renderings were generated from the original object-based scenes, using the original metadata to define the position of sources. In the case of the 2D systems, the height in-formation was disregarded in the rendering. As VBAP is not able to render sources outside of the active arc of the speaker layout, a virtual speaker was positioned at 180◦ in the 0+2+0 layout. As with the original mix, subwoofer signals for the 4+9+0 and 0+5+0 systems were generated using the IOSONO Core bass management system in the listening room.
The VBAP renderings were generated using the algo-rithms described by Pulkki [9] implemented in a realtime C++ software rendering framework developed in the S3A project. The software takes as an input a loudspeaker config-uration, the audio signals for each object, and the metadata for each object via a UDP JSON stream and outputs signals for the given loudspeaker configuration. The loudspeaker configuration is meshed into a set of triplets and a gain ma-trix for each triplet is inverted and multiplied by the object positions described in the metadata to calculate panning gains for each object in the scene. The calculated gains are applied to each object’s audio signal to generate the output loudspeaker signals. The metadata model and the software rendering framework are described in more detail in [39].
perform compared to standardized matrix downmix meth-ods. The coefficients for the matrix downmixes were taken from [40]. All of the clips used in the experiment were loud-ness normalized using a multichannel extension to ITU-R 1770-2 [41].
2.3 Listening Experiment
Eight professional content producers took part in the listening experiment. Each of the participants identified that audio production was their full time profession. The participants’ professional experience ranged from theater sound designer, studio manager, sound supervisor, sound editor, sound designer, sound mixer, composer, and sonic artist. The participants had experience mixing for surround systems ranging from 5.1 mixes for sport, entertainment, and theatricals to multichannel museum installations. The average age of participants was 43.5 (SD=9.1) and they were paid an honorarium for their time.
The experiment was conducted in the listening room at BBC R&D. This listening room complies with ITU BS.1116 [42] and is equipped with 32 Genelec 8030B loud-speakers and 2 Genelec 7040 subwoofers. Further details of this listening room are given in [43].
Participants were presented with the stimuli described in Sec. 2.2 in pairs, the reference stimulus, and a version of the same content rendered for a speaker system with a lower number of channels.
For each comparison the participant was asked:
1. What they would have done differently if they had control of the version with the lower number of loud-speakers if they were mixing the clip with the aim of preserving the intent of the reference clip, and; 2. To indicate, using a list of perceptual attributes, what
had changed between the reference and the down-mix.
The order of the stimuli and attribute list was random-ized for each participant and participants were not informed about the layout of the target reproduction systems. Partic-ipants were able to switch freely between the reference stimulus and the downmix stimulus.
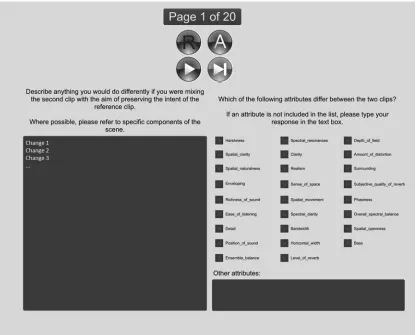
The interface for the test is shown in Fig. 1. Responses to 1. were collected using open text data; the participants were asked to type each change they would make on a new line of the text box. Responses to 2. were collected using check boxes; the attributes on the right hand side of the figure areharshness, spatial clarity, spatial naturalness, envelop-ing, richness of sound, ease of listenenvelop-ing, detail, position of sound, ensemble balance, spectral resonances, clarity, realism, sense of space, spatial movement, spectral clarity, bandwidth, horizontal width, level of reverb, depth of field, amount of distortion, surrounding, subjective quality of re-verb, phasiness, overall spectral balance, spatial openness, andbass. The list of attributes was taken from the findings of an elicitation experiment by Francombe et al. [31, 32]. The definitions of the attributes given in [31] were pro-vided to the participants. Participants were also allowed to
add any other attributes they perceived as having changed in an open textbox; however, none of the participants used this option suggesting that the attributes in [31] covered all of the perceptual differences in the test stimuli.
2.4 Statistical Methods 2.4.1 Cluster Analysis
Two methods of cluster analysis are used in this study— k-means and hierarchical agglomerative clustering. The aim of both of these methods is to divide a set of data into interpretable groups.
K-means clustering is a flat clustering algorithm that aims to minimize the average squared Euclidean distance of objects from the centroid of the object’s cluster [44]. In k-means clustering, the number of clusters kreturned by the algorithm is specified in advance.
Hierarchical agglomerative clustering is a method of clustering whereby all of the objects begin as individual clusters. In an iterative process, the two closest clusters are merged. The final top level of the hierarchy consists of a single cluster containing all objects. Using this method, the number of clusters does not need to be specified in advance; different numbers of clusters can be obtained by slicing the hierarchical solution at different levels [45].
2.4.2 Regression Modeling
Categorical response variables with more than two cat-egories can be modeled using multinomial logistic regres-sion [46]. In the present study, the changes suggested by the sound designers for each reproduction system (see Sec. 3.1.1) can be represented in this way. Consider a multino-mial categorical response variableYithat can take one ofJ values. The probabilityπi,jthat thei-th response falls into thej-th category can be denoted as such:
πi,j =P(Yi = j) (1)
In the multinomial logistic model, one of the categories of Yiis used as a baseline category, and the log-odds for all the other categories relative to this baseline are modeled. The odds that thei-th response falls into categoryjas opposed to the baseline isπi,j/πi,Baseline.
The multinomial logistic model assumes that the log-odds of each response category over the baseline follows a linear model:
ln(πi,j/πi,Baseli ne)=αj+xTiβj (2)
whereαjis the model intercept for thej-th category,βjis a
vector of regression coefficients,xiis a vector of
observa-tions, andTindicates a matrix transpose.αjandβjcan be
estimated via maximum likelihood.
Considering Eq. (2), as the the log-odds are being mod-eled, taking the exponential of theβjregression coefficients
Fig. 1. Test interface used in the listening tests.
when the predictor variable takes on a value of 1 (ase0.70
≈2).
Binary logistic regression, which is used in Sec. 3.4.2, can be considered as a special case of multinomial logistic regression when the number of response categoriesJ=2.
3 ANALYSIS AND RESULTS
3.1 Open Text Data 3.1.1 Text Mining
The open text data collected using the methods described in Sec. 2.3 were initially analyzed using unsupervised text mining techniques. The aim of this exercise was to begin to look for general categories of changes that the sound designers indicated they would make to the content ren-dered to systems with a lower number of loudspeakers than the reference system. Text mining allows the investigation of latent structures in a collection of documents (in this case a document refers to a single phrase2 elicited in the experiment) [47]. Text mining has an advantage over sim-ply examining word frequencies, as it can reveal clusters of phrases that relate to similar concepts; for example, in the present study the word “position” is used frequently
2 In the remainder of this paper a phrase refers to a single
sentence provided by the participant.
in phrases relating to both static and dynamic positions of objects.
The text data were cleaned by converting every letter to lower case and by removing numerical and punctua-tion characters. Following this, a list of stopwords was constructed. Stopwords are words that are disregarded in the text mining process because they offer little predictive power; this may be because they are common words within the language (e.g.,a, the, and) or because they are com-mon within the domain that is being investigated (in the present study, this included words such asspeaker, stereo, downmix).
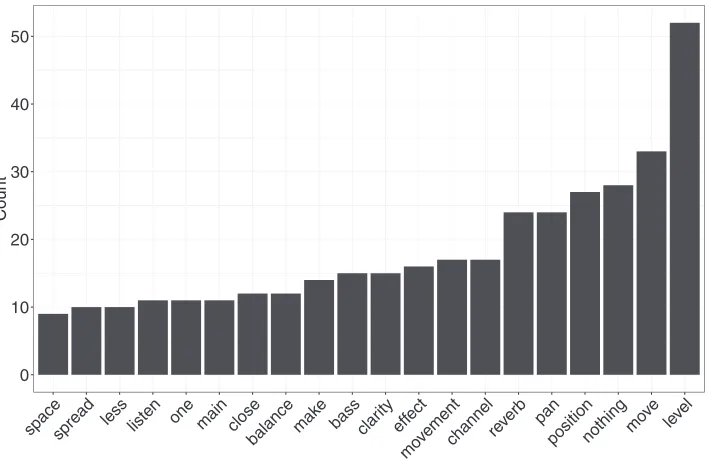
[image:6.585.84.501.41.376.2]0 10 20 30 40 50
spacespread less listen one main closebalance mak e
bassclarityeffect
mov
ementchannelrever b
pan
positionnothingmo ve
level
Co
u
nt
Fig. 2. Frequency of use of words within the corpus after stemming and removal of stopwords.
The text data were quantitatively represented by gener-ating a phrase-term matrix, whereby each phrase is repre-sented as a feature vector representing which terms in the dictionary exist in that phrase (in this context, a dictionary is a list of all words that appear in the corpus). K-means clustering (see Sec. 2.4.1) was used to analyze the phrase-term matrix. As the number of clusterskis a variable that needs to be determined, a scree plot was generated to exam-ine the within cluster sum of squares as a function ofk. The scree plot showed no obvious elbow, but a shallowing of the gradient of the curve suggested a 20 cluster solution was an appropriate staring point. Examination of the 20 cluster solution revealed that the largest returned cluster contained a number of clear sub-clusters. Therefore, the k-means al-gorithm was run a second time on this top level cluster to obtain an additional 10 cluster solution making the total number of clusters 29.
Each of the clusters returned by the algorithm was auto-matically labelled by calculating a metric comparing mean word use for the phrases within a cluster (win) to the mean word use for the phrases not in that cluster (wout). The metric was calculated as follows:
wi n= Nw Nc
forw∈c (3)
wout = Nw N−Nc
forw /∈c (4)
wdi f f =wout−wi n (5)
whereNwis the number of occurrences of wordw,Ncis the number of words in clusterc, andNis the number of words in the corpus. The cluster was then automatically labelled by rank orderingwdiff and taking the top term.
[image:7.585.121.476.43.274.2]Table 2 shows the automatic labels for the first 10 phrase clusters revealed in the text mining analysis. This table also shows the number of phrases in each cluster. It can be seen
Table 2. Automatic labels for the first 10 clusters revealed in the text mining analysis.
Cluster Automatic labels N phrases
1 Envelope 81
2 Level 41
3 Nothing 27
4 Move 26
5 Position 24
6 Reverb 15
7 Clarity 14
8 Movement 9
9 Effects 9
10 Bass 9
that generally the automatic label describes a mix process or perceptual attribute, except the cluster labelledNothingthat consists of the responses where the participants indicated they would make no changes. From Table 2 it is apparent that a number of the clusters could be describing the same concept (for example, the clusters labelledmoveand posi-tion). To explore this, one-to-one follow up interviews were conducted with the test participants.
3.1.2 Follow-Up Interviews
The automatic labels for the clusters revealed in the text mining analysis were used in follow-up interviews with the listening test participants. In these discussions the par-ticipants were presented with the phrases in each cluster describing the suggested changes, along with the automatic key words shown in Table 2. For each cluster, they were asked to consider the following:
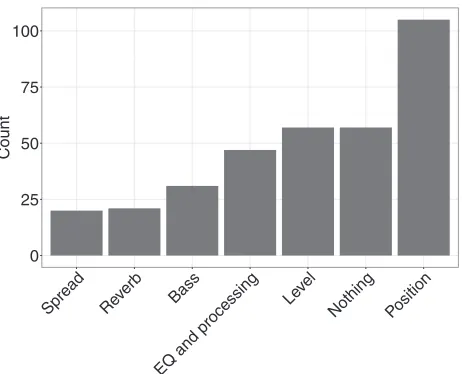
[image:7.585.304.538.341.474.2]0 25 50 75 100
Spread Rev erb
Bass
EQ and processing Lev
el
Nothing Position
Co
u
nt
Fig. 3. Frequency of process use across all systems and program items (out of a total of 338 phrases).
2. If not, can the cluster be merged with another of the clusters?
3. Do all of the phrases belong in that cluster, or do they need to be reallocated to a different cluster?
This process was conducted iteratively, until all of the phrases in the corpus were allocated to a category.
Based on the categorizations developed by each of the participants, aphrase x categorymatrix was built such that the matrix contained a 1 if the participant had allocated a phrase to a certain category and a 0 otherwise. Hierar-chical agglomerative clustering (Ward method [49]) was conducted on these data revealing 7 clear categories:
1. Spread: A change in the spread or width of individual objects.
2. EQ and processing: Changes to frequency content and effects such as distortion.
3. Reverb: Changes to the level or time of reverb ap-plied to individual objects.
4. Position: A change in the position or movement of individual objects.
5. Bass: A change to the level of the LFE channel. 6. Level: Changes to the level of individual objects. 7. No change: No suggested change.
The full clustering solution can be found at https://doi.org/10.17866/rd.salford.3120112.
3.2 General Mix Processes
[image:8.585.50.281.39.226.2]Based on the clustering solution, each of the phrases in the corpus was coded according to one of the seven cate-gories identified in Sec. 3.1.2. Fig. 3 shows the frequency of the general mix processes across all systems and pro-gram items. It can be seen from this figure that the most frequently suggested mix process was a change in position followed by no change, level, EQ and processing, bass, reverb, and spread.
Table 3. Total number of suggested changes over all participants and program items, broken down by system.
System Total suggested changes
VBAP 4+5+0 38
VBAP 0+5+0 36
Matrix 0+5+0 45
VBAP 0+2+0 91
[image:8.585.298.532.66.145.2]Matrix 0+2+0 70
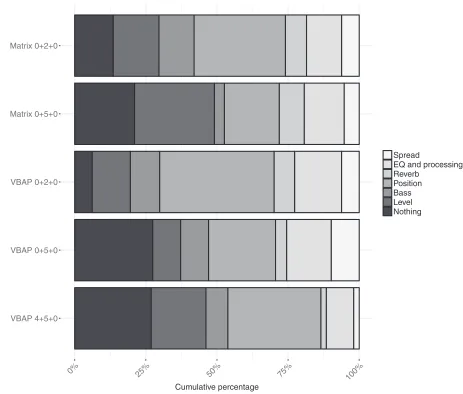
Table 3 shows the total number of suggested changes over all participants and program items. It can be seen from the table that the greatest number of suggested changes were for the VBAP and matrix 0+2+0 systems (91 and 70 changes respectively). The distribution of these data are shown in Fig. 4, which shows the cumulative frequency of process use broken down by target reproduction system. Changes in position are the most commonly suggested mix process for the VBAP 4+5+0, VBAP 0+5+0 system, VBAP 0+2+0, and matrix 0+2+0 systems. Changes in level were the most commonly suggested mix process for the matrix 0+5+0 system.
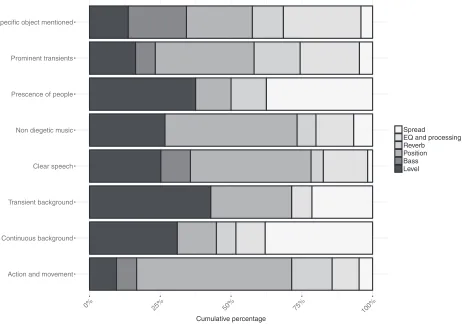
Fig. 5 shows the cumulative frequency of process use broken down by the type of audio object to which the pro-cess referred. The categories of objects are taken from a study into the cognitive categorization of auditory object in complex spatial audio scenes [37]. In general, for ac-tion/movement sounds, prominent transients, clear speech, and non-diegetic music, the most commonly suggested pro-cess was a change in position. For transient background sounds and sounds that indicate the presence of people, the most commonly suggested process was level. When no specific object was mentioned (i.e., processes on the overall scene), the most commonly suggested process was EQ and processing. For continuous background sounds and sounds indicating the presence of people, changes in the spread of the object were also commonly suggested.
3.3 Attributes
In the listening experiment described in Sec. 2.3, the par-ticipants were asked to indicate which perceptual attributes from a list had changed between the reference clip and the re-rendered or downmixed clip. Fig. 6 shows the frequency of attribute use across all systems and program items. It can be seen from this figure that the top three most frequently selected attributes relate to spatial aspects; this gives sup-port to the finding in Sec. 3.1.1 that the most commonly suggested change was positional. The open text box to enter other attributes was not used by any of the participants.
VBAP 4+5+0
VBAP 0+5+0
VBAP 0+2+0 Matrix 0+5+0 Matrix 0+2+0
0% 25% 50% 75%
100%
Cumulative percentage
Spread
EQ and processing Reverb
Position Bass Level
Nothing
Fig. 4. Cumulative percentage of process use, broken down by system.
to artifacts. These categories of perceptual attributes will be used in the regression model described in the following section.
3.4 Regression Models
3.4.1 Relationship between Perceptual Attributes and Mix Processes
This section describes the development of a regression model to explore the relationship between the changes to perceptual attributes identified by the test participants and the changes to the mix that they suggested.
Initially, each of the perceptual attributes were included separately and individually as independent variables in a multinomial logistic regression model with the mix pro-cesses identified in Sec. 3.1.1 (Process) as a dependent variable with a baseline ofNo change(i.e., the model ex-presses the log-odds of a given mix process being suggested compared to no changes being suggested). The choice of independent and dependent variables was based on the con-ceptual model detailed in Sec. 1.3, which posits that changes in attributes detected by the mix engineers cause a sugges-tion of a mix process. The purpose of this was to identify
any attributes that were not significant predictors of the changes proposed by the sound designers. The significance of each model was assessed via a likelihood ratio test against the null model. Any attribute that resulted in a likelihood ratio test with a p-value greater than 0.05 (i.e., no signif-icant improvement in model fit over the null model) was discounted from further analysis. Of the attributes inves-tigated, horizontal width, spectral balance, spatial open-ness, bandwidth, phasiopen-ness, reverb level,andspectral res-onances were found not to be significant predictors of Process.
[image:9.585.58.521.38.432.2]Action and movement Continuous background Transient background Clear speech Non diegetic music Prescence of people Prominent transients No specific object mentioned
0% 25% 50% 75%
100% Cumulative percentage
Spread
EQ and processing Reverb
Position Bass Level
Fig. 5. Cumulative percentage of process use broken down by object type.
0 50 100 150 200
Amo unt of distor
tion
Phasiness
Spectr
al resonances
Sub jecti
ve q uality of re
ver b
Over all spectr
al b alance
Lev el of re
ver b
Harshness
Ease of listening Band
width
Env eloping
Spectr al clar
ity DetailClar
ity
Hor izontal
width
Depth of fieldSpatial clar ity
Realism
Spatial opennessSpatial mo vement
Spatial nat uralness
Bass
Ensem ble
balance
Richness of so und
Surro unding
Sense of space Position of so
und
Co
u
nt
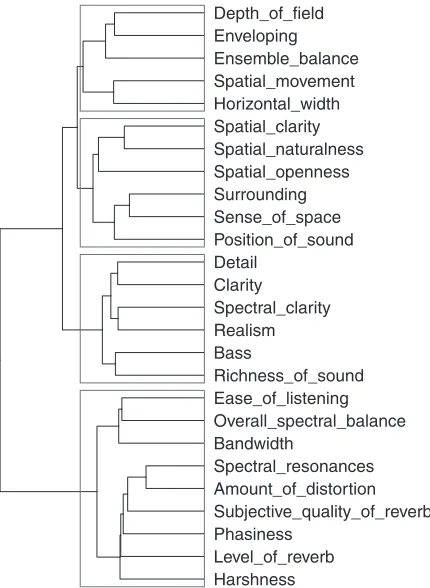
[image:10.585.64.526.42.368.2] [image:10.585.58.530.402.703.2]Harshness Level_of_reverb
Phasiness
Subjective_quality_of_reverb
Amount_of_distortion Spectral_resonances Bandwidth
Overall_spectral_balance Ease_of_listening Richness_of_sound Bass
Realism Spectral_clarity Clarity
Detail
[image:11.585.62.277.41.335.2]Position_of_sound Sense_of_space Surrounding Spatial_openness Spatial_naturalness Spatial_clarity Horizontal_width Spatial_movement Ensemble_balance Enveloping Depth_of_field
[image:11.585.55.285.411.495.2]Fig. 7. Dendrogram showing hierarchical agglomerative cluster-ing of attribute use across all systems and program items.
Table 4. Summary of the results of the multinomial logistic regression.
Block χ2 χ2 p R2 R2
Baseline 30.4 – 0.03 0.03 –
Spatial 1 102.25 71.85 < 0.0001 0.08 0.05 Spatial 2 157.85 55.6 < 0.0001 0.13 0.05 Timbral 214.19 56.34 < 0.0001 0.18 0.05 Artifacts 269.49 55.3 < 0.0001 0.22 0.04
The change in overallχ2of the model fit was used to test
the utility of each successive block of variables. The results of the multinomial logistic regression are summarized in Table 4. The table shows a clear improvement in the fit of the model as successive blocks of variables are entered into the model. The first two columns show the overallχ2
of the model and the change inχ2(χ2) over the previous model. For each block, the change inχ2over the previous model represents a significant improvement in the model fit (p<0.05).
The final two columns of Table 4 give the McFadden pseudoR2of the model and the improvement inR2 when
blocks of variables are entered into the model. The McFad-denR2value of the full model is 0.22. This is a pseudoR2
based on the increase in log-likelihood of the full model over the null model. As such pseudoR2 cannot be
inter-preted as a proportion of variance accounted for as in or-dinary linear regression; according to [50], values between 0.2 – 0.4 represent an “excellent fit.”
The results of the full model are given in Table 6 of Appendix II.
3.4.2 Relationship between Rendering System and Perceptual Attributes
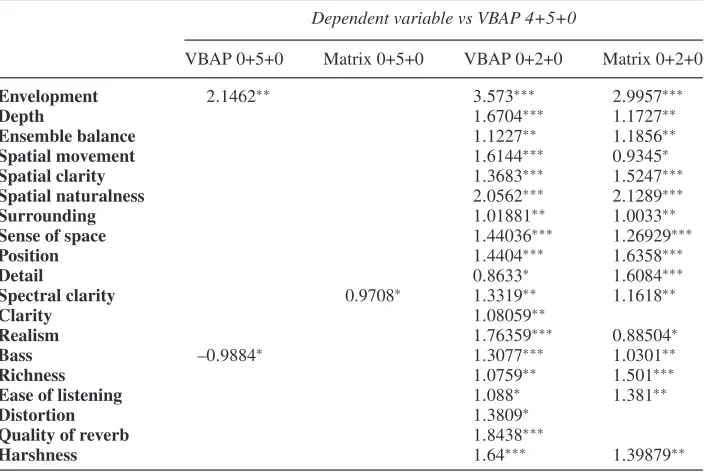
To investigate the effect of the different system types on changes to perceptual attributes, binomial logistic regres-sion models were calculated for each of the attributes with system type as the independent variable. The models are shown in Table 5. These models are all against a baseline of the VBAP 4+5+0 render3, therefore the models describe
the log-odds of a change of attribute being detected over the highest channel system in the test that was not the reference system. It can be seen that the only significant results at the p<0.05 level for the 0+5+0 systems was forenvelopmentin the VBAP rendering, suggesting the two 0+5+0 rendering methods performed similarly to the baseline VBAP 4+5+0 system; this result is in line with recent findings from Fran-combe et al.[32] where little difference was found between preference ratings of 5-channel and 9-channel systems. The two 0+2+0 systems result in significant changes in the the majority of the tested attributes.
4 DISCUSSION
The primary aim of the work presented in this paper was to determine a small number of common mix processes that professional content producers would employ when down-mixing object-based content to different speaker layouts. Text mining of the open response data collected in the lis-tening tests described in Sec. 2.3, combined with follow up interviews and cluster analysis, identified six general cate-gories of mix processes. The results suggest that changes in level and position are the most commonly suggested mix processes. These results provide a framework of common processes that could be built into an object-based renderer. The next steps in this work will focus on determining quan-titative rules that describe how professional mix engineers would vary these processes for different categories of audio objects.
The results presented in Fig. 5 suggest that these general processes apply differently to different categories of audio object. These findings provide evidence that any down-mix operations included in an object-based audio renderer should consider the category of object to which the process is being applied. The most commonly suggested changes across all categories of objects were changes in level and position. The mix processspreadwas suggested more com-monly for continuous and transient background objects and sounds indicating the presence of people than other ob-ject categories. Operations of the position of individual objects were commonly suggested for objects that indicate actions and movement compared to the other identified mix
3Due to the paired comparison method used, participants were
Table 5. Results of multinomial regression model for Process byattributes.
Dependent variable vs VBAP 4+5+0
VBAP 0+5+0 Matrix 0+5+0 VBAP 0+2+0 Matrix 0+2+0
Envelopment 2.1462∗∗ 3.573∗∗∗ 2.9957∗∗∗
Depth 1.6704∗∗∗ 1.1727∗∗
Ensemble balance 1.1227∗∗ 1.1856∗∗
Spatial movement 1.6144∗∗∗ 0.9345∗
Spatial clarity 1.3683∗∗∗ 1.5247∗∗∗
Spatial naturalness 2.0562∗∗∗ 2.1289∗∗∗
Surrounding 1.01881∗∗ 1.0033∗∗
Sense of space 1.44036∗∗∗ 1.26929∗∗∗
Position 1.4404∗∗∗ 1.6358∗∗∗
Detail 0.8633∗ 1.6084∗∗∗
Spectral clarity 0.9708∗ 1.3319∗∗ 1.1618∗∗
Clarity 1.08059∗∗
Realism 1.76359∗∗∗ 0.88504∗
Bass –0.9884∗ 1.3077∗∗∗ 1.0301∗∗
Richness 1.0759∗∗ 1.501∗∗∗
Ease of listening 1.088∗ 1.381∗∗
Distortion 1.3809∗
Quality of reverb 1.8438∗∗∗
Harshness 1.64∗∗∗ 1.39879∗∗
∗p<0.05;∗∗p<0.01;∗∗∗p<0.001
processes. The process EQ was suggested commonly in reference to operations on the overall scene and prominent transient sounds. One of the main advantages of object-based audio is the ability to operate on separate objects or categories of objects. Semantic metadata could be included to indicate the category of objects, and category specific rules could be incorporated into a rendering scheme to re-flect these differences. This could not be achieved with standard matrix downmixing methods.
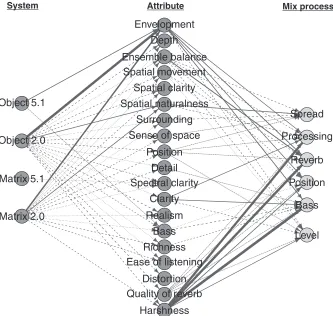
Fig. 8 provides a summary of the regression models de-rived in Secs. 3.4.1 and 3.4.2; lines are drawn where signif-icant relationships were found (p<0.05) and the thickness of each line is proportional to the effect size. In this case the odds ratio has been taken as an indication of the effect size. Chen et al. [51] provide an empirical relationship between odd-ratios and Cohen’s d. These relationships have been used to indicate the effect size in the Fig. 8; solid arrows indicate a large effect size (d 0.8), dashed arrows indicate a medium effect size (0.4d<0.8), dotted arrows indicate a small effect size (0.2d<0.4), and dot-dashed arrows indicate a very small effect size (d0.2).
The largest effect size for the relationships between the reproduction systems and the perceptual attributes is for theenvelopmentattribute, with odds ratios of 35.6 and 19.9 for the VBAP and Matrix 0+2+0 systems respectively. This means that if the same content is rendered to 0+2+0 using VBAP, a change in envelopment is 35.6 more likely than if the content were rendered to a 5+4+0 system. Smaller effect sizes can be seen between the 0+2+0 systems and the majority of the other attributes.
Overall, the largest effect sizes were with the attribute harshnessfollowed byenvelopmentandensemble balance. Recent research has shown that envelopment is one of the most important attributes in determining preference be-tween spatial audio systems [32]. This is supported by other
studies that have found that spatial attributes contribute to overall listener preference [26, 27, 52]. This suggests that OBA systems could deliver improvements to listener ex-perience if they employed optimized rendering rules for spatial attributes such as envelopment; recent research has shown that it is possible to adapt object-based mixes to result in different levels of envelopment [53]. Relation-ships with large and medium effect sizes can be observed betweenenvelopmentand all of the processes apart from spread. This suggests that the test participants were able to suggest changes to ameliorate the degradation of envelop-ment. Other attributes exhibiting large and medium effect sizes includeensemble balance,spatial movement,spatial naturalness, clarity, bass, richness,andharshness.
5 CONCLUSION
This paper has presented the results of an experiment de-signed to identify a small number of the most common mix processes used by sound designers when mixing object-based content to loudspeaker systems with different num-bers of channels. Six general mix processes were identified from open text data gathered in the listening experiment. These processes were related to the spatial spread of indi-vidual objects, EQ and processing, reverb, position, bass, and level. Over all program items and systems tested, the most commonly suggested process was a change in the position of individual objects.
Envelopment Depth Ensemble balance
Spatial movement Spatial clarity Spatial naturalness
Surrounding Sense of space
Position Detail Spectral clarity
Clarity Realism
Bass Richness Ease of listening
Distortion Quality of reverb
Harshness Object 5.1
Object 2.0
Matrix 5.1
Matrix 2.0
Spread Processing
Reverb Position
Bass
Level
System Attribute Mix process
[image:13.585.130.463.49.365.2]System Attribute Mix process
Fig. 8. Summary of the relationships revealed in models described in Secs. 3.4.1 and 3.4.2. The solid arrows indicate a large effect size, dashed is a medium effect size, dotted is a small effect size, and dot-dahed is a very small effect size.
0+2+0 system andenvelopment. Significant relationships were also found between changes in perceptual attributes and the suggested mix processes. The largest effect sizes were with the attributeharshnessfollowed byenvelopment andensemble balance. Although it was ensured that the program material used in the test covered a wide range of audio object types, it should be noted that the study was lim-ited to audio drama program material; other processes and relationships may be found for different types of program material.
Taken together, these results show that when professional content producers detect changes in perceptual attributes when rendering the same content to systems with different numbers of channels, they are able to suggest changes to the mix that can be categorized into a small number of common processes. The relative frequency that the content creators suggested different mix processes was found to differ be-tween categories of audio objects; this finding suggests any downmix operations included in an object-based audio ren-derer should consider the category of object to which the process is being applied. In the study, test participants were asked about their intentions rather than asking them to di-rectly operate on the mix. The next step of this work will be to allow content producers to directly manipulate the identified mix processes in a method of adjustment task in order to determine quantitative rules that could be built into an intelligent object-based renderer.
6 ACKNOWLEDGMENTS
This work was supported by the EPSRC Programme Grant S3A: Future Spatial Audio for an Immersive Lis-tener Experience at Home (EP/L000539/1) and the BBC as part of the BBC Audio Research Partnership. The authors would like to thank Chris Pike from BBC R&D for his help generating the the material for the tests and Jon Francombe from the University of Surrey for his input and comments on the design of the experiment. Finally, the authors would like to thank the participants of the experiment for their time.
The experimental data underlying the findings are fully available without restriction, details are available from https://doi.org/10.17866/rd.salford.3120112.
7 REFERENCES
[1] S. A. Silva M. Armstrong, M. Brooks, A. Churnside, F. Melchior, and M. Shotton “Object-Based Broadcasting—Curation, Responsiveness and User Expe-rience,”International Broadcasting Convention, IBC2014 (2014).
[2] S3A - Future Spatial Audio for an Immersive Listener Experience, http://www.s3a-spatialaudio.org/wordpress/. Accessed: 2017-08-06.
[4] 2-Immerse, https://2immerse.eu/. Accessed: 2017-08-06.
[5] J. Herre, J. Hilpert, A. Kuntz, and J. Plogsties “MPEG-H 3D Audio–The New Standard for Coding of Immersive Spatial Audio,” IEEE J. Sel. Topics Sig-nal Process., vol. 9, no. 5, pp. 770–779 (2015 May), https://doi.org/10.1109/jstsp.2015.2411578.
[6] S. F¨ug, D. Marston, and S. Norcross “The Audio Definition Mode—A Flexible Standardized Representation for Next Generation Audio Content in Broadcasting and Beyond,” presented at the141st Convention of the Audio Engineering Society(2016 Sep.), convention paper 9626.
[7] S. Mehta, T. Onders, and J. Riedmiller “Recipes for Creating and Delivering Next-Generation Broadcast Audio,” SMPTE Motion Imaging J., vol. 125, no. 9, pp. 25–32 (2015 Nov.-Dec.), https://dx.doi.org/10.5594/ JMI.2016.2619304.
[8] J. M. Jot, B. Smith, and J. Thompson “Dialog Con-trol and Enhancement in Object-Based Audio Systems,” presented at the139th Convention of the Audio Engineer-ing Society(2015 Oct.), convention paper 9356.
[9] V. Pulkki “Virtual Sound Source Positioning Using Vector Base Amplitude Panning,”J. Audio Eng. Soc., vol. 45, pp. 456–466 (1997 Jun.).
[10] D. Dugan “Automatic Microphone Mixing,”J. Au-dio Eng. Soc., vol. 23 no. 6 pp. 442–449 (1975 Aug.).
[11] M. J. Terrell and J. D. Reiss “Automatic Monitor Mixing for Live Musical Performance,”J. Audio Eng. Soc., vol. 57, pp. 927–936 (2009 Nov.).
[12] E. Perez-Gonzalez and J. D. Reiss “Automatic Mix-ing: Live Downmixing Stereo Panner,”Proc. 10th Int. Conf. Digital Audio Effects (DAFx-07), Bordeaux, France (2007 Sep.).
[13] J. D. Reiss and E. Perez-Gonzalez “An Automatic Maximum Gain Normalization Technique with Applica-tions to Audio Mixing,” presented at the124th Convention of the Audio Engineering Society(2008 May), convention paper 7411.
[14] E. Perez-Gonzalez and J. D. Reiss “Improved Con-trol for Selective Minimization of Masking Using Inter-Channel Dependancy Effects,”Proc. 11th Int. Conf. Digital Audio Effects (DAFx-08), Espoo, Finland (2008 Sep.).
[15] S. Hafezi and J. D. Reiss “Autonomous Multitrack Equalization Based on Masking Reduction,”J. Audio Eng. Soc., vol. 63, pp. 312–323 (2015 May).
[16] B. Kolasinski “A Framework for Automatic Mix-ing UsMix-ing Timbral Similarity Measures and Genetic Opti-mization,” presented at the124th Convention of the Audio Engineering Society(May 2008), convention paper 7496.
[17] S. Mansbridge, S. Finn, and J. D. Reiss “Im-plementation and Evaluation of Autonomous Multi-Track Fader Control,” presented at the132nd Convention of the Audio Engineering Society(2012 Apr.), convention paper 8588.
[18] G. Ren, G. Bocko, J. Lundberg, D. Headlam, and M. F. Bocko “Automatic Music Production System Employ-ing Probabilistic Expert Systems,” presented at the129th Convention of the Audio Engineering Society(2010 Nov.), convention paper 8255.
[19] P. Pestana and J. D. Reiss “Intelligent Audio Pro-duction Strategies Informed by Best Practices,” presented at theAES 53rd International Conference: Semantic Audio (2014 Jan.), conference paper S2-2.
[20] T. Letowski “Sound Quality Assessment: Con-cepts and Criteria,” presented at the87th Convention of the Audio Engineering Society(1989 Oct.), convention paper 2825.
[21] F. Rumsey, S. Zieli´nski, R. Kassier, and S. Bech “On the Relative Importance of Spatial and Timbral Fideli-ties in Judgments of Degraded Multichannel Audio Qual-ity,”J. Acoust. Soc. of Amer., vol. 118, no. 2, pp. 968–976 ( 2005 Aug.) https://doi.org/10.1121/1.1945368.
[22] N. Zacharov and K. Koivuniemi “Unravelling the Perception of Spatial Sound Reproduction: Analysis & Ex-ternal Preference Mapping,” presented at the 111th Con-vention of the Audio Engineering Society(2001 Nov.), con-vention paper 5423.
[23] N. Zacharov and K. Koivuniemi “Unravelling the Perception of Spatial Sound Reproduction: Language De-velopment, Verbal Protocol Analysis and Listener Train-ing,” presented at the 111th Convention of the Au-dio Engineering Society (2001 Nov.), convention paper 5424.
[24] N. Zacharov and K. Koivuniemi “Unraveling the Perception of Spatial Sound Reproduction: Techniques and Experimental Design,” presented at the AES 19th International Conference: Surround Sound—Techniques, Technology, and Perception(2001 Jun.), conference paper 1929.
[25] C. Guastavino and B. F. G. Katz “Perceptual Evalu-ation of Multi-Dimensional Spatial Audio Reproduction,” J. Acoust. Soc. of Amer., vol. 116, no. 2, pp. 1105–1115 (2004 Aug.) https://doi.org/10.1121/1.1763973.
[26] S. Choisel and F. Wickelmaier “Extraction of Au-ditory Features and Elicitation of Attributes for the Assess-ment of Multichannel Reproduced Sound,”J. Audio Eng. Soc., vol. 54, pp. 815–826 (2006 Sep.).
[27] S. Choisel and F. Wickelmaier “Evaluation of Multichannel Reproduced Sound: Scaling Auditory At-tributes Underlying Listener Preference,” J. Acoust. Soc. of Amer., vol. 121, no. 1, pp. 388–400 (2007 Jan.) https://doi.org/10.1121/1.2385043.
[28] A. Lindau, V. Erbes, S. Lepa, H. J. Maem-pel, F. Brinkman, and S. Weinzierl “A Spatial Au-dio Quality Inventory (SAQI),” Acta Acust. united Acust., vol. 100, no. 5, pp. 984–994 (2014 Sep.-Oct.) https://doi.org/10.3813/AAA.918778.
[29] N. Zacharov, T. Pedersen and C. Pike “A Common Lexicon for Spatial Sound Quality Assessment—Latest De-velopments,”Proc. 8th Int. Conf. on Quality of Multime-dia Experience (QoMEX), Lisbon, Portugal (2016 Jun.) https://doi.org/10.1109/QoMEX.2016.7498967.
[30] J. Francombe, T. Brookes, and R. Mason "Percep-tual Evaluation of Spatial Audio: Where Next?"Proc. 22nd Int. Congress on Sound and Vibration (ICSV) Florence, Italy (2015 Jul.).
Elicitation of Perceptual Differences,”J. Audio Eng. Soc., vol. 65, pp. 198–211 (2017 Mar.).
[32] J. Francombe, T. Brookes, R. Mason, and J. Wood-cock “Evaluation of Spatial Audio Reproduction Methods (Part 2): Analysis of Listener Preference,” J. Audio Eng. Soc., vol. 65, pp. 212–225 (2017 Mar.).
[33] ITU-R, “Recommendation BS.2051, Advanced sound system for programme production,” International Telecommunications Union (ITU) (2017).
[34] C. H. CoombsA Theory of Data(Wiley, 1964). [35] J. Blauert and U. Jekosch “A Layer Model of Sound Quality,”J. Audio Eng. Soc., vol. 60, pp. 4–12 (2012 Jan./Feb.).
[36] J. Woodcock, C. Pike, F. Melchior, P. Coleman, A. Franck, and A. Hilton “Presenting the S3A Object-Based Audio Drama Dataset,” presented at the 140th Conven-tion of the Audio Engineering Society(2016 May), eBrief 255.
[37] J. Woodcock, W. J. Davies, T. J. Cox, and F. Melchior “Categorization of Broadcast Audio Objects in Complex Auditory Scenes,”J. Audio Eng. Soc., vol. 64, pp. 380–394 (2016 Jun.).
[38] J. Woodcock, W. J. Davies, and T. J. Cox “A Cognitive Framework for the Categoriza-tion of Auditory Objects in Urban Soundscapes,” Appl. Acoust., vol. 121, pp. 56–64 (2017 Jun.) https://doi.org/10.1016/j.apacoust.2017.01.027.
[39] P. Coleman, A. Franck, J. Francombe, Q. Liu, T. Campos, R. J. Hughes, D. Menzies, M. F. S. G´alvez, Y. Tang, J. Woodcock, P. J. B. Jackson, F. Melchior, C. Pike, F. M. Fazi, T. J. Cox, and A. Hilton “An Audio-Visual System for Object-Based Audio: From Recording to Listening,” IEEE Tran. Mult. (In Press, 2018).
[40] T. Komori, S. Oode, K. Ono, K. Irie, Y. Sasaki, T. Hasegawa, and I. Samaya “Subjective Loudness of 22.2 Multichannel Programs,” presented at the138th Convention of the Audio Engineering Society(May 2015), convention paper 9219.
[41] ITU-R, “Recommendation BS.1770-2, Algorithms to measure audio programme loudness and true-peak au-dio level,” International Telecommunications Union (ITU) (2011).
[42] ITU-R, “Recommendation BS.1116, Methods for the subjective assessment of small impairments in audio systems including multichannel sound systems,” Interna-tional Telecommunications Union (1997).
[43] T. Nixon, A. Bonny, and F. Melchior “A Ref-erence Listening Room for 3D Audio Research,” Proc. 3rd Int. Conf. on Spatial Audio (ICSA), Graz, Austria (2015 Sep.).
[44] C. D. Manning, P. Raghavan, and H. Sch¨utz In-troduction to Information Retrieval, Volume 1(Cambridge University Press, 2008).
[45] R. Xu and D. Wunch Clustering (John Wiley & Sons, 2008), pp. 31–61.
[46] J. S. Long and J. Freese Regression Models for Categorical Dependent Variables Using Stata(Stata Press, 2006).
[47] S. M. Weiss, N. Indurkhya, T. Zhang, and F. Dam-erau Text Mining: Predictive Methods for Analyzing Un-structured Information(Springer Science & Business Me-dia, 2010).
[48] C. Buckley “Implementation of the Smart Infor-mation Retrieval System, ” Technical Report, Cornell Uni-versity (1985).
[49] J. H. Ward “Hierarchical Grouping to Optimize an Objective Function,”J. Am. Stat. Assoc., vol. 58, no. 301, pp. 236–244 (1963 Mar.).
[50] D. McFadden “Quantitative Methods for Analyz-ing Travel Behavior of Individuals: Some Recent Devel-opments,” inBehavioural Travel Modelling(Croom Helm, 1978), pp. 279–318.
[51] H. Chen, P. Cohen, and S. Chen “How Big Is a Big Odds Ratio? Interpreting the Magnitudes of Odds Ratios in Epidemiological Studies,” Communica-tions in Statistics–Simulation and Computation, vol. 39, no. 4, pp. 860–864 (2010 Apr.) https://doi.org/10.1080/ 03610911003650383.
[52] N. Zacharov and K. Koivuniemi “Audio Descrip-tive Analysis & Mapping of Spatial Sound Displays,”Proc. 2001 Int. Conf. on Auditory Display, Espoo, Finland (2001 Jul.).
[53] J. Francombe, T. Brookes, and R. Mason “Deter-mination and Validation of Mix Parameters for Modifying Envelopment in Object-Based Audio Mixes,” J. Audio Eng. Soc. (In press).
APPENDIX I
Below is a list of the stopwords used in the text mining analysis:
doesnt, sound, sounds, bit, think, also, downmix, good, better, slightly, seems, there, needs, little, get, like, feels, mix, clips, clip, lack, increase, decrease, lower, raise, slight, better, thinner, nice, perfect, cleaner, very, low, sudden, slight, too, excllent, reduce, noticible, previous, add, be-tween, sides, down, sources, front, rear, left, right, above, central, surround, actors, hubub, man, child, Children, vo, dialogue, loudhailer, lady, kid, Voice, crowd, dog, bark, vio-lins, music, chord, narrator, narrators, woodpecker, mega-phone, dad, humming, chartacters, speach, monster, son, girls, tom, shouting, boy, ducks, synth, dinosaur, dialogues, barking, footsteps, male, vocal, girl, speach, megafono, thump, goose, character, background speakers, speaker, far, match, original, wider, centre, trebly, first, half, opening, back, harsh, mid, high, field, shifted, atmos, stereo, lost, voice, well
APPENDIX II
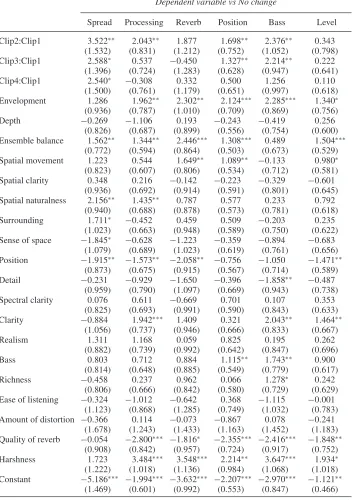
Table 6. Results of multinomial regression model for Process byClipandattributes.
Dependent variable vs No change
Spread Processing Reverb Position Bass Level
Clip2:Clip1 3.522∗∗ 2.043∗∗ 1.877 1.698∗∗ 2.376∗∗ 0.343 (1.532) (0.831) (1.212) (0.752) (1.052) (0.798) Clip3:Clip1 2.588∗ 0.537 −0.450 1.327∗∗ 2.214∗∗ 0.222
(1.396) (0.724) (1.283) (0.628) (0.947) (0.641)
Clip4:Clip1 2.540∗ −0.308 0.332 0.500 1.256 0.110
(1.500) (0.761) (1.179) (0.651) (0.997) (0.618) Envelopment 1.286 1.962∗∗ 2.302∗∗ 2.124∗∗∗ 2.285∗∗∗ 1.340∗ (0.936) (0.787) (1.010) (0.709) (0.869) (0.756)
Depth −0.269 −1.106 0.193 −0.243 −0.419 0.256
(0.826) (0.687) (0.899) (0.556) (0.754) (0.600) Ensemble balance 1.562∗∗ 1.344∗∗ 2.446∗∗∗ 1.308∗∗∗ 0.489 1.504∗∗∗
(0.772) (0.594) (0.864) (0.503) (0.673) (0.529) Spatial movement 1.223 0.544 1.649∗∗ 1.089∗∗ −0.133 0.980∗ (0.823) (0.607) (0.806) (0.534) (0.712) (0.581) Spatial clarity 0.348 0.216 −0.142 −0.223 −0.329 −0.601
(0.936) (0.692) (0.914) (0.591) (0.801) (0.645) Spatial naturalness 2.156∗∗ 1.435∗∗ 0.787 0.577 0.233 0.792
(0.940) (0.688) (0.878) (0.573) (0.781) (0.618) Surrounding 1.711∗ −0.452 0.459 0.509 −0.203 0.235
(1.023) (0.663) (0.948) (0.589) (0.750) (0.622) Sense of space −1.845∗ −0.628 −1.223 −0.359 −0.894 −0.683
(1.079) (0.689) (1.023) (0.619) (0.761) (0.656) Position −1.915∗∗ −1.573∗∗ −2.058∗∗ −0.756 −1.050 −1.471∗∗
(0.873) (0.675) (0.915) (0.567) (0.714) (0.589) Detail −0.231 −0.929 −1.650 −0.396 −1.858∗∗ −0.487
(0.959) (0.790) (1.097) (0.669) (0.943) (0.738) Spectral clarity 0.076 0.611 −0.669 0.701 0.107 0.353
(0.825) (0.693) (0.991) (0.590) (0.843) (0.633) Clarity −0.884 1.942∗∗∗ 1.409 0.321 2.043∗∗ 1.464∗∗
(1.056) (0.737) (0.946) (0.666) (0.833) (0.667)
Realism 1.311 1.168 0.059 0.825 0.195 0.262
(0.882) (0.739) (0.992) (0.642) (0.847) (0.696)
Bass 0.803 0.712 0.884 1.115∗∗ 1.743∗∗ 0.900
(0.814) (0.648) (0.885) (0.549) (0.779) (0.617)
Richness −0.458 0.237 0.962 0.066 1.278∗ 0.242
(0.806) (0.666) (0.842) (0.580) (0.729) (0.629) Ease of listening −0.324 −1.012 −0.642 0.368 −1.115 −0.001
(1.123) (0.868) (1.285) (0.749) (1.032) (0.783) Amount of distortion −0.366 0.114 −0.073 −0.867 0.078 −0.241
(1.678) (1.243) (1.433) (1.163) (1.452) (1.183) Quality of reverb −0.054 −2.800∗∗∗ −1.816∗ −2.355∗∗∗ −2.416∗∗∗ −1.848∗∗
(0.908) (0.842) (0.957) (0.724) (0.917) (0.752) Harshness 1.723 3.484∗∗∗ 3.548∗∗∗ 2.214∗∗ 3.647∗∗∗ 1.934∗ (1.222) (1.018) (1.136) (0.984) (1.068) (1.018) Constant −5.186∗∗∗ −1.994∗∗∗ −3.632∗∗∗ −2.207∗∗∗ −2.970∗∗∗ −1.121∗∗
(1.469) (0.601) (0.992) (0.553) (0.847) (0.466)
THE AUTHORS
James Woodcock William J. Davies Frank Melchior Trevor J. Cox
James Woodcock is a research fellow at the University of Salford. His primary area of research is the perception and cognition of complex sound and vibration. James holds a B.Sc. in audio technology, a M.Sc. by research in product sound quality, and a Ph.D. in the human response to whole body vibration, all from the University of Salford. James is currently working on the EPSRC funded S3A project. His work on this project mainly focuses on the perception of auditory objects in complex scenes, the listener experience of spatial audio, and intelligent rendering for object-based audio.
•
Bill Davies is professor of acoustics and perception at the University of Salford. He researches human re-sponse to complex sound fields in areas such as room acoustics, spatial audio, and urban soundscapes. He led the Positive Soundscape Project, an interdisciplinary effort to develop new ways of evaluating the urban sound envi-ronment. Bill also leads work on perception of complex auditory scenes on the S3A project. He edited a special edition ofApplied Acousticson soundscapes, and sits on ISO TC43/SC1/WG54 producing standards on soundscape assessment. He is an Associate Dean in the School of Com-puting, Science and Engineering at Salford and a recent Vice-President of the Institute of Acoustics (the UK pro-fessional body). Bill holds a B.Sc. in electroacoustics and a Ph.D. in auditorium acoustics, both from Salford. He is the author of 80 academic publications in journals, conference proceedings, and books.
•
Frank Melchior received the Dipl.-Ing. degree in me-dia technology from the Ilmenau University of Technology,
Germany, in 2003 and the Dr ing. degree from Delft Univer-sity of Technology, The Netherlands, in 2011. From 2012 to 2017 he led the audio research group and the BBC Audio Research Partnership at BBC Research and Development. From 2009 to 2012 he was the Chief Technical Officer and Director Research and Development at IOSONO GmbH, Germany. From 2003 to 2009 he worked as a researcher at the Fraunhofer Institute Digital Media Technology, Ger-many. He holds several patents and has authored and co-authored a number of papers in international journals and conference proceedings.
•
Trevor Cox is Professor of acoustic engineering at the University of Salford and a past president of the UK’s In-stitute of Acoustics (IOA). Trevor’s diffuser designs can be found in rooms around the world. He is co-author of