International Journal of Emerging Technology and Advanced Engineering
Website: www.ijetae.com (ISSN 2250-2459,ISO 9001:2008Certified Journal, Volume 3, Issue 11, November 2013)
479
Optimization of Web Content Mining with an Improved
Clustering Algorithm
Sovers Singh Bisht1, Prof. (Dr.) Sanjeev Bansal2 1,2
Amity School of Engineering And Technology, Amity University, Noida, India
Abstract—Web Content Mining generally consist of mining the content held within the web pages. The aim of this paper is to evaluate, propose and improve the use of advance web data clustering techniques which is highly used in the advent of mining large content based data sets which allows data analysts to conduct more efficient execution of large scale web data searches.
In the search space data is available in a random fashion which may cause trafficking when searched multiple times. Thus in this paper we provide an improved algorithm which may reduce the search space in search engines using clustering techniques.
Keywords—Web mining, database, clustering algorithm, web document, data sets, K-mean clustering and Web usage mining.
I. Introduction
This paper is primarily focussed in describing the most important issues related to ―Improving the efficiency of textual static web content mining techniques using highly improved clustering techniques‖.Clustering has also found many applications in Web search for example if we search a keyword it might return a large number of hits i.e. is pages relevant to the search due to extremely large number of web pages. Thus we can say that clustering techniques can be highly recognised to arrange data in groups and then and then present the result in precise and concise accessible way. However when the content of data is large clustering can be used to cluster data into topics which are commonly used in information retrieval practices. As a data mining function cluster analysis can be used as a data mining tool to gain insight into distribution of data, to observe the characteristic of each data cluster and helps to focus in clusters of different kinds for further analysis. We know that data represented as web content can be of different types but primarily when we talk about text data our responsible area is large as the query generated within the search engine is in the form of text thus optimization of textual data in web is highly a challenging task.
1.1 Web Mining Categories
Web mining is highly divided into three categories upon which our research is focused these are web content mining, web structure mining and web usage mining.
A. Web Content Mining
Web content mining, also known as text mining, is generally the second step in Web data mining. Content mining is the scanning and mining of text, pictures and graphs of a Web page to determine the relevance of the content to the search query. This scanning is completed after the clusteringof web pages through structure mining and provides the results based upon the level of relevance to the suggested query. With the massive amount of information that is available on the World Wide Web, content mining provides the results lists to search engines in order of highest relevance to the keywords in the query.
B. Web Structure Mining
It is a process by which we discover the model of link structure of web pages. We catalog the links, generate the web pages Generate the information such as the similarity and relations among them by taking the advantage of hyperlink topology. The goal of Web Structure Mining is to generate structured summary about the website and web page. Page Rank and hyperlink analysis also fall in this category. It tries to discover the link structure of hyper links at inter document level. As it is very common that the web documents contain links and they use both the real or primary data on the web so it can be concluded that Web Structure Mining has a relation with Web Content Mining.
C. Web Usage Mining
International Journal of Emerging Technology and Advanced Engineering
Website: www.ijetae.com (ISSN 2250-2459,ISO 9001:2008Certified Journal, Volume 3, Issue 11, November 2013)
480
1.2 Existing System
Text mining is an emerging technology for extracting meaning from the ―unclustered and unstructured text ―that constitutes a majority of enterprise information assets. Clustering is a technique to group together a set of items having similar characteristics .Clustering can be performed on either the users or the page views. Clustering analysis in web usage mining intends to find the cluster of user, page, or sessions from web log file, where each cluster represents a group of objects with common interesting or characteristic. User clustering is designed to find user groups that have common interests based on their behaviors, and it is critical for user community construction. Page clustering is the process of clustering pages according to the users’ access over them. Such knowledge is especially useful for inferring user demographics in order to perform market segmentation in e-Commerce applications or provide personalized web content to the users. On the other hand, clustering of pages will discover groups of pages having related content. This information is useful for the Internet search engines and Web assistance providers. In both applications, permanent or dynamic HTML pages can be created that suggest related hyperlinks to the user according to the user’s query or past history of information needs. The intuition is that if the probability of visiting page, given page has also been visited, and is high, and then maybe they can be grouped into one cluster. For session clustering, all the sessions are processed to find some interesting session clusters. Each session cluster may be one interesting topic within the web site. Abraham et al [AR2003] proposed an ant-clustering algorithm to discover web usage patterns and a linear genetic programming approach to analyze the visitor trends. They proposed hybrid framework, which uses an ant colony optimization algorithm to cluster Web usage patterns. The raw data from the log files are cleaned and preprocessed and the ACLUSTER algorithm is used to identify the usage patterns.
The developed clusters of data are fed to a linear genetic programming model to analyze the usage trends.
The purpose of knowledge discovery from users profile is to find clusters of similar interests among the users [SZAS1997]. If the site is well designed, there will be strong correlation among the similarity of the navigation paths and similarity among the users interest.
II. PROBLEM STATEMENT
We know that whenever we have the process of web content mining we have to access large amount of textual data from different heterogeneous sources and thus this task becomes very cumbersome as data recovery is difficult and takes a lot of time.
Suppose we have a large organization and have different managers who look after the different operations in that organization thus our primarily task is to group the employees in different groups or clusters such as the staffing process is qualitatively summarized. For these cluster formation we use different techniques available in the literature as of now we are focusing on the partitioning techniques of clustering which is basically of two types these are K-means and K-medoids. These two algorithms basically work on repeated number of scans in the database for cluster formation and thus give us approximate results. We work on these algorithms as to whenever we scan the database for textual content we get approximate results with frequently occurring elements in the database. Some problems with existing techniques are as follows:
Optimizing the within cluster variation is
computationally challenging.
The k-means method is not guaranteed to
converge to the global optimum and often terminates at a local optimum.
The necessasity for users to specify k, the number
of clusters in advance can be seen as a disadvantage.
The web pages at different servers are similar thus
clustering the data according to the relevance requires a large amount of query system.
Filters are used widely and outliers may not be detected and if detected may not be recognized.
Redundant web pages may be outliers and thus
they have to be out clustered and sorted according to the relevance.
2.1 Algorithm Reviews
International Journal of Emerging Technology and Advanced Engineering
Website: www.ijetae.com (ISSN 2250-2459,ISO 9001:2008Certified Journal, Volume 3, Issue 11, November 2013)
481
The clustering algorithm is the K-means method. The K-means method takes an input parameter k,
whichIndicates the number of clusters the user wants to form.
Initially, k values (points) are chosen at random from theSet of all data points to represent the centre (mean) value of each cluster. Then every other point on the plane is assigned to the cluster it is closest to.The "closest cluster" is determined by the shortest
Distance from a point to the mean value of each cluster,
Using formula:d = √ (α(x1 - x2)2 + β (y1 - y2)2) Whereα and β are coefficients with a default value of 1.000
The k-means algorithm works only with numeric attributes. The distance based algorithms rely on a distance metric to measure the similarity between data points. Thus the distance metric is either Euclidean, Cosine or Fast Cosine distance. The data points are assigned to the nearest cluster according to the distance metric.
The k-mean algorithm:
Begin with the data sets.
1. The k-means algorithm for partitioning, where
each cluster’s center is represented by the mean value of the objects in the cluster.
2. Input:
Initialize N, K, C1,C2….Ck;
Where N is the size of the data set, K is the number of clusters, C1,C2,….Ck are cluster centers.
3. Do assign the n data points to the closest Ci;
Recomputed C1,C2….Ck using Simple mean
Function;
Until no change in C1,C2….Ck;
4. Return C1,C2….Ck;
5. End
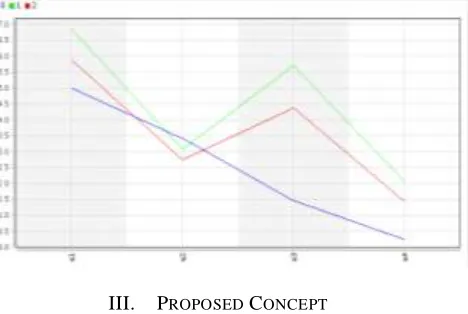
Now when taking sample data of market analysis and check whether the cluster formation we come into the conclusion of getting the following cluster formation with the following graphical representation.
[image:3.612.328.562.340.497.2]The transactional data with numeric attributes forms three clusters and with four frequently occurring elements thus these elements with three mean values are clustered according to the following representation.
Table 1
Shows cluster formation with attribute set.
Attribute Cluster 0 Cluster 1 Cluster 2
a1 5.005 6.853 5.883
a2
3.418 3.076 2.740
a3 1.464 5.715 4.388
a4 0.243 2.053 1.434
Thus when we graphically represent the cluster formation we get the following desired curve where each attribute is shown with a specific cluster formation where we met our objective of high intracluster similarity and low intercluster similarity.
III. PROPOSED CONCEPT
International Journal of Emerging Technology and Advanced Engineering
Website: www.ijetae.com (ISSN 2250-2459,ISO 9001:2008Certified Journal, Volume 3, Issue 11, November 2013)
482 Proposed Algorithm:
Input
The data set of numeric form and apply the following process.
Procedure
1. The data set is sorted according to the probability of occurrence of elements from the frequency of occurrence within a given data set
2. This process is repeat until no new large item sets are identified (this is to remove redundant data and missing values).
3. Group the elements according such as no two elements are repeated and thus multiple the probabilities such that every elements is paired with every other element.
4. Initialize N, K, C1,C2….Ck;
Where N is the size of the data set, K is the number of clusters, C1,C2,….Ck are cluster centers.
6. Do assign the n data points to the closest Ci;
Recomputed C1,C2….Ck using Simple mean
Function;
Until no change in C1,C2….Ck;
7. Return C1,C2….Ck;
8. End
3.1 Applying the Proposed Approach
The above algorithm has its own advantages from the simple k-means algorithm especially in cluster formation. Since the proposed algorithm apply a different approach of probability distribution of frequently occurring elements and grouping of elements thus the attribute head count is also reduced. Now taking again the same sample data used in simple k-means algorithm we get some different results as follows.
The probability of occurrence of elements is calculated as number of events occurred upon number of possible outcomes thus whenever we have large dataset or suppose data of credit card collections where a single person can have different credit cards with different fraudulent information with each and he swipes cards at different counters multiple times and every time he swipes a card a transaction is generated and a query is generated for its collection. So, if we want to limit its customer data access according to credit cards or according to transactions or purpose we need to form clusters representing different information parameters.
[image:4.612.324.564.194.252.2]Now, suppose if we take the same data set as above with k means it is given as follows:
Table 2
Example of data set used for analysis within k-means and proposed algorithm.
TID ITEMSETS
1 1,2,3
2 1
3 4,5,6
With K-means if we take k=2 and finding the within cluster variation we get the following output with two groups:
Cluster 1(1, 2, 3) (1, 4, 5, 6) here 1 is an redundant data set in both the groups.
Cluster 2(1, 2) (3, 1, 4, 5, 6) now here we find the within cluster variations by undergoing number of scans we get 15 for cluster1 and 34.5 for cluster 2. Thus we come into conclusion that smallest the cluster variation high is the intracluster similarity for the object and cluster centroid.
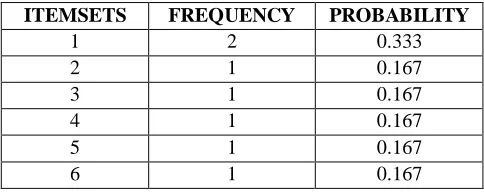
Now, when we form the chart for the distribution according to probability we get the following table:
Table 3
Calculation of frequency and probability of occurrence of elements to compute the cluster analysis with proposed algorithm.
ITEMSETS FREQUENCY PROBABILITY
1 2 0.333
2 1 0.167
3 1 0.167
4 1 0.167
5 1 0.167
6 1 0.167
This is the table generated according to above data set with the proposed algorithm.
Now, when we divide them into clusters we get the following results according to the probability distribution.
Cluster 1(0.333, 0.167) (0.167,0.167,0.167,0.167) we get within cluster variation as 0.332.
[image:4.612.323.565.433.529.2]International Journal of Emerging Technology and Advanced Engineering
Website: www.ijetae.com (ISSN 2250-2459,ISO 9001:2008Certified Journal, Volume 3, Issue 11, November 2013)
[image:5.612.53.284.159.203.2]483 Table 4
Results Comparison
Test data K-means Proposed Concept
Group 1 15 0.332.
Group 2 34.5 0.027.
IV. CONCLUSION
This paper presents a new mechanism for an improved cluster formation as the clusters are good in number and high in quality of information for analysis. The performance of new algorithm neither does nor depends upon the size, scale and values in dataset. The new algorithm has great advantages in error with real results and selecting initial points in almost every case. Thus the advantages above the k-means algorithm are given as follows:
This approach saves cost and time of scanning highly
large database in ETL application of scanning a large database as the probability function reduces the redundancy of frequently occurring elements.
Whenever we find probabilities of large datasets it is easier to generate fast moving data streams such as real time traffic and network monitoring thus clustering becomes easier and compact.
This method is highly scalable as optimization of within cluster variation is drastically improved.
This method can be used in scan global databases from different heterogeneous sources thus and does not terminate at local optimum as increasing the number of groups compresses the data to further extent.
Outliers can be easily adjusted and removed as redundant and missing values and placed within a cluster as in k-means outliers are not easily detected.
Since we group according to the probability
distribution thus as number of cluster increases web content becomes move centric and unique.
V. FUTURE SCOPE
Since in this we group according to the probability distribution, in future we can work on improving the within cluster variation by first sorting the objects according to correlation within each and then finding probability and running the scans with the above or any clustering algorithm . This will improve the quality of clusters and entropy of information gain from each cluster.
REFERENCES
[1] R.Agrawal and R.Srikant. Fast algorithms for mining association rules.In VLDB’94, pp.487 {499.
[2] Data Mining: Concepts and Techniques: Concepts and Techniques -Jiawei Han, Micheline Kamber, Jian Pei.
[3] Optimizing the web mining techniques using heuristic approach – Gunjan atral, Vijay Laxmi2 and M.Afshar Alam3.
[4] A Survey on Improving the Efficiency of Different Web Structure Mining Algorithms-Preeti Chopra, Md. Ataullah-(IJEAT)Feb2013. [5] A Survey Paper on HyperlinkInduced Topic Search (HITS)
Algorithms for Web Mining- Mr.Ramesh Prajapati- (IJERT) April-2012.
[6] Web Content Mining Techniques-A Comprehensive Survey- Darshna Navadiya, Roshni Patel- (IJERT) December-2012. [7] Text Classification Using Data Mining-S. .Kamruzzaman,Farhana
Haider,Ahmed Ryadh Hasan-ICTM2005.
[8] [AR2003]. Ajit Abhraham, Vitorino Ramos, Web Usage Mining Using Artificial Ant Colony Clustering and Linear Genetic Programming, to appear in CEC´03 - Congress on Evolutionary Computation, IEEE Press, Canberra, Australia,8-12 Dec. 2003. [9] SZAS1997]. Cyrus Shahabi, Amir M. Zarkesh, Jafar Adibi, and
Vishal Shah, Knowledge Discovery from Users Web-page Navigation, IEEE RIDE 1997