Raman spectroscopy of methane (CH4 ) to
165 GPa : effect of structural changes on
Raman spectra
Proctor, JE, MaynardCasely, HE, Hakeem, MA and Cantiah, D
http://dx.doi.org/10.1002/jrs.5237
Title Raman spectroscopy of methane (CH4 ) to 165 GPa : effect of structural changes on Raman spectra
Authors Proctor, JE, MaynardCasely, HE, Hakeem, MA and Cantiah, D
Type Article
URL This version is available at: http://usir.salford.ac.uk/44132/ Published Date 2017
USIR is a digital collection of the research output of the University of Salford. Where copyright permits, full text material held in the repository is made freely available online and can be read, downloaded and copied for noncommercial private study or research purposes. Please check the manuscript for any further copyright restrictions.
Raman spectroscopy of methane (CH4) to 165 GPa: Effect of structural changes on Raman spectra
J.E. Proctor1,2*, H.E. Maynard-Casely3, M.A. Hakeem1, D. Cantiah1
1 Materials and Physics Research Group, School of Computing, Science and Engineering, University of Salford, Manchester M5 4WT, UK
2 Photon Science Institute and School of Electrical and Electronic Engineering, University of Manchester, Oxford Road, Manchester M13 9PL
3 Australian Centre for Neutron Sciences, Australian Nuclear Science and Technology Organisation, Locked Bag 2001, Kirrawee DC, NSW, 2232, Australia
* Corresponding author: [email protected]
We have conducted a Raman study of methane (CH4), a major constituent of the outer
planets, at pressures up to 165 GPa. We observe splitting of the principal Raman-active vibrational mode above 45 GPa, and a non-linear dependence of Raman peak position on pressure. A discontinuous change in the pressure derivative of the ν3 peak position is
observed at ca. 75 GPa, corresponding to the phase change previously observed using X-ray diffraction. The Grüneisen parameters for the principal Raman-active modes of methane in the simple cubic and high pressure cubic phases are calculated. The predicted dissociation of methane at ultra-high pressure to form C2H6 and H2 is not observed, but an additional
discontinuous change in the pressure-induced shift of the Raman peaks is observed at 110 GPa. We suggest this may be due to some reorientation or reordering of the methane molecules within the framework of the known cubic lattice.
Keywords: Methane, diamond anvil, Grüneisen parameter, planets, high pressure
1 Introduction
The properties of the methane (CH4) molecule are of fundamental scientific and technological
interest. It is proposed to be a major constituent of the outer planets Uranus and Neptune, where it makes up their dense molecular ‘hot-ice’ mantles along with water (H2O) and
ammonia (NH3). Under high pressure conditions methane exhibits a remarkable degree of
structural diversity with six different phases discovered to date[1], in addition to a number of low temperature phases[2]. Methane’s inclusion within the icy gas giants, Uranus and Neptune, could have significant effect on these planets’ thermal evolution, given the indication that at high pressure and high temperature it will decompose to diamond and hydrogen[3][4]. Methane is also a potential precursor molecule for heavier hydrocarbons in the earth’s mantle[5] and in fact is often found as a gas inclusion in rocks on earth[6].
hexagonally closed packed (hcp) arrangement at high-pressures[8]. However, to date this has not been observed.
At pressures up to 85 GPa, a number of studies[1][3][9][10][11] have explored the structural and optical properties of methane. Methane freezes at 1.35 GPa[12] at room temperature to the face centred cubic phase[13], phase I, the same structure as that obtained by cooling at ambient pressure to ≈ 91 K. At 5.4 GPa, methane phase I transforms to a rhombohedral structure, which has been designated methane A[10], which is itself a distortion of the cubic close packing of phase I. Upon further compression, a number of studies report a further phase transformation to a cubic phase. Reports of the pressure of this transition in the literature vary considerably, as does it’s naming, it is referred to both as methane B[14] and as a simple
cubic (SC)[1] phase (hereafter will be referred to as simple cubic (SC) for consistency with recent publications). Determination of the crystal structure of this phase[11] shows that it is also a complex variation on close packing and is, surprisingly isostructural to α-manganese. Optical studies on methane have focussed on the intense Raman-active vibrational modes of methane ν1 and ν3 occurring at around 3000 cm-1. These modes have been observed to split
upon pressure increase and the changes in lineshape have been attributed to the changes in crystal structure.
Whilst a number of studies have focussed on the properties of methane at modest high pressures and room temperature, at pressures above 86 GPa only three studies have been performed: one X-ray diffraction study[15], one Raman study[16] and one study of the optical
absorption and reflectivity[17]. Of this series the diffraction study, which obtained powder diffraction data to 208 GPa, made the most substantial conclusions on methane’s behaviour under high-pressure. Sun et al.[15] determined that the simple cubic phase (SC) of methane undergoes a transition between 69 and 94 GPa to a further high-pressure cubic structure, which they designated cHP to distinguish it from a previous designation of a Hexagonal Phase (HP), structure indicated by Bini et al.[8].
No study at high pressure and room temperature has reported any evidence that the methane molecule does not remain intact, despite theoretical works proposing that above 95 GPa the formation of ethane (C2H6), then other longer-chain hydrocarbons, becomes energetically
favourable[18]. This conclusion, however, had been drawn from simulations of the structure of methane optimised to be in hexagonal closed packed (hcp) layers, at moderate pressures, contrary to experimental evidence of complex cubic structures. To date, only one
experimental study which examined methane under high pressure (10 GPa) combined with high temperatures (2000 K) has reported any breakup of the methane molecule, in this case to diamond and hydrogen[3].
In this study we report a detailed Raman study of methane up to 165 GPa pressure. We observe signs of a new phase transition at ca. 110 GPa, obtain values for the Grüneisen parameters of the vibrational modes by combining our findings with recent equation of state data[15] but do not observe any evidence for a dissociation of the methane molecule.
A custom-constructed piston-cylinder DAC was equipped with 100 μm diameter bevelled diamond culets. A rhenium gasket was indented and a 60 μm diameter hole was drilled in the centre of the indent using a custom-constructed spark eroder apparatus. The gasket was replaced on the culet of the piston diamond and a small crystal of ruby was placed towards the side of the hole to enable pressure measurement using the ruby fluorescence method [19]. Methane was liquefied using liquid N2 and the DAC was closed whilst immersed in the liquid
methane. The DAC does not come into contact with liquid or gaseous N2 during this
procedure and the Raman-active vibron from N2 was not observed in our spectra.
Raman spectra were collected upon pressure increase to 165 GPa. Upon further pressure increase the diamonds broke. At each pressure, Raman spectra were collected using a conventional single grating spectrometer (Jobin Yvon) with 1200 lines per inch grating. The backscattering geometry was used with a 532 nm laser beam (spot size ca. 1 μm) and a 20x magnification objective lens (numerical aperture of 0.30). The spectral resolution of the spectrometer was 6.5 cm-1 (FWHM).
Pressures up to 66 GPa were measured using the ruby fluorescence method[19]. However,
after the ruby fluorescence peaks became too weak to utilize for pressure measurement the pressure was instead measured using the pressure-induced shift of the Raman peak from the stressed diamond anvil[20]. At 63 and 66 GPa pressure was measured using both methods and the measurements differed by less than 1.5 GPa at both pressures. At these pressures we have utilized the pressure measured using the diamond anvil Raman peak in our analysis.
For pressure measurement using ruby, the R1 (which was used for the pressure measurement)
and R2 ruby fluorescence peaks were fitted with Lorentzians. For pressure measurement
using the diamond anvil Raman gauge the derivative of the Raman signal from the stressed tip of the diamond anvil was fitted with a Lorentzian and the pressure was calculated from the peak position using the calibration in ref. [20].
The error in pressure measurement can be calculated from the error on the Lorentzian curve fits used to fit the ruby fluorescence and diamond Raman derivative peaks used to measure pressure. Error bars are omitted from the 𝑥 (pressure) axis of Figs. 3 and S2 (supporting information) due to the small size of the errors calculated using this method (average ±0.2 GPa). However, this measurement of the error does not account for all possible sources of error in the pressure measurement. In particular, it is likely that there is some variation of pressure throughout the sample chamber at the highest pressures studied as even a sample such as methane will become hard and able to support shear stress under these conditions. Thus the real error in the pressure measurement is hard to quantify accurately.
The Raman peaks originating from methane were fitted using Lorentzian peaks in Magicplot[21], after background subtraction.
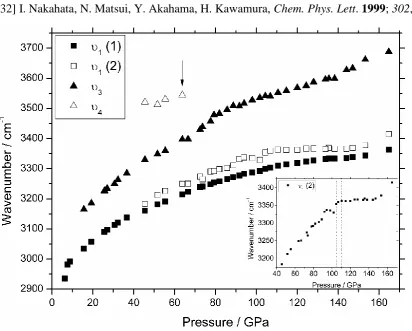
In Fig. 1 we show the plot of the ν1 and ν3 Raman peak positions as a function of pressure.
The principal changes we observe upon pressure increase are as follows. The ν3 Raman peak
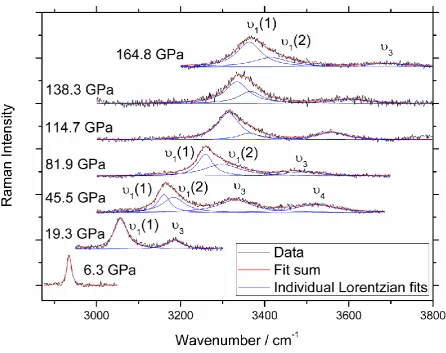
is not observed at the lowest pressure studied (6.2 GPa) but then appears and gradually increases in intensity as pressure is increased. By 15.5 GPa the intensity is adequate to fit. At 45.4 GPa onwards we observe splitting of the ν1 Raman peak into two separate
components. We fit two components to all spectra collected above 45 GPa. Fig. 2 shows example spectra and fits. Whilst the overlap between the two components of the ν1 Raman
peak is significant, it is visually clear that the peak is asymmetric, consisting of two strong components with different intensities. In the supplementary information a table is given of reduced RSS (residual sum of squares) values when the ν1 Raman peak is fitted with one, and
two, components. We observe significantly lower reduced RSS values when two components are used – an average reduction of 27%.
In addition, we observed a new peak at ca. 3530 cm-1, appearing only between 45 and 65 GPa. We label it as υ4. The spectrum collected at 45.5 GPa and shown in Fig. 2 is that in
which this additional peak is the most intense. In most spectra this peak was too weak to fit accurately so further analysis was not performed.
At 75 – 80 GPa we observe a sudden change in the pressure-induced shift of the υ3 mode,
which we attribute to the phase transition from the SC to cHP phase previously observed with X-ray diffraction[15]. At 105 – 110 GPa we observe a sudden change in the pressure-induced shift of the ν1 (2) mode (see inset to figure 1). This does not correspond to any previously
observed phase transition, and will be discussed further in the conclusions.
In principle, instead of the new component originating from the splitting of the methane vibron, this observation could indicate the decomposition of some methane molecules followed by the formation of larger hydrocarbon molecules such as C2H6 – as is expected
theoretically[18]. C2H6, in particular, exhibits Raman-active vibrons at similar energy to those
of methane (at least at ambient conditions)[22]. However, in this case we would expect to also observe the Raman-active vibron of H2 at ca. 4000 cm-1 (H2 has an even higher Raman
scattering cross section than methane[23]). We searched for the H2 vibron peak at regular
intervals during the experiment and did not observe it at any pressure. We therefore treat the additional components to the Raman peaks as originating from vibrations of the methane molecule.
Using the equation of state (EOS) data contained in ref.[1] for the simple cubic (SC) phase (from 15 GPa to 67 GPa) and in ref.[15] for the high pressure cubic (cHP) phase (from 79 GPa to 165 GPa), we are able to calculate the mode Grüneisen parameters for the ν1 (1), ν1 (2) and
ν3 modes where the Grüneisen parameter 𝛾𝑖 for vibration mode 𝑖 is defined as follows:
𝜔𝑖(𝑃)
𝜔𝑖(0)= [
𝑉(𝑃) 𝑉0 ]
−𝛾𝑖
(1)
The Grüneisen parameters were calculated by rearranging equation (1) into equation (2) and
performing a linear fit on a plot of ln[𝜔𝑖(𝑃)] against ln [ 𝑉(𝑃)
𝑉0 ], where 𝛾𝑖 and ln[𝜔𝑖(0)] are the
(supporting information) for the SC phase and Fig. 3 for the cHP phase. The specific equations of state used are shown in the supplementary material.
ln[𝜔𝑖(𝑃)] = −𝛾𝑖ln [𝑉(𝑃)
𝑉0 ] + ln[𝜔𝑖(0)] (2)
In the SC phase (figure S2, supporting information) the plots for all modes could be fitted reasonably well by a single linear fit (i.e. a constant value of 𝛾). In the cHP phase (Fig. 3) this was the case for the ν1 (1) and ν3 modes. For the ν1 (2) mode however, this was not the
case. We identified two separate regimes (80 – 110 GPa and 110 – 150 GPa) with very different values of 𝛾 (Fig. 3 middle panel) and some evidence of further change in 𝛾 at the very highest pressures studied. There is potentially a similar effect present with the ν1 (1)
mode but far weaker; we concluded that the evidence was not strong enough to justify stating that there is a sudden change in the Grüneisen parameter.
The Grüneisen parameters calculated for both phases are shown in table 1, along with the obtained values of 𝜔𝑖(0). The Grüneisen parameters presented here are significantly lower than those typically observed, due to the extremely high pressure applied in this study and its effect on the C-H bond.
Raman spectra of methane in the rhombohedral (A) and simple cubic (SC) phases have been presented in several studies[1][3][9]. Our findings are generally in agreement with these studies
(insofar as they are in agreement with each other, see supplementary material for further discussion on this point). However, to our knowledge Raman spectroscopy has been performed on methane above 78 GPa in only one study, ref.[16]. In this study the 𝜈1 and 𝜈3
Raman modes were studied from 34 to 208 GPa. The Raman shift was observed to depend linearly on pressure in the entire pressure range studied, with no discontinuous changes observed and no splitting of either mode observed. These findings cannot be reconciled with our own findings and are surprising in light of the EOS of methane now known to 202 GPa[15].
A Raman peak shift which is linear as a function of pressure over such a large pressure range is not what we observe (see Fig. 1 and supplementary material), and is not what is typically observed for other simple molecular solids over such a massive pressure range and spanning at least one phase transition. Furthermore, the Grüneisen parameter for each Raman mode can be calculated as a function of pressure using equation 1 and the EOS data from ref.[15]. This calculation, using the linear fit to the Raman data from ref.[16], indicates that the Grüneisen parameters for all modes change continuously by a factor of 3 between 34 GPa and 208 GPa, which would be a surprising result.
discrepancy between our findings and the findings of ref.[16] (see further discussion the supplementary material). The pressure scale from Akahama and Kawamura, which we have used, is now the widely accepted diamond anvil Raman pressure scale (for instance in refs.[25][26][27][28]).
4 Conclusions
We have reported the Raman spectra of methane at pressures up to 165 GPa at ambient temperature. We have observed a discontinuous change in the Raman spectra at ca. 75 GPa, corresponding to the phase transition from the SC to cHP phase previously reported in X-ray diffraction experiments[15].
Our findings cannot be reconciled with those of the only other study published on the Raman spectra of methane above 75 GPa[16]. We observe a splitting in the ν1 Raman peak
commencing at ca. 50 GPa and persisting to the highest pressure reached in our study, 165 GPa. The weaker, higher wavenumber component of this peak, the ν1 (2) component, has a
Grüneisen parameter which changes discontinuously at 110 GPa. Such a transition has not been observed in previous studies utilizing X-ray diffraction[15] or optical transmission /
reflectivity measurements[17]. We suggest that this transition is likely to be due to some rearrangement / reorientation of the methane molecules within the framework of the cubic lattice observed up to 202 GPa[15]. Such a transition may not be detected in an X-ray
diffraction experiment, which is relatively insensitive to the position of the hydrogen atoms, and could potentially not have a major effect on the optical transmission / reflectivity.
Physically, the reduction in the Grüneisen parameter of the ν1 (2) mode at 110 GPa (from 0.2
to 0.02) corresponds to a weakening in the pressure-induced stiffening of this particular phonon mode. As shown in Fig. 1, the ν1 (2) peak shifts very little with increasing pressure
above 110 GPa. We speculate that this could be a precursor to the Raman peak position shifting to lower energy with increasing pressure at higher pressures. This behaviour is observed in H2 due to the weakening of the H-H bond pending the transition to the expected
monatomic metallic state, and is observed in SiH4 pending the transition to an amorphous
state[29].
However, we do not observe any evidence for the theoretically predicted[18] breakup of the methane molecule to form diamond and/or C2H6 occurring in the pressure range studied in
our work. In this case, we would expect molecular H2 to be formed also, and the H2 vibron
was not observed at any pressure.
5 Acknowledgements
We would like to acknowledge the assistance of technical support staff at the University of Hull (Nigel Parkin) for construction of the diamond anvil high pressure cell used in these investigations, and would like to thank the anonymous referee for pointing out a mistake in our calculations. MAH would like to acknowledge a doctoral scholarship received from the University of Salford.
[1] H. Hirai, K. Konagai, T. Kawamura, Y. Yamamoto, T. Yagi, Chem. Phys. Lett. 2008; 454, 212.
[2] E. Gregoryanz, M. J. Clouter, N. H. Rich, R. Goulding, Phys. Rev. B 1998; 58, 2497. [3] L. R. Benedetti, J. H. Nguyen, W. A. Caldwell, H. Liu, M. Kruger, R. Jeanloz, Science 1999; 286, 100.
[4] H. Hirai, K. Konagai, T. Kawamura, Y. Yamamoto, T. Yagi, Physics of the Earth and Planetary Interiors 2009; 174, 242.
[5] A. Kolesnikov, V. G. Kutcherov, A. F. Goncharov, Nature Geo. 2009; 2, 566. [6] J. Zhang, S. Qiao, W. Lu, Q. Hu, S. Chen, Y. Liu, J. Geochem. Exp. 2016; 171, 20. [7] D. A. Young, Phase diagrams of the elements, Univ. California Press, Berkeley, 1991. [8] R. Bini, G. Pratesi, Phys. Rev. B 1997; 55, 14800.
[9] P. Hebert, A. Polian, P. Loubeyre, R. Le Toullec, Phys. Rev. B 1987; 36, 9196.
[10] H. E. Maynard-Casely, C. L. Bull, M. Guthrie, I. Loa, M. I. McMahon, E. Gregoryanz, R. J. Nelmes, J. S. Loveday, J. Chem. Phys. 2010; 133, 064504.
[11] H. E. Maynard-Casely, L. F. Lundegaard, I. Loa, M. I. McMahon, E. Gregoryanz, R. J. Nelmes, J. S. Loveday, J. Chem. Phys. 2014; 141, 234313.
[12] E. H. Abramson, High Press. Res. 2011; 31, 549.
[13] R. M. Hazen, H. K. Mao, L. W. Finger, P. M. Bell, Appl. Phys. Lett. 1980; 37, 288 [14] R. Bini, L. Ulivi, H. J. Jodi, P. R. Salvi, J. Chem. Phys. 1995; 103, 1353.
[15] L. Sun, W. Yi, L. Wang, J. Shu, S. Sinogeikin, Y. Meng, G. Shen, L. Bai, Y. Li, J. Liu, H. K. Mao, W. L. Mao, Chem. Phys. Lett. 2009; 473, 72.
[16] L. Sun, Z. Zhao, A. L. Ruoff, C. S. Zha, G. Stupian, J. Phys. Cond. Mat. 2007; 19, 425206.
[17] L. Sun, A. L. Ruoff, C. S. Zha, G. Stupian, J. Phys. Chem. Sol. 2006; 67, 2603.
[18] G. Gao, A. R. Oganov, Y. Ma, H. Wang, P. Li, Y. Li, T. Iitaka, G. Zou, J. Chem. Phys. 2010; 133, 144508.
[19] A. Dewaele, M. Torrent, P. Loubeyre, M. Mezouar, Phys. Rev. B 2008; 78, 104102. [20] Y. Akahama, H. Kawamura, J. Appl. Phys. 2006; 100, 043516.
[21] www.magicplot.com
[23] J. J. Ottusch, D. A. Rockwell, IEEE J. Quantum Elec. 1988; 24, 2076. [24] L. Sun, A.L. Ruoff, G. Stupian, Appl. Phys. Lett. 2005; 86, 014103.
[25] Z. H. Chi, X. M. Zhao, H. Zhang, A. F. Goncharov, S. S. Lobanov, T. Kagayama, M. Sakata, X. J. Chen, Phys. Rev. Lett. 2014; 113, 036802.
[26] V. Dzyabura, M. Zaghoo, I. F. Silvera, PNAS 2013; 110, 8040.
[27] P. Dalladay-Simpson, R. T. Howie, E. Gregoryanz, Nature 2016; 529, 63.
[28] R. Nomura, K. Hirose, K. Uesugi, Y. Ohishi, A. Tsuchiyama, A. Miyake, Y. Ueno, Science 2014; 343, 522.
[29] M. Hanfland, J. E. Proctor, C. L. Guillaume, O. Degtyareva, E. Gregoryanz. Phys. Rev. Lett. 2011; 106, 095503.
[30] Y. H. Wu, S. Sasaki, H. Shimizu, J. Raman Spec. 1995; 26, 963.
[31] S. Umemoto, T. Yoshii, Y. Akahama, H. Kawamura, J. Phys.: Cond. Mat. 2002; 14, 10675.
[image:9.595.76.489.367.698.2][32] I. Nakahata, N. Matsui, Y. Akahama, H. Kawamura, Chem. Phys. Lett. 1999; 302, 359.
Figure 1. Raman peak position as a function of pressure for the principal Raman-active vibrational modes of methane. At 45 GPa we observe the splitting of the ν1 mode into two
at 110 GPa we observe a discontinuous change in the behaviour of the ν1 (2) mode. Arrow
marks lowest pressure at which diamond Raman peak was used for pressure measurement. Inset shows the υ1 (2) mode only with the 105 – 110 GPa region in which the discontinuous
change is observed marked with the vertical dotted lines.
[image:10.595.75.522.140.493.2]Figure 3. Plots of ln 𝜔 against ln [𝑉(𝑃)
𝑉0 ] for methane in the cHP phase (79 – 165 GPa). (a) ν1
(1) Raman mode. (b) ν1 (2) Raman mode. (c) ν3 Raman mode.
Raman peak 𝜈1(1) 𝜈1(2) 𝜈3
Phase 𝛾 𝜔(0)
(cm-1) 𝛾
𝜔(0)
(cm-1) 𝛾
𝜔(0)
(cm-1)
SC 0.164(2) 2870(3) 0.20(2) 2835(33) 0.204(3) 2944(6) cHP (up to 70 GPa)
0.139(4) 2960(10)
0.22(3) 2829(55)
0.240(9) 2941(21) cHP (79 GPa
[image:12.595.69.501.148.265.2]onwards) 0.020(5) 3311(15)
Supplementary material 1. Curve fitting
At pressures of 45 GPa and above, it was found necessary to fit the ν1 vibron peak with two
separate Lorentzians; the peak became visibly asymmetric with a pronounced shoulder on the high wavenumber side. Example spectra demonstrating this point are shown in Fig. 2 of the main text. At pressures of 45 GPa and above, we therefore fitted two Lorentzians to the ν1
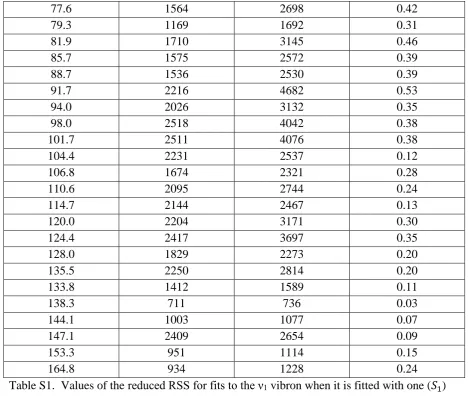
vibron peak. In table S1 below, we show the reduced RSS (𝑆, residual sum of squares) for the fits to the ν1 vibron peak with one Lorentzian (𝑆1) and two Lorentzians (𝑆2). For most
data points the decrease in the reduced RSS achieved by fitting with two peaks was substantial, on average 27%.
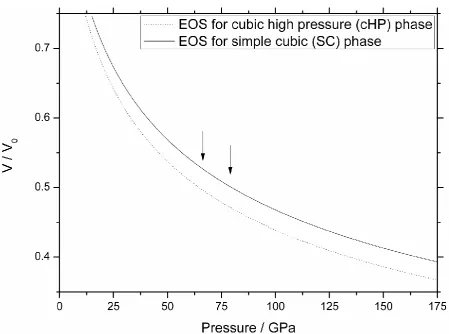
2. Equations of state
In ref.[15] pressure-volume curves obtained using X-ray diffraction in that study and references therein are fitted using Birch-Murnaghan Equations of state:
𝑃 =3
2𝐵0[( 𝑉 𝑉0)
−73
− (𝑉
𝑉0)
−53
]
For the simple cubic (SC) phase (fitted to data collected from 17 – 85 GPa in ref.[1]) 𝐵0 = 23.1 GPa and for the cubic high pressure (cHP) phase (fitted to data collected from 94 – 202 GPa in ref.[15]) 𝐵0 = 28.5 GPa. Fig. S1 shows both equations of state, with a label denoting the pressure at which we began using the cHP equation of state in the calculations described in the main text.
In our work, we associate a sudden change in the pressure-induced shift of the υ3 Raman
mode with the transition from the SC phase to the cHP phase. This change begins at 67 GPa and is completed by 79 GPa. We therefore use the EOS for the SC phase in calculation of Grüneisen parameters using data up to 67 GPa, and use the EOS for the cHP phase in the calculation of Grüneisen parameters using data collected above 79 GPa. In the range 67 GPa – 79 GPa 3 data points are not utilized in the calculation of the Grüneisen parameters due to the likelihood that the phase transition is in progress.
3. Fitting of Grüneisen parameters
Figure S2 is a plot of ln[𝜔𝑖(𝑃)] against ln [𝑉(𝑃)
𝑉0 ] for the the ν1 (1), ν1 (2) and ν3 modes
4. Comparison to previous studies 4.1 Spectral shifts and lineshape
A number of previous studies (refs.[1][3][9][30]) have presented Raman spectra of methane at modest high pressures up to 78 GPa. Whilst the general trends observed are the same there are some differences in the details of the presented spectra in the different studies. Ref.[9]
observed the ν3 peak appearing at 6.2 GPa upon pressure increase, in ref.[1] the peak does not
appear with significant intensity until 14.7 GPa. In ref.[30] the peak is present even in the fluid phase at 0.64 GPa, but with negligible intensity all the way up to the highest pressure datapoint at 18.1 GPa. Ref.[3] shows a single spectrum of unreacted methane at 19 GPa, in agreement with our spectrum in figure 2 at 19.3 GPa.
The reported lineshape of the ν1 and ν3 peaks also varies between different studies. At 20
GPa, refs.[1][9] report 3 components to the ν1 peak whilst ref.[30] reports 2 components and
ref.[3] appears to show just one component. The ν3 peak at 20 GPa has 3 components in
refs.[1][9], one component in refs.[9][30]. In some cases, however, few actual spectra are shown so it is difficult to evaluate the extent to which the differences in the number of reported components to the peaks is due to differences in the actual lineshape and the extent to which they are due to the preferences of different authors on how many peaks to fit.
In this work we did not study phases I and A in detail due to the existence of several other studies of these phases dating back 30 years. However, we observe the ν3 peak appearing
with significant intensity in the data collected at 15.6 GPa onwards, in agreement with ref.[1].
Up to 45 GPa we observe a single component to the ν1 peak, in agreement with ref.[3]. We
also observe a single component to the ν3 peak, in agreement with refs.[3][30].
The discrepancies existing in some cases between different studies may be due to the sluggish nature of the phase transitions involved – ref.[9], for instance, observed that the weaker low-energy component of the ν1 peak at 12.4 GPa becomes significantly more intense after the
sample is left for 2 hours.
The objective of this study was to examine the Raman spectra of methane at extremely high pressures so at 30 GPa the sample was left overnight to allow any sluggish phase transition that may exist to take place. Overnight the Raman peaks shifted to slightly higher
wavenumber due to a small pressure increase but there was no qualitative change in the spectrum observed.
At ultra-high pressure only 2 Raman studies are performed – ref.[1] to 85 GPa and ref.[16] to 208 GPa. We observe significantly fewer components to the ν1 and ν3 peaks than ref.[1]. On
the other hand, our spectra look extremely similar to those shown in ref.[16], despite the decision of those authors to fit with fewer components than ourselves.
Where our study disagrees with ref.[16], however, is in the reported shift in the Raman peaks
as a function of pressure. In ref.[16], the ν1 and ν3 vibron peak positions were observed to shift
functions which fitted well to the data in ref.[16], in the pressure range covered by both studies (35 – 165 GPa). The use of a different pressure scale in ref.[16] discussed in the main text can explain the discrepancy in peak position between the two studies - the peak positions we observe at 160 GPa are close to those observed in ref.[16] at 140 GPa and this is what we expect given the difference between the pressure scales used. However – clearly – it cannot explain our observation of a discontinuity at 110 GPa which is not observed in ref.[16]. Figure S3 also compares our findings to the linear functions fitted in ref.[9] to different components of the ν1 and ν3 peaks in the pressure range of that study (up to 20 GPa). Whilst
ref.[9] fits more components than our study, the general trend in peak position as a function of
pressure is identical to our findings within error.
4.2 Calculation of Grüneisen parameters
Using the methodology outlined in the main manuscript it is possible to calculate the mode Grüneisen parameters for the components of the ν1 and ν3 peaks using the fits to the data in
Hebert et al. (ref.[9]), and the detailed EOS data now available for methane.
For phase I, the fits can be combined with the EOS data from ref.[13] (simple Murnaghan
EOS, 𝐵0 = 4.9 GPa). For phase A we use the EOS data from ref.[32] (Birch-Murnaghan EOS,
𝐵0 = 7.9 GPa) and for the SC phase the EOS data from ref.[15] (Birch-Murnaghan EOS, 𝐵0 =
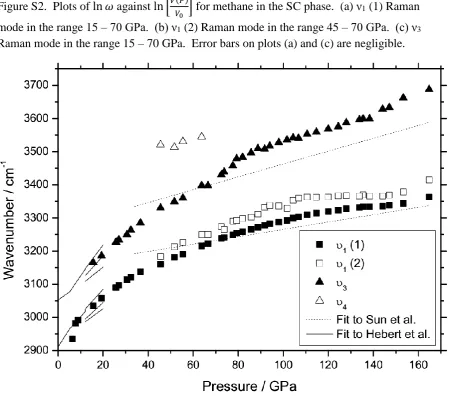
Figure S2. Plots of ln 𝜔 against ln [𝑉(𝑃)
𝑉0 ] for methane in the SC phase. (a) ν1 (1) Raman
mode in the range 15 – 70 GPa. (b) ν1 (2) Raman mode in the range 45 – 70 GPa. (c) ν3
[image:18.595.68.530.598.757.2]Raman mode in the range 15 – 70 GPa. Error bars on plots (a) and (c) are negligible.
Figure S3. Comparison of our own experimental data (c.f. figure 1) with the results of previous studies. Dotted lines show the pressure dependence of the ν1 and ν3 vibron peak
positions found in ref.[16], for the pressure range 35 – 165 GPa and the solid lines show the pressure dependence of the ν1 and ν3 vibron peak positions found in ref.[9], for the pressure
range 0 – 20 GPa.
Pressure (GPa) 𝑆2 𝑆1 Fractional reduction
in RSS: 𝑆2−𝑆1 𝑆1
45.5 2507 2938 0.15
51.6 1881 2290 0.18
55.5 3291 4170 0.21
63.8 2249 3555 0.37
66.6 2397 3280 0.27
72.5 1894 3269 0.42
77.6 1564 2698 0.42
79.3 1169 1692 0.31
81.9 1710 3145 0.46
85.7 1575 2572 0.39
88.7 1536 2530 0.39
91.7 2216 4682 0.53
94.0 2026 3132 0.35
98.0 2518 4042 0.38
101.7 2511 4076 0.38
104.4 2231 2537 0.12
106.8 1674 2321 0.28
110.6 2095 2744 0.24
114.7 2144 2467 0.13
120.0 2204 3171 0.30
124.4 2417 3697 0.35
128.0 1829 2273 0.20
135.5 2250 2814 0.20
133.8 1412 1589 0.11
138.3 711 736 0.03
144.1 1003 1077 0.07
147.1 2409 2654 0.09
153.3 951 1114 0.15
[image:19.595.63.532.71.467.2]164.8 934 1228 0.24
Table S1. Values of the reduced RSS for fits to the ν1 vibron when it is fitted with one (𝑆1)
and two (𝑆2) Lorentzians, and the fractional reduction in the reduced RSS achieved by fitting with two Lorentzians instead of one.
Phase I (data
from Refs.[9][13])
Phase A (data
from refs.[9][32])
SC phase (data
from refs. [9][15])
SC phase (data
from this study
and ref.[15])
ν1 (a) 0.06 0.08 0.19 0.16
ν1 (b) 0.16 0.20
ν1 (c) 0.12
ν3 (a) 0.025 0.11 0.22 0.204
ν3 (b) 0.19
Table S2. Values of mode Grüneisen parameters obtained from analysis of Raman data in ref.[9] for
phase I, phase A and the SC phase. Grüneisen parameters obtained from our own analysis of the SC