MRI brain scan classification using novel
3D statistical features
Hasan, A, Meziane, F, Aspin, R and Jalab, HA
Title
MRI brain scan classification using novel 3D statistical features
Authors
Hasan, A, Meziane, F, Aspin, R and Jalab, HA
Type
Conference or Workshop Item
URL
This version is available at: http://usir.salford.ac.uk/id/eprint/43758/
Published Date
2017
USIR is a digital collection of the research output of the University of Salford. Where copyright
permits, full text material held in the repository is made freely available online and can be read,
downloaded and copied for noncommercial private study or research purposes. Please check the
manuscript for any further copyright restrictions.
MRI Brain Scan Classification Using Novel 3-D Statistical
Features
Ali M. Hasan
Al-Nahrain University, College of Medicine, Baghdad, Iraq. School of Computing, Science and
Engineering, University of Salford, Manchester,
UK.
[email protected].
Farid Meziane and Rob Aspin
School of Computing, Science and Engineering, University of Salford,
Manchester, UK.
[email protected],
[email protected].
Hamid A. Jalab
Faculty of Computer Science and Information Technology. University of Malaya, 50603 Kuala
Lumpur, Malaysia.
[email protected]
ABSTRACT
The paper presents an automated algorithm for detecting and classifying magnetic resonance brain slices into normal and abnormal based on a novel three-dimensional modified grey level co-occurrence matrix approach that is used for extracting texture features from MRI brain scans. This approach is used to analyze and measure asymmetry between the two brain hemispheres, based on the prior-knowledge that the two hemispheres of a healthy brain have approximately a bilateral symmetry. The experimental results demonstrate the efficacy of our proposed algorithm in detecting brain abnormalities with high accuracy and low computational time. The dataset used in the experiment comprises 165 patients with 88 having different brain abnormalities whilst the remaining do not exhibit any detectable pathology. The algorithm was tested using a ten-fold cross-validation technique with 10 repetitions to avoid the result depending on the sample order. The maximum accuracy achieved for the brain tumors detection was 93.3% using a Multi-Layer Perceptron Neural Network.
CCS Concepts
• Artificial intelligence ➝ Image segmentation
Keywords
Magnetic resonance imaging; Modified Grey Level Co-occurrence Matrix; Multi-layer perceptron Neural Network; Support Vector Machine; Linear Discriminant Analysis.
1.
INTRODUCTION
Medical image analysis is a rewarding field for investigating, developing and applying methods of image processing, computer vision and pattern recognition. Medical images are different from other images, as they show distributions of various physical features measured from the human body, and attributes that are not otherwise accessible [1]. The role of image processing in medicine has been expanded with the progress of medical imaging technologies. Many of these technologies show a projection of the 3D human body onto a 2D plane and slice images in such a way that the slices may be stacked to create a volume model. Diagnostic imaging is an invaluable tool in medicine today. Standard medical imaging techniques include ultrasonography (US), computed tomography (CT) and magnetic resonance imaging (MRI). MRI is a popular imaging technique because it provides more detailed information about tumor types, position and size. Image processing has now been embedded in medical systems and applications and is used widely in medicine from diagnosis to therapy. Brain tumors are different from other neoplasms such as lung and breast, because
they are complicated pathologically, difficult to diagnose and considered to have a high morbidity and require special studies [2]. Brain tumors and stroke lesions in particular are crucial cases in medical imaging as their accurate detection and segmentation have a significant influence on clinical diagnosis. They also help in predicting prognosis and treatment in addition to being beneficial for the general modelling of the brain’s pathologies and its anatomical construction [3].
In current clinical routines, most of the clinicians’ time is spent on data examination and interpreting medical images. Therefore, it is desirable to have a high level of experience to carry out manual and accurate segmentation and classification of these images in order to achieve the final diagnosis. However, due to the large number of slices which are produced by medical scanners, the manual detection of tumors is considered to be very cumbersome, a time consuming task and prone to human errors. They are evaluated either based on qualitative criteria by observing hyper intense tissue appearance or by depending on primitive quantitative measures such as the largest diameter visible from the axial viewing [4, 5]. The main objective of this study is to compare and evaluate the results reported in an early study by the authors [6] with the current results using three-dimensional feature extraction method in terms of accuracy and computational complexity. The proposed method is used to extract the texture features that are used to discriminate normal and pathological patients without any clinician’s interception; hence reducing clinicians’ examination and interpretation time. The remainder of the paper is organized as follows, in Section 2, we review some related work and introduce the contribution of this research. In Section 3, material and methods are described. In sections 4 and 5 we demonstrate how the features are extracted and classified respectively. The experimental results are discussed in Section 6. Finally, the conclusions are drawn in Section 7.
2.
RELATED WORK
automated algorithm to classify the MRI brain tumors into normal, benign and malignant. Beura, et al. [9] used these texture features to classify the breast tissues into normal, benign and malignant tumors by using mammogram images and the significance of the features were measured by using the F-statistic method. Pantelis [10] combined three methods for texture feature extraction; GLCM, first order statistical method and grey level run length matrix (GLRLM) to discriminate the normality and abnormality of MRI brain scanning images. SVM was used to classify a dataset of 67 patients which included T1-w with contrast enhancement of MRI brain scans, and the achieved accuracy was 93%. Gomez, et al. [11] proposed an automated system to classify breast lesions in ultrasound images by using the GLCM method. Linear discriminant analysis (LDA) was used to classify the extracted features and the maximum acceptable classification rate was 87%. Qinggang, et al. [12] combined in their algorithm two texture features extraction methods; Gabor filter and GLCM methods in addition to principle component analysis (PCA) that was used to optimize the extracted features. Lahmiri and Boukadoum [13] developed a new methodology for automatic features extraction from biomedical images to discriminate the normality from the abnormality. The authors exploited the spatial orientation of high frequency textural features of the given images by applying the 2D DWT, then a Gabor filter bank was applied on the high frequency sub-band at different frequencies and orientations. The classification was performed using SVM, such that, 86%, 68% and 50% were the maximum classification accuracy of T2-w MRI brain images, mammograms and retina respectively. Similarly, Sachdeva, et al. [14] used five techniques for texture features extraction to classify the MRI brain tumors into multiclass. These five techniques were Laplacian of Gaussian (LoG), GLCM, rotation invariant local binary patterns (RILBP), intensity-based features (IBF), and directional Gabor texture features (DGTF). Finally, these features were classified by artificial neural network (ANN) after implementing PCA for data reduction. The overall classification accuracy achieved was 91% to classify a dataset of 428 T1c-w MRI brain scanning images. Nabizadeh and Kubat [15] proposed a fully automatic system which was able to detect slices that included tumor and to delineate the tumor area in addition to segmenting it. Five effective texture-based statistical feature extraction methods have been used; first order statistical features, GLCM, GLRLM, histogram of oriented gradient (HOG) and local binary pattern (LBP). A PCA was used for feature reduction. 97.4% accuracy was achieved for identifying the brain tumors using SVM. T1-w and FLAIR MRI images of 25 pathological patients were used in this study. Saritha, et al. [16] and Kalbkhani, et al. [17] used wavelet features for analyzing the MRI brain images. The majority of the proposed anatomical feature extraction techniques utilize two-dimensional (2D) texture analysis, and the 2D approaches have some difficulties especially when the major axis of the desired object is not perpendicular to the image plane or when there is a degree of skewness [18]. Although the 2D approaches are relatively fast, they might lose relevant information present in neighboring slices of MRI, contribute to obtain high dimensional feature vector because they might lose relevant information present in neighboring slices of MRI, contribute to obtain high dimensional feature vector because they aggregate feature from multiple slices are used for implementing 2D approaches. We address the above-mentioned shortcoming by proposing a new algorithm that is used to extract texture features from MRI brain scans in a three-dimensional (3D). In addition, we compare the results of this study with the 2D approach developed in [6].
3.
MATERIAL AND METHODS
The main objective of this research is to investigate the use of texture features that are extracted from volumetric data of MRI for distinguishing the normality and abnormality of MRI brain scans. The overall flow chart of the proposed algorithm was explained in details in [6]. It starts with the data collection phase from the Iraqi hospital. A set of algorithms in the pre-processing stage are implemented and they are followed by a features extraction algorithms by the proposed a three-dimensional modified grey level co-occurrence matrix (3DMGLCM), and finalized by the classification.
3.1
Data Collection
The same data set of MRI brain scans that was used in [6], is used in this study. The dataset was collected from one of Iraqi hospital, and includes 165 patients, they were collected from two different scanners. 88 patients have pathological brain scanning and 77 patients have normal brain scanning.
3.2
Image Preprocessing
Image pre-processing is an important step and associates with preparing the MRI brain scanning images for the main processing tasks of this project. Typically, it includes image resizing, image enhancement, standardizing intensity range, MSP detection and correction, and aligning the MRI slices into the same spatial location. These algorithms were developed and explained in details in [6, 19].
4.
Proposed Feature Extraction Method
The fundamental objective of any diagnostic medical imaging investigation is tissue characterization. The texture analysis is an important way of providing unique information on the texture, or spatial variation of pixels from medical images [3]. Texture analysis methods are useful for studying and discriminating between pathologically different regions on medical images because it provides better performance than human eyesight in discriminating certain classes of texture. Practically it requires careful consideration of the significance of the individual features to achieve high discrimination by reducing the effect of heavily correlated features, and the features with little discriminatory power [20]. The choice of appropriate features depends on the particular image and the application and they should be reliable such that the features of the same class should have similar values, uncorrelated in order to avoid the wasteful in computation [21], and they should be extracted in a reliable way [22, 23]. In this study, we concentrate on textural feature because there are no specific size and organized shapes of the brain tumors in addition it may appear in different image intensities [24]. The texture features will be extracted from MRI brain slices to encode clinically valuable information by the proposed modified grey level co-occurrence matrix (3DMGLCM) method that will be used to measure statistically the similarity between the two separated volumetric hemispheres of the brain. Initially, prior pre-processing algorithms that should be taken to prepare the MRI brain slices for texture features extraction by 3DMGLCM are explained in details in details in next sections [6].
4.1
Three-Dimensional Modified Grey Level
Co-occurrence Matrix 3DMGLCM Algorithm
calculate textural features. These features are extracted from volumetric data of MRI brain scans and used to measure statistically the degree of symmetry between the two hemispheres of the brain. It is a second order statistical method and used to generate texture features of MRI brain scans by computing a spatial relationship of the joint frequencies of all pairwise combinations of grey levels configuration of each pixel in the left hemisphere of the brain, which is considered as a reference pixel, with one of the nine opposite pixels in the right hemisphere according to the nine offsets. These nine pixels are distributed among three opposite successive slices according to the nine offsets θ= (45,45), (0,45), (315,45), (45,0), (0,0), (315,0), (45,315), (0,315), (315,315), and one distance d=1. Figure 1 shows how the joint frequencies of all pairwise combinations of grey levels configuration of reference pixel in slice z with nine opposite pixels which are distributed over slices z+1, z, and z-1. Consequently, because each pixel on the left hemisphere has nine opposite pixels on the right hemisphere, nine co-occurrence matrices were obtained for each MRI brain scanning image. Thereafter, each co-occurrence matrix is normalized by the sum of all its elements to calculate the co-occurrence relative frequency between the grey levels of joint pixels in the brain hemispheres. The nine co-occurrence matrices are defined using Eq. 1.
(1) Where L and R denote the left and right volumetric hemispheres respectively, both of them have size of (512×256×z) pixels.
Where for slice z
If θ1=0 and θ2=0 then ∆x=0 and ∆y=0 and ∆z=0, If θ1=0 and θ2=45
then ∆x=-1 and ∆y=0 and ∆z=0, If θ1=0 and θ2=315 then ∆x=1 and
∆y=0 and ∆z=0.
z represents the number of MRI slices of scan. P is the resultant co-occurrence matrix. ∆x, ∆y, and ∆z are changed upon the directions of measured matrix.
For slice z+1
If θ1=45 and θ2=0 then ∆x=0 and ∆y=0 and ∆z=1, If θ1=45 and
θ2=45 then ∆x=-1 and ∆y=0 and ∆z=1, If θ1=45 and θ2=315 then
∆x=1 and ∆y=0 and ∆z=1. For slice z-1
If θ1=315 and θ2=45 then ∆x=-1 and ∆y=0 and ∆z=-1, If θ1=315
and θ2=315 then ∆x=1 and ∆y=0 and ∆z=-1, If θ1=315 and θ2=0
then ∆x=0 and ∆y=0 and ∆z=-1.
The resultant co-occurrence matrices are approximately symmetric around the forward diagonal for patients who have healthy brain, and asymmetrical for pathological patients.
Figure 2 shows two examples of abnormal and normal MRI brain scanning and corresponding co-occurrence matrix at θ1=0 and θ2=0.
On the left, the MRI scans of two patients who have pathological and normal brain scanning respectively. On the right, the corresponding co-occurrence matrices of those patients. The computing time for implementing 3DMGLCM for the patient who has 10 MRI slices is about 80 min by using an HP Workstation Z820 with Xeon E5-3.8GHz (Quad-Core), and 16GB of RAM. That means, each slice is required 1.53 min to determine its co-occurrence matrix.
Finally, 21 occurrence statistics are extracted from each co-occurrence matrix. These feature were used to measure statistically the degree of symmetry between the two volumetric hemispheres of the brain [6].
4.2
Feature Aggregation
Due to the proposed 3DMGLCM method determining nine co-occurrence matrices for all MRI slices of each patient, there are 21 descriptors that are determined for each co-occurrence matrix. This mean that, there are 189 descriptors for each MRI brain scan in addition to the cross correlation descriptor that is determined for volumetric MRI brain slices. Consequently, there are 190 descriptors for each MRI brain scan.
4.3
Preparing the Extracted Features for
Classification
[image:4.612.321.563.222.412.2]There are some preprocessing steps that should be performed to prepare the extracted features for classification as they help in improving the accuracy, efficiency and scalability of the classification process [25]. Features transformation is the process of transforming all extracted features by normalization, into new forms that are more appropriate for the classification process to prevent features with large ranges outweighing those with smaller ones. In this study, the min-max normalization method is used to perform a linear transformation on the extracted features whilst preserving the relationships between the original features [25].
Figure 1. Relation between a reference pixel with its opposite nine pixels.
Figure 2. A) MRI normal brain scanning image, B) MRI abnormal brain scanning image, C) MGLCM of normal brain
[image:4.612.60.285.379.480.2]Relevance Analysis is the process of identifying and removing irrelevant and redundant features that do not contribute to the classification process. It is also used to reduce computational complexity by transforming high-dimensional data into a meaningful representation of a reduced one. It also contributes to improving the training of the classifier to be faster, more effective and more accurate [26, 27]. A redundant feature is defined as one that it is highly correlated with one or more of the other features, provided both of them are relevant, while the irrelevant predictor can be removed without affecting the classification performance. In this study, stepwise analysis of variance ANOVA [6] is used to measure the significance and relevance of features, it is used to measure the significance of predictors which are extracted by 3DMGLCM. In order to eliminate the features that have small significance as well as minimize the redundancy between features, the F-statistic will be threshold by different threshold values. Such that, the number of features is shrunk when increasing the threshold values. The optimal threshold value is chosen based on examining the classification accuracy of the three classifiers that are used in this study.
4.4
Feature Normalization
All extracted features are normalized by using min-max normalization approach due to the significant variation between the extracted features that makes some predictors that have great values influence more than other predictors with small values on the behavior of the classifier [6, 28].
5.
Classification
Classification is the process of sorting objects in an image into separated classes and represents the final step of image processing. Three classifiers are applied and the results are compared. These classifiers are Linear Discriminant Analysis (LDA), Support Vector Machine (SVM), and Multi-Layer Perceptron Neural Network (MLP). Training samples are randomly selected and a 10-folded cross-validation is used to validate the robustness of our proposed system. Cross-validation also helps to prevent overfitting.
6.
Experimental Results
To evaluate the proposed algorithms of this study a set of examples will be implemented using these algorithms.
6.1
Classification Results
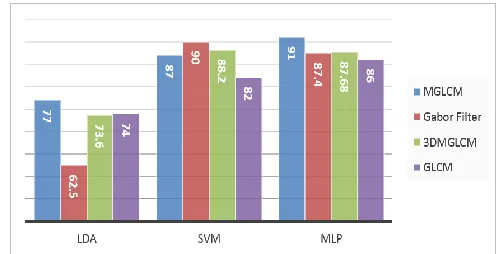
As mentioned earlier, 190 features were extracted for each image using the 3DMGLCM method. The highest classification accuracy was 88.2% achieved by SVM. The performance of 3DMGLCM method was compared with the achieved results of MGLCM method that was described in [6]. Similarly, the same co-occurrence statistics which were used in this study were computed using the traditional grey level co-occurrence matrix (GLCM) method in order to demonstrate a comparison between these two methods. Four co-occurrence matrices with four orientations (0o, 45o, 90o and
135o) and distance 1 were computed. The maximum classification
accuracy was achieved by MLP at 86%, followed by 82% for SVM and the LDA classifier achieved 74%. Additionally, the performance of the features which were extracted by 3DMGLCM was compared with the Gabor wavelet features that were applied with five different scales and eight orientations using a window size of (33×33). The length of the Gabor feature vector was 655360. The
achieved classification accuracy by the three classifiers was 90% for SVM, 62.5% for LDA and 87.4% for MLP. Figure 3 shows that there is a superiority in classification accuracies of MGLCM than LDA and MLP, while, 3DMGLCM outweighed GLCM when using SVM and MLP classifiers. After implementing the stepwise analysis of variance ANOVA method for relevance analysis, in this study the critical value α is set to 0.001 in order to get highly significant features. The assessment of the features will depend on both F-statistic value and p-value, as it is not enough that a predictor has a p-value that is less than 0.001 but it should also have a high F-statistic value.
[image:5.612.315.567.198.325.2]In order to eliminate the features that have small significance as well as minimize the redundancy between features, the F-statistic will be threshold by different threshold values. Different F-statistic threshold values are tested at each run (see Table 1). It is noted that the classification accuracies of the three classifiers have improved and reached the maximum value when the F-statistic threshold value is set to 0, and the best performance of MLP, SVM, and LDA were 93.3%, 88.2% and 76.8% respectively (see Figure 4). The transfer function that was used in the MLP network was the tangent function as well as the scaled conjugate gradient method (trainscg) that is suggested by MATLAB was used to update the weights and bias values.
Table 1. The result of using different F-statistic threshold values on the classification accuracy.
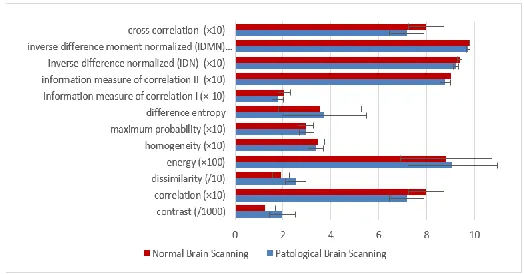
The average performance of the MLP network was 93.3% and sensitivity and specificity rates were 94.1% and 92.8% respectively. Consequently, the number of predictors in the feature vector is reduced from 190 to 100 predictors with 90 predictors discarded and considered as irrelevant or redundant features. Eleven relevant and significant features for each angle of the 3DMGLCM are chosen by the ANOVA method namely: contrast,
F-statistic threshold value
No. of selected predictors
LDA Accuracy
SVM Accuracy
MLP Size of hidden layer
Accuracy 0 100 76.8% 88.2% 100 93.3% 30 91 77.3% 88.2% 50 91.8% 200 73 61.2% 89.3% 60 87.2%
correlation, dissimilarity, energy, homogeneity, maximum probability, difference entropy, information measure of correlation I, information measure of correlation II, inverse difference normalized (IDN), inverse difference moment normalized (IDMN), cross correlation. Figure 5 shows how these selected features are significantly different in means and standard errors (SE) between these two groups.
7.
Discussion
Since the visual diagnosis of the MRI scans is subjective and depends on the expertise of the radiologist, texture analysis has been widely studied for improving the diagnosis of MRI brain scans.
A novel 3DMGLCM method was proposed to accelerate and reduce the computational complexity of the texture feature extraction from MRI brain slices of the MGLCM method. This method was implemented on all MRI slices of each patient at the same time instead of extracting texture features from each MRI slice separately from its neighboring slices such as MGLCM method. Over the entire dataset which included 165 patients, the average highest achievable accuracy by 3DMGLCM was 93.3% by using MLP classifier compared with 97.8% was achieved by MGLCM. Since there are nine co-occurrence matrices are computed by 3DMGLCM, the total processing time is TP=9n for all MRI slices of each patient and by using the Big-O notation, we could write Tf = O(9n), compared with the Big-O notation of MGLCM was Tf = O(9n) for each MRI slice. That means the
computation complexity of MGLCM method is multiplied with increasing number of MRI slices. Consequently, the computation time for extracting texture features from MRI brain scanning is reduced from 2.3 min/MRI slice using MGLCM method to 1.53 min/MRI slice using 3DMGLCM method by using an HP Workstation Z820 with Xeon E5-3.8GHz (Quad-Core), and 16GB of RAM. It is concluded, that there is a trade-off between accuracy and computation time, once the accuracy is an important, the computation time will be neglected and vice versa. The MGLCM gives high performance and accuracy in discriminating the normality and abnormality of the brain without needing to implement skull removing.
8.
Conclusion
An automated screening algorithm of MRI brain scanning images is developed to identify brain abnormality. This algorithm helps clinicians to improve the accuracy of the diagnosis and to reduce the diagnosing time. It is observed that the statistical texture features which were extracted by 3DMGLCM are sufficient to discriminate the pathological patients from non-pathological patients by using T2 weighted MRI images because most of the brain tumors appear hyper intense in these images relative to normal brain tissue.
It is also noted, that the achieved accuracy with low computational complexity demonstrates the efficiency of the proposed method for features extraction and its independence from the atlas registration method. A further advantage of our approach is that it uses a single MRI scan modality (T2 weighted image). The 3DMGLCM gives high performance and accuracy in discriminating the normality and abnormality of the brain. However, the method is computationally expensive and memory requirements represent the main disadvantage.
9.
Acknowledgement
We would like to thank the MRI Unit of Al Kadhimiya Teaching Hospital in IRAQ for providing us with the MRI brain scanning images dataset.
10.
References
[1] K. D. Toennies, Guide to medical image analysis: methods and algorithms: Springer Science & Business Media, 2012.
[2] G. Karkavelas and N. Tascos, "Epidemiology, Histologic Classification and Clinical Course of Brain Tumors," in
Imaging of Brain Tumors with Histological Correlations, A. Drevelegas, Ed., ed: Springer Berlin Heidelberg, 2011, pp. 1-12.
[3] N. Nabizadeh, "Automated Brain Lesion Detection and Segmentation Using Magnetic Resonance Images," PhD, Department of Electrical and Computer Engineering, University of Miami, USA, 2015.
[4] D. Mortazavi, A. Z. Kouzani, and H. Soltanian-Zadeh, "Segmentation of multiple sclerosis lesions in MR images: a review," Neuroradiology, vol. 54, pp. 299-320, 2012.
[image:6.612.51.299.225.335.2][5] H. Menze, A. Jakab, S. Bauer, J. Kalpathy-Cramer, K. Farahani, J. Kirby, et al., "The Multimodal Brain Tumor Image Segmentation Benchmark (BRATS)," IEEE
Figure 4. The optimal number of features corresponding with optimal threshold value.
[image:6.612.41.303.384.521.2]Transactions on Medical Imaging,, vol. 34, pp. 1993-2024, 2015.
[6] A. Hasan and F. Meziane, "Automated screening of MRI brain scanning using grey level statistics," Computers & Electrical Engineering, vol. 53, pp. 276–291, 2016. [7] A. Chaddad, "Automated feature extraction in brain
tumor by magnetic resonance imaging using gaussian mixture models," Journal of Biomedical Imaging, vol. 2015(8), p. 8, 2015.
[8] A. Kharrat, G. Karim, M. Ben Messaoud, N. Benamrane, and M. Abid, "A Hybrid Approach for Automatic Classification of Brain MRI Using Genetic Algorithm and Support Vector Machine," Leonardo Journal of Sciences, vol. 1, pp. 71-82, 2010.
[9] S. Beura, B. Majhi, and R. Dash, "Mammogram classification using two dimensional discrete wavelet transform and gray-level co-occurrence matrix for detection of breast cancer," Neurocomputing, vol. 154, pp. 1-14, 2015.
[10] G. Pantelis, "Computer Assisted Diagnosis of Brain Tumors based on Statistical Methods and Pattern Recognition Techniques," PhD, Interdepartmental Postgraduate Program in Medical Physics, University of Patras, Greece, 2010.
[11] W. Gomez, W. Pereira, and A. Infantosi, "Analysis of Co-Occurrence Texture Statistics as a Function of Gray-Level Quantization for Classifying Breast Ultrasound,"
IEEE Transactions on Medical Imaging,, vol. 31, pp. 1889-1899, 2012.
[12] W. Qinggang, G. Yong, L. Bin, Z. Qiuwen, and C. Huawen, "An active contour model based on fused texture features for image segmentation,"
Neurocomputing, vol. 151, pp. 1133-1141, 2015. [13] S. Lahmiri and M. Boukadoum, "Hybrid Discrete
Wavelet Transform and Gabor Filter Banks Processing for Features Extraction from Biomedical Images,"
Journal of Medical Engineering, vol. 2013, 2013. [14] J. Sachdeva, V. Kumar, I. Gupta, N. Khandelwal, and C.
Ahuja, "Segmentation, Feature Extraction, and Multiclass Brain Tumor Classification," Swetswise, vol. 26, pp. 1141-1150, 2013.
[15] N. Nabizadeh and M. Kubat, "Brain tumors detection and segmentation in MR images: Gabor wavelet vs. statistical features," Computers & Electrical Engineering, vol. 45, pp. 286–301, 2015.
[16] M. Saritha, K. Paul Joseph, and A. Mathew, "Classification of MRI brain images using combined wavelet entropy based spider web plots and probabilistic neural network," Pattern Recognition Letters, vol. 34, pp. 2151-2156, 2013.
[17] H. Kalbkhani, M. Shayesteh, and B. Zali-Vargahan, "Robust algorithm for brain magnetic resonance image (MRI) classification based on GARCH variances series,"
Biomedical Signal Processing and Control, vol. 8, pp. 909-919, 2013.
[18] E. A. Ashton, K. J. Parker, M. J. Berg, and C. W. Chen, "A novel volumetric feature extraction technique with applications to MR images," IEEE Transactions on Medical Imaging, vol. 16, pp. 365-371, 1997.
[19] A. Hasan, F. Meziane, and M. Abd Kadhim, "Automated Segmentation of Tumours in MRI Brain Scans," presented at the Proceedings of the 9th International Joint Conference on Biomedical Engineering Systems and Technologies (BIOSTEC), Rome, Italy, 2016.
[20] W. H. Nailon, Texture analysis methods for medical image characterisation: INTECH Open Access Publisher, 2010.
[21] G. Dougherty, Digital Image Processing for Medical Applications. Cambridge University Press., 2009. [22] M. Petrou, "Texture in Biomedical Images," in
Biomedical Image Processing, T. Deserno, Ed., ed Springer Berlin Heidelberg, 2011, pp. 157-176. [23] B. Jähne, Digital Image Processing, sixth edition ed.:
Berlin : Springer, 2005.
[24] M. Prastawa, E. Bullitt, S. Ho, and G. Gerig, "A brain tumor segmentation framework based on outlier detection," Medical image analysis, vol. 8, pp. 275-283, 2004.
[25] J. Han, M. Kamber, and J. Pei, Data Mining: Concepts and Techniques: Elsevier, 2011.
[26] M. Hall, "Correlation-based Feature Selection for Machine Learning," PhD, Department of Computer Science, University of Waikato, NewZealand, 1999. [27] P. Van der Maaten, "An Introduction to Dimensionality
Reduction Using Matlab," Faculty of Humanities & Sciences, MICC/IKAT, Maastricht, Maastricht University,2007.