How liquid are banks : some evidence
from the United Kingdom
Yan, M, Zhang, D, Hall, M and Turner, P
http://dx.doi.org/10.1057/jbr.2016.3
Title
How liquid are banks : some evidence from the United Kingdom
Authors
Yan, M, Zhang, D, Hall, M and Turner, P
Type
Article
URL
This version is available at: http://usir.salford.ac.uk/37959/
Published Date
2017
USIR is a digital collection of the research output of the University of Salford. Where copyright
permits, full text material held in the repository is made freely available online and can be read,
downloaded and copied for noncommercial private study or research purposes. Please check the
manuscript for any further copyright restrictions.
How Liquid Are Banks: Some Evidence from UK
Meilan Yan, Dalu Zhang, Maximilian J.B.Hall and Paul Turner
February 9, 2016
Abstract
This paper uses quantitative balance sheet liquidity analysis, based upon modified ver-sions of the BCBS1 and Moody’s2 models, to provide indicators which would alarm the
UK banks’ short and long-term liquidity positions respectively. These information will
also underpin other research related liquidity risk to banks’ lending and performance. Our
framework accurately reflect UK banks’ liquidity positions under both normal and stress scenarios based on the consistent accounting information under IFRS. It has significant
contribution on Basel III liquidity ratios calculation. The study also presents fundamental
financial information to facilitate analysis of banks’ business models and funding strategies.
Using data for the period 2005-2010, we provide evidence that there have been variable liq-uidity strains across the UK banks in our sample. The estimated results show that Barclays
Bank was the only bank to maintain a healthy short-term liquidity position throughout the
sample period; while HSBC remained liquid in the short term, in both normal and stress
conditions, except in 2008 and 2010. RBS, meanwhile, maintained healthy long-term liq-uidity positions from 2008 after receiving government injections of capital. And Santander
UK was also able to post healthy long-term liquidity positions, except in 2009. However,
the other four banks, the Bank of Scotland, Lloyds TSB, Natwest, and Standard Chartered,
proved illiquid, on both a short-term and long-term basis, throughout the six-year period, with Natwest being by far the worst performer.
Keywords: UK Balance Sheet Analysis, Liquidity Coverage, Net Cash Capital
1
Introduction
determines the short-term liquidity of the bank. The capacity to borrow sufficient long-term funds at reasonable cost present the long-term liquidity of the bank. The level of permanent tradablity of capital market products without undue price concessions also affect the liquidity of the bank to generate cash. The willingness of the market to turn marketable assets into cash or provide funding again determine the liquidity of the bank.
Even though Basel II3 required regulators and banks to adopt an improved framework for dealing with liquidity risk, the measurement and management of bank liquidity risk did not receive adequate attention. Before the latest banking crisis, the liquidity regimes in the UK had not been fundamentally changed since the early 1980s. According to the Sterling Stock regime applied to large UK retail banks4, these banks were encouraged to just focus on controlling intra-day or weekly liquidity, ignoring wider liqudity issues which became apparent during the recent crisis-notably, the growing dependence on volatile wholesale funding. While the limits applied to the ‘cumulative net mismatched position’ of the remaining banks likewise failed to address key liquidity concerns. Accordingly, as recogised in Basel III1, there was a need for a thorough overhaul of liquidity risk management and assesment. Regulators now argue that liquidity regulation and supervision should be recognized as being of equal importance to capital regulation. Indeed, the UK Financial Services Authority (FSA) was one of the first national banking regulators to propose the adoption of a new liquidity regime (see FSA5–8), just after the Basel Committee on Banking Supervision announced principles for sound liquidity risk management and supervision in September 2008 BCBS9.
This paper applies quantitative balance sheet liquidity analysis to measure short-term and long-term liquidity positions for UK banks. Liquidity risk can arise on both sides of the balance sheet, if either the liquidity generated from selling assets or the liquidity available from various funding sources is insufficient to meet obligations as they fall due. In most cases, a trigger event exposes the existing vulnerability in a bank’s balance sheet and causes an adverse liquidity outcome. The most common sources of bank vulnerability lie in maturity mismatches between assets and liabilities, with assets typically being less liquid than liabilities, and significant short options of the bank with respect to counterparties and customers, such as the right of holders of sight deposits to withdraw them at any time, or the right of providers of short-term money market financing not to roll over that funding at the end of the contract.
liquidity position.
The second contribution of this paper is to take a comprehensive look at the UK banks’ consolidated balance sheet information. This analytical framework provides valuable opera-tional information, such as a bank’s funding strategy and business model, for external agencies and regulators to analyze. This research also provides indicators which would alarm the banks in terms of short-term and long-term liquidity risks. These information will also underpin other research related liquidity risk to banks’ lending and performance.
The third contribution of this paper explains why the previous intra-day or one week liquidity focus no longer ensures a bank can survive an unexpected, serious systemic bank crisis, such as that which caused the demise of Lehman Brothers in September 200812.
We analyze eight UK banks’ liquidity positions from 2005 to 2010 using consistent financial reporting information. Most primary accounting data is taken from the Bankscope database, with secondary data being collected from each bank’s financial reports.
The results show that, in these six years, only Barclays Bank kept adequate short-term liquidity positions throughout, although the HSBC Bank also remained liquid on a short-term basis, except in 2008 and 2010. Meanwhile, Santander UK was able to cover illiquid assets and securities using long-term funding except in 2009; and, after receiving a huge equity injection from the UK government, RBS also managed to maintain adequate long-term liquidity positions after 2008. In contrast, the rest of the sampled banks failed to manage their internal liquidity risks properly, exposing themselves to both short-term and long-term illiquidity over the six year period.
2
Literature Review
As Allen and Gale13, Diamond and Rajan14, and Freixas and Rochet15 mentioned, banks are inherently fragile. This fragility arises because banks provide liquidity by financing themselves with external funding. Song and Thakor16 argued that various funding sources create risk for the bank owing to unanticipated withdrawals that may be precipitated by adverse expectations of creditors about the bank’s payoffs17 due to economic shocks18 or perceived potential bank portfolio risk19. Hence, a bank’s liquidity stress might be diminished by both reducing its risk-taking on the asset side and extending stable funding on the liability side. Inability of realizing flows would render the financial entity illiquid. In order to assess a bank’s liquidity position accurately, it is essential to take a comprehensive look at the bank’s consolidated balance sheet information to examine where banks invest and how they fund themselves rather than to evaluate simple liquidity ratios, such as the ratio of cash and balances with the central bank plus securities over total assets10 and the loans-to-deposits ratio11.
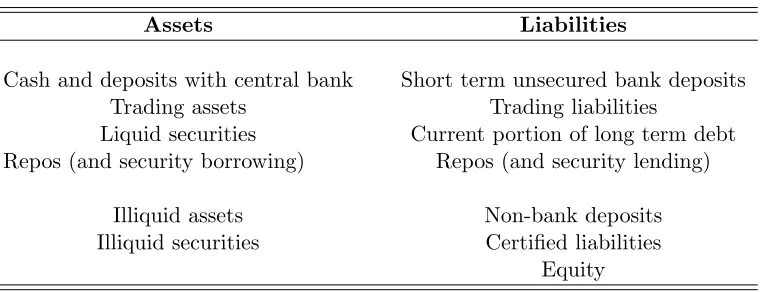
[image:5.612.108.488.482.628.2]The balance sheet liquidity analysis differentiates between different balance sheet items on both the assets side and the liabilities side, depending on whether the assets are liquid or illiquid, and whether their funding is stable or volatile respectively20. Under this approach, a bank liquid in the short term would have enough liquid assets to cover volatile short-term liabilities, while a bank liquid in the long term would have enough stable long-term funding to cover sticky illiquid assets (see Table 1).
Table 1: Balance sheet liquidity analysis
Assets Liabilities
Cash and deposits with central bank Short term unsecured bank deposits Trading assets Trading liabilities
Liquid securities Current portion of long term debt Repos (and security borrowing) Repos (and security lending)
Illiquid assets Non-bank deposits Illiquid securities Certified liabilities
Equity
Source: Neu20, page 19.
2.1 Short-term Liquidity Framework
whether an institution is in the potentially vulnerable position of having insufficient liquid assets or contingency funding to cover short-term debt. Fitch21 assumes that a bank will not
be able to use long-term funding to maintain short-term solvency, and it focuses on short-term ‘liquidity coverage’, which is the difference between the liquidity pool (a pool of liquid assets) and stress scenario cash outflows, as follows:
Liquidity coverage = Liquidity pool−Cash outflows.
A positive figure indicates that the bank would be able to maintain liquidity even with a temporary idiosyncratic or market-wide shock. However, a negative figure means that a bank may be seriously weakened by a disruption of funding capacity, and will need to access other funding facilities to maintain its core business franchise.
[image:6.612.153.438.451.597.2]Fitch21 defines the liquidity pool to include cash, unencumbered assets, government secu-rities, liquid financial assets at fair value, and committed un-drawn lines of credit. The cash outflows come from short-term unsecured debt, brokered deposits, retail deposits, wholesale deposits, collateralized financing, payables and other liabilities, trading liabilities, and com-mitments to extend credit. To ensure prudence, Fitch21 applies different ‘shrinkage margins’ on the possible sources of cash outflow, as shown in Table 2 below.
Table 2: Shrinkage margins for short-term funding imposed by Fitch
Assumed Shrinkage Margins
Cash Outflows
100% Short-term unsecured debt 25% Brokered/internet deposits 10% Retail deposits
50% Wholesale deposits
25% Payables and other liabilities 25% Trading liabilities
10% Collateralized financing
25% Commitments to extend credit
Source: Fitch21.
Fitch21 characterizes balance sheet positions only as ‘liquid’ or ‘illiquid’. There are no statements about in which time frame positions can be liquidated or liabilities become due. In particular, management cannot know from this analysis whether cash outflows becoming due within, say, the next eight days can be met. If the time to maturity of a retail deposit is eight days, it cannot truly be considered as a retail deposit attracting a 10% shrinkage margin.
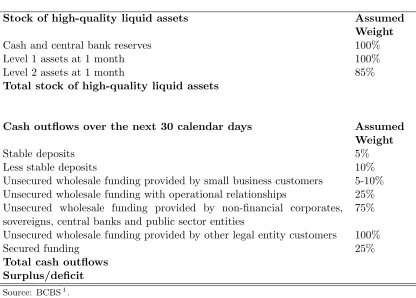
supervision of bank liquidity risk after August 200822. FSA8 sets out a new liquidity reporting regime, a part of the overhaul of UK liquidity regulation, which took effect after June 2010, which requires individual banks to collect daily flows out to three months (i.e. 90 days) to analyze survival periods and spot potential liquidity squeezes early23. BCBS1 develops the liquidity coverage standard for supervisors to use to measure whether a bank makes realistic assumptions about its future liquidity needs for the short-term that reflect the complexities of its underlying business, products and markets. This standard aims to ensure that a bank maintains an adequate level of unencumbered, high-quality liquid assets that can be converted into cash to meet its liquidity needs for a 30 calendar day time horizon under a significantly severe liquidity stress scenario specified by supervisors. At a minimum, the stock of liquid assets should enable the bank to survive until Day 30 of the stress scenario.
The Basel liquidity coverage ratio (LCR) builds on traditional ‘liquidity coverage ratio’ methodologies used internally by banks to assess exposure to contingent liquidity events. As defined,
LCR = Stock of high-quality liquid assets
Total net cash outflows over the next 30 calendar days ≥100%.
There are two categories of assets comprising the stock of high-quality liquidity assets, namely ‘Level 1’ assets and ‘Level 2’ assets24. Assets to be included in each category are those that the bank is holding for a month. Level 1 assets can comprise an unlimited share of the pool and are not subject to any discount under the LCR. Level 2 assets can be inluded in the stock of liquid assets subject to the requirement that they comprise no more than 40% of the overall stock after an assumed weight (85%) has been applied.
Cash outflows come from retail deposits, unsecured wholesale funding provided by small business customers, unsecured wholesale funding with operational relationships, unsecured wholesale funding provided by non-financial corporates, sovereigns, central banks and public sector entities, unsecured wholesale funding provided by other legal entity customers, and secured funding. Table 3 sets out the weights imposed by the Basel Committee for each type of liability, based on the assumptions about the likely speed of cash outflow over the next 30 calendar stressed days. These stress scenarios include bank-specific scenarios, such as an unexpected rating downgrade and operational problems, and external scenarios, such as Emerging Market crises, payment system disruption and macroeconomic shocks.
attract a weight of only 25%.
Table 3: Weights imposed under the Basel Committee’s liquidity coverage ratio
Stock of high-quality liquid assets Assumed
Weight
Cash and central bank reserves 100%
Level 1 assets at 1 month 100%
Level 2 assets at 1 month 85%
Total stock of high-quality liquid assets
Cash outflows over the next 30 calendar days Assumed Weight
Stable deposits 5%
Less stable deposits 10%
Unsecured wholesale funding provided by small business customers 5-10% Unsecured wholesale funding with operational relationships 25% Unsecured wholesale funding provided by non-financial corporates, sovereigns, central banks and public sector entities
75%
Unsecured wholesale funding provided by other legal entity customers 100%
Secured funding 25%
Total cash outflows Surplus/deficit
2.2 Long-term Liquidity Framework
Moody’s2 has developed a long-standing liquidity framework to determine whether a bank’s long-term funding is greater than its illiquid assets. Moody’s assume that the bank will not be able to roll over its short-term funding or to sell its liquid assets to maintain long-term solvency. Besides assuming no new short-term funding for a bank, the liquidation of business by a bank cannot be viewed as a prudent alternative liquidity plan. Raffis25 points out that the virtue of the tool is that it provides a bank with a consistent and externally-accepted framework to quantify, analyze, and then report its liquidity position to rating agencies and regulatory analysts.
Moody’s2 identifies that ‘net cash capital’ is the balance after deducting illiquid assets and illiquid securities from long-term funding, as follows:
Net cash capital = Long-term funding−Illiquid assets−Illiquid securities.
A positive figure indicates that the bank would be able to continue operating from its currently available resources, even with a temporary disruption in the unsecured wholesale funding markets. However, a negative figure means the bank is in a challenging position, requiring it to unwind its liquid assets or secure access to the central bank’s liquidity facility in order to maintain its core business franchise.
Moody’s2defines long-term funding to include hybrid capital securities, long term debt, and insured deposits that are not brokered; while the illiquid assets include fixed assets, intangibles, loans excluding residential mortgages (because of their marketability, only 20% of the value of the latter is deemed illiquid), and other assets. Moody’s2 gives no credit to a bank which can generate cash from credit cards or other securitizations except residential mortgages. But it excludes loans and advances to banks from illiquid assets in that these funds can be replaced quickly by funding elsewhere within the banking system. However, following the sub-prime crisis of 2007, which created uncertainty about the scale and location of associated losses, and, more recently, the eurozone sovereign debt crisis, which created similar uncertainty, banks refused to lend to each other as they hoarded liquidity. Therefore, in the light of recent crises, interbank loans should not be considered as liquid assets under stress scenarios.
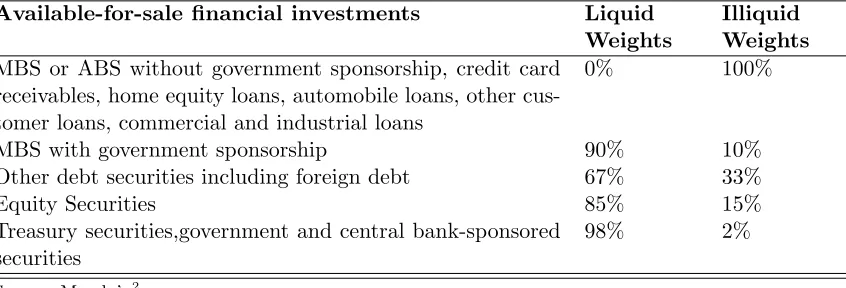
Table 4: Investment securities’ weights imposed by Moody’s
Available-for-sale financial investments Liquid Weights
Illiquid Weights
MBS or ABS without government sponsorship, credit card receivables, home equity loans, automobile loans, other cus-tomer loans, commercial and industrial loans
0% 100%
MBS with government sponsorship 90% 10% Other debt securities including foreign debt 67% 33%
Equity Securities 85% 15%
Treasury securities,government and central bank-sponsored securities
98% 2%
Source: Moody’s2
However, there is still no statement from Moody’s2 about the time scale in which the long-term funding can be liquidated or become due. Even senior debt is generally considered as long-term debt, although it cannot be considered long-term funding if the time to maturity of it is eight days.
BCBS1 also develops the ‘net stable funding’ standard for supervisors to use to measure whether a bank makes realistic assumptions about its future liquidity needs for the long-term that reflect the complexities of its underlying business, products and markets. The Basel liquidity requirements are also designed to reinforce other supervisory efforts by promoting structural changes in the liquidity risk profiles of institutions away from short-term funding and toward more stable, longer-term funding of assets and business activities.
To promote more medium and long-term funding of the assets and activities of banking organizations, the Committee has developed the concept of a net stable funding ratio (NSFR). The NSFR builds on traditional ‘net liquid asset’ and ‘cash capital’ methodologies used widely by internationally-active banking organizations, bank analysts and rating agencies. As defined,
NSFR = Available amount of stable funding
Required amount of stable funding ≥100%.
sheet items. In addition, the NSFR approach offsets incentives for institutions to fund their stock of liquid assets with short-term funds that mature just outside the 30-day horizon for that standard.
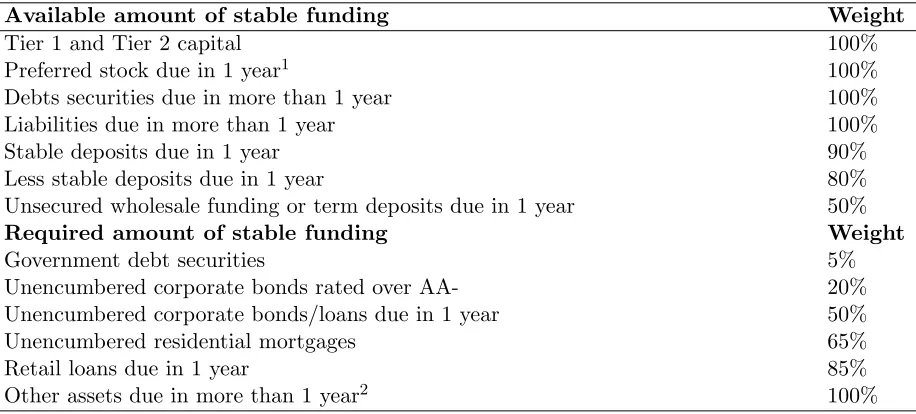
[image:11.612.76.534.311.518.2]Table 5 sets out the NSFR’s composition according to BCBS1. Even though BCBS1 imposes weights for each funding category according to the remaining period to maturity, it failed to clarify the contractual maturity of long-term funding. Therefore, even a part of on-demand deposits can also be considered as available stable funding. Besides, it gives too much weight for funding within less than one year to maturity. For instance, the Basel Committee does not explain why it assumes 90% of 1 year stable deposits as availalbe funding.
Table 5: Weights imposed under the Basel Committee’s net stable funding ratio
Available amount of stable funding Weight
Tier 1 and Tier 2 capital 100%
Preferred stock due in 1 year1 100% Debts securities due in more than 1 year 100% Liabilities due in more than 1 year 100%
Stable deposits due in 1 year 90%
Less stable deposits due in 1 year 80% Unsecured wholesale funding or term deposits due in 1 year 50%
Required amount of stable funding Weight
Government debt securities 5%
Unencumbered corporate bonds rated over AA- 20% Unencumbered corporate bonds/loans due in 1 year 50% Unencumbered residential mortgages 65%
Retail loans due in 1 year 85%
Other assets due in more than 1 year2 100%
Note: 1: Preferred stock excludes Tier 2 capital. 2: Other assets exclude cash and interbank loans.
Source: BCBS1.
3
Data Description
annual financial reports.
Because of the limited availability of bank data, we finally chose to focus on 8 banks out of 121 banks incorporated in the UK and authorized by the FSA26, namely Barclays Bank plc (Barclays), Bank of Scotland (BOS), HSBC Bank plc (HSBC), Lloyds TSB Bank plc (Lloyds TSB), National Westminster Bank plc (Natwest), The Royal Bank of Scotland plc (RBS), Santander UK plc (Santander UK) and Standard Chartered plc (Standard Chartered). These banks accounted for 88% of the total assets of the UK banking sector in 2010.
Since much of the current literature focuses on measuring US banks’ liquidity risk, using accounts based on GAAP, we need to make appropriate adjustments to reflect UK banks’ use of IFRS accounting principles. There are two significant differences relating to recognizing and calculating the assets and liabilities under GAAP and IFRS accounting policies which might change the calculation of a bank’s short long-term liquidity position27.
The first difference relates to the treatment of derivatives and hedging accounting. Under GAAP, derivatives are treated like other assets or other liabilities, as ‘balances arising from off-balance-sheet financial instruments’. Furthermore, before 2004, derivatives were classified as trading or non-trading. Trading derivatives were reported at market value in the balance sheet, with movements in market value recognized immediately in the income statement. Non-trading derivatives, which were transacted for hedging and risk management purposes, were accounted for on an accruals basis in the balance sheet. However, under IFRS, all derivatives are recognized at ‘fair value’ in the balance sheet as assets or liabilities.
Table 6: UK Banks’ Balance Sheets Under IFRS
On <3 3-6 6 mon- 1-5 5-10 >10 Total demand months months 1 year years years years
Assets
Cash and balances at central banks
Items in the course of collection from other banks Trading portfolio assets
Financial assets designated at fair value Derivative financial instruments
Net loans
Reverse repurchase agreements and secured lending Available-for-sale financial investments
Other financial assets Equity investments Intangible assets Fixed assets Other assets
Liabilities
Deposits from banks
Items in the course of collection from other banks Customer accounts
Trading portfolio liabilities
Financial liabilities designated at fair value Derivative financial instruments
Senior debt securities in issue Subordinated liabilities
Reverse repurchase agreements and secured borrowing Other financial liabilities
Equity reconciliation
Equity
Hybrid capital securities accounted for as equity Other adjustments
4
Methodology
A severe liquidity event affecting a bank usually lasts between two weeks and three months5. In a severe crisis that is resolved, one way or an other, within days, liquidity risk managers generally only have access to stand-by liquidity held on the balance sheet at the start of the problem. However, a liquidity crisis with both an idiosyncratic impact and market-wide impact might endure for several years. The latest global banking liquidity crisis started in the summer of 2007 because of the United States’ sub-prime mortgage problem, and lasted until the end of 2009. In these types of environment, liquidity needs are not related to instantaneous shocks; instead, they develop in stages. Moreover, the stages can drag on for a year or more. Therefore, holding enough liquidity to buy sufficient time to access contingent sources is critical.
Our short-term liquidity framework is built to measure whether a bank’s liquid assets can cover its cash outflow for up to one year or not. A short-term illiquid position suggests that the bank might face a potential liquidity event during the year and that it should try to maximize the value of its assets portfolio and make necessary adjustment to its short-term liability portfolio, such as rolling over deposits of less than one year to maturity. Our long-term liquidity framework is built to measure whether a bank’s long-term funding due to mature in more than a year can cover its illiquid assets and securities or not. A long-term illiquid position suggests that the bank’s funding capacity might be insufficient if the liquidity crisis lasts for longer than one year. In such a scenario, the bank should adjust its business model by, for example, switching dependence on wholesale short-term funding to secured long-term funding, and considering its own funding capacity before making new loans.
In this paper, we establish a quantitative balance sheet liquidity framework to measure a UK bank’s liquidity risk by considering the real contractual maturities of its assets and liabilities, which has not been undertaken in previous studies.
4.1 Liquidity Coverage
As we are seeking to estimate one year short-term liquidity coverage, only the values of assets and liabilities maturing within one year are considered. Unlike Fitch21 and BCBS1, therefore, we argue that government securities and trading assets with residual maturities in excess of one year cannot be considered as high-quality liquid assets. The one year liquidity coverage ratio we focus on is thus defined as follows:
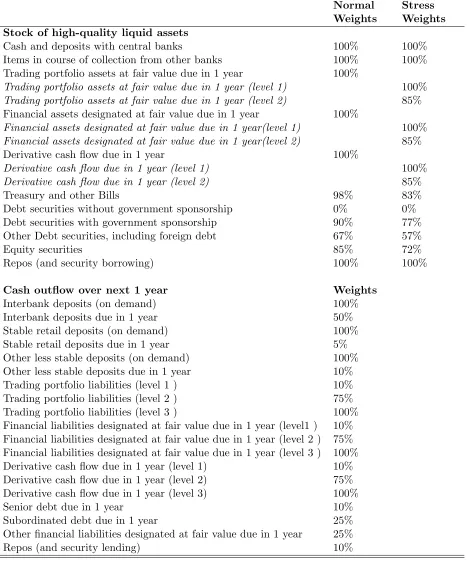
The stock of high-quality liquid assets within one year to maturity is taken to include cash and deposits with central banks, items in the course of collection from other banks, trading portfolio assets at fair value, financial assets designated at fair value, derivative cash flow and repos. Since an available-for-sale security is a debt or equity security that is purchased with the intent of selling before its maturity date, the major part of these securities is liquid in capital markets. Therefore, we impose the assumed weights by Moody’s2 to calculate the value of liquid available-for-sale securities. The short-term cash outflows are assumed to arise from interbank deposits, stable retail deposits, other deposits, trading portfolio liabilities, financial liabilities designated at fair value, derivative cash flow, senior debt, subordinated debt, other financial liabilities and repos.
For valuation purposes, we firstly assume that no other asset sales or early-maturing assets can be used to cover short-term cash outflows and that all of the assets and liabilities are in the same maturity ladders. Secondly, we assume that the value of the stock of high-quality liquid assets under normal circumstance would not be discounted, although the value would be compromised under stress scenarios. Table 7 sets out both the normal and stress weights imposed on high-quality liquid assets. According to the disclosure requirements of IFRS28, an entity has to classify its financial instruments held at fair value according to a hierarchy that reflects the significance of observable market inputs. The fair value hierarchy introduces three levels of inputs. The level 1 assets are considered as very liquid assets, while the level 3 assets are considered as illiquid assets. The level 1 liabilities are considered as very stable liabilities, while the level 3 liabilities are considered as the most unstable liabilities. Therefore, under stress scenarios, the value of the stock of high-quality liquid assets would be compromised and level 3 assets would no longer be considered as high-quality liquid assets. As mentioned earlier, BCBS1 uses a 85% weight for less liquid assets; we also use the same weight to measure the stress value of less liquid financial instruments held at fair value. The stress weight of the available-for-sale portfolio is 85% of its normal weight29 .
We apply the same weights as the BCBS1 for each liability with a remaining maturity from 3 months up to 1 year to measure cash outflows during a liquidity stress year30. But we
assume it is difficult to roll over on-demand deposits and the most unstable financial liabilities in a short time period; here, the weight should be 100%.
4.2 Net Cash Capital
Table 7: Weights imposed under the short-term liquidity framework
Normal Weights
Stress Weights Stock of high-quality liquid assets
Cash and deposits with central banks 100% 100% Items in course of collection from other banks 100% 100% Trading portfolio assets at fair value due in 1 year 100%
Trading portfolio assets at fair value due in 1 year (level 1) 100%
Trading portfolio assets at fair value due in 1 year (level 2) 85% Financial assets designated at fair value due in 1 year 100%
Financial assets designated at fair value due in 1 year(level 1) 100%
Financial assets designated at fair value due in 1 year(level 2) 85% Derivative cash flow due in 1 year 100%
Derivative cash flow due in 1 year (level 1) 100%
Derivative cash flow due in 1 year (level 2) 85%
Treasury and other Bills 98% 83%
Debt securities without government sponsorship 0% 0% Debt securities with government sponsorship 90% 77% Other Debt securities, including foreign debt 67% 57%
Equity securities 85% 72%
Repos (and security borrowing) 100% 100%
Cash outflow over next 1 year Weights
more than one year to maturity. As Raffis25 mentions, some of the stable deposits at least should have a contractual maturity in excess of one year. Therefore, long-term funding in our analysis only includes liabilities with contractual maturity in excess of one year. The long-term net cash capital ratio we use is therefore defined as follows:
NCCR = Long-term Funding
Total Illiquid Assets + Total Illiquid Securities. If the ratio is over 100%, then the bank is deemed liquid in the long-term.
The long-term funding due in more than a year is taken to include deposits by banks, customer deposits, financial liabilities designated at fair value, derivative cash flow, senior debt securities, subordinated debt, other funding, equity and hybrid capital securities accounted for as equity.
Some financial instruments that are held neither for trading nor sale should also be con-sidered as illiquid assets, since they might be unable to generate cash inflow until the end of their maturity. Therefore, different from Moody’s2, we include held-to-hedge derivatives and other held-to-maturity financial investments as illiquid assets as well. The illiquid assets include net loans32, equity investments, non-trading derivative financial instruments, other real estate-owned, intangible assets, fixed assets, other assets and held-to-maturity financial investments.
The illiquid securities from available-for-sale accounts are taken to include Treasury and other bills, debt securities, and equity securities. Moody’s2 argues that the weights on
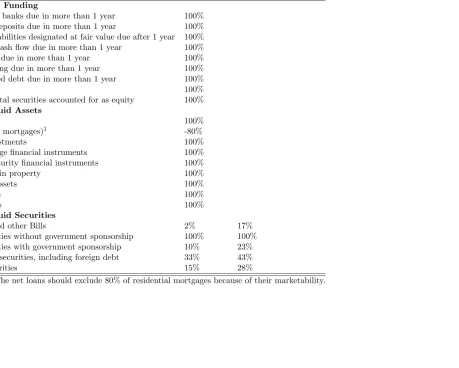
Table 8: Weights imposed under the long-term liquidity framework
Normal Weights
Stress Weights Long-term Funding
Deposits by banks due in more than 1 year 100% Customer deposits due in more than 1 year 100% Financial liabilities designated at fair value due after 1 year 100% Derivative cash flow due in more than 1 year 100% Senior debt due in more than 1 year 100% Other funding due in more than 1 year 100% Subordinated debt due in more than 1 year 100%
Equity 100%
Hybrid capital securities accounted for as equity 100%
Total Illiquid Assets
Net loans 100%
(Residential mortgages)1 -80%
Equity investments 100%
Held-to-hedge financial instruments 100% Held-to-maturity financial instruments 100% Investment in property 100%
Intangible assets 100%
Fixed assets 100%
Other assets 100%
Total Illiquid Securities
Treasury and other Bills 2% 17%
Debt securities without government sponsorship 100% 100% Debt securities with government sponsorship 10% 23% Other debt securities, including foreign debt 33% 43%
Equity securities 15% 28%
Note: 1: The net loans should exclude 80% of residential mortgages because of their marketability.
5
Results
335.1 Liquidity Coverage
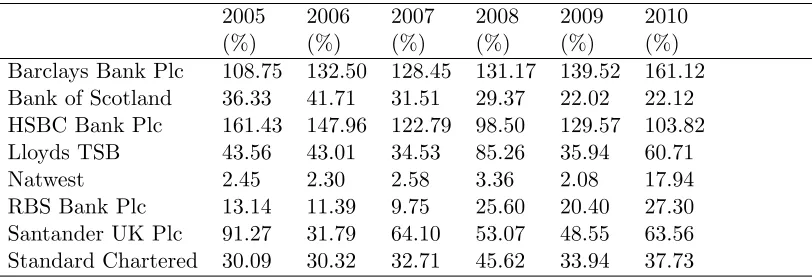
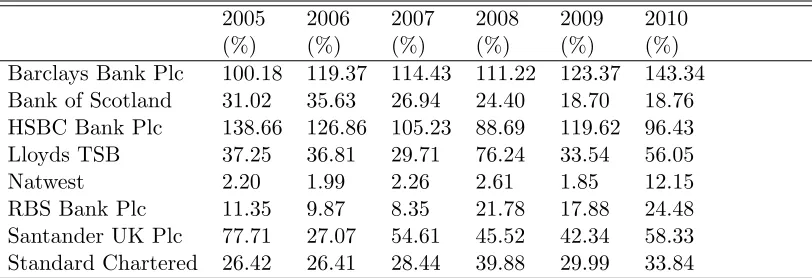
Barclays Bank was the only bank posting healthy short-term liquidity positions throughout the six-year period. HSBC Bank also remained liquid, in both normal conditions and stress scenarios, but not in 2008 and 2010. However, the other six banks, Bank of Scotland, Lloyds TSB, Natwest, RBS, Santander UK and Standard Chartered, failed to maintain adequate short-term liquidity positions under either normal or stress conditions in hardly any of the years (see Tables 9 and 10 and Figure1)!
Barclays Bank’s ‘success’ was due to holding billions in cash with central banks and in loans from other banks and engaging in repos. Since these assets are highly liquid, the value of them would not be compromised even under stress circumstances. The bank also continuously held stable liquid financial assets in its trading portfolio, as well as in the form of financial assets designated at fair value, and derivatives. Meanwhile, the bank’s cash outflows were well diversified, with the biggest exposures being due to on-demand stable retail deposits which typically amounted to 30% or so of total cash outflows, and to level 2 derivative cash outflow. Because of only a tiny dependence on those liabilities with 100% cash outflow weight, HSBC’s total cash outflows were very limited, helping it to remain liquid in normal conditions, expect in 2008, the year the UK economy faced a steep recession. The positive stress liquidity coverage in 2009 resulted from large cash holdings with central banks34. However, under stress scenarios, HSBC turned out to be illiquid in both 2008 and 2010. This was mainly because HSBC significantly increased its dependence on short-term trading portfolio liabilities and derivatives in those two years, which generated significant cash outflow.
The Bank of Scotland, meanwhile, failed to hold enough high-quality liquid financial assets to cover the total cash outflows, resulting in illiquidity in all years under both normal and stress conditions. Moreover, the bank was over-dependent on deposit funding, which, on average, accounted for around 74% of total cash outflows. After 2007, the average liquidity coverage ratio was only 67% of that recorded between 2005 and 2006, largely because of the large increase in the bank’s retail deposit holdings.
As for Lloyds TSB, the bank’s total liquid assets rarely exceeded half of its total cash outflow. As a result, it too remained illiquid throughout the period, in both normal and stress years. Moreover, the bank over-concentrated its liabilities on on-demand deposits which contributed, on average, around 73% of total cash outflows.
period. As a result, the bank also remained illiuqid throughout the sample period, under both normal and stress conditions, posting by far the lowest LCRs. The bank’s failure to hold any items in the course of collection from other banks, trading portfolio assets, or financial assets designated at fair value contributed to its poor performance.
RBS also experienced severe short-term liquidity problems throughout the sampled period. In 2010, for instance, its total cash outflows were £548 billion but the total normal value of liquid assets was just£150 billion. Moreover, total deposits were 3 times as much as the bank’s total high quality liquid assets. And its total deposits contributed around 83% of its total cash outflow.
Santander UK Plc has not held significant amounts of investment securities for a long time, resulting in its total liquid assets being, on average, only half of its total cash outflows. Moreover, the bank has been over-dependent on the most unstable liabilities. Its on-demand retail deposits contributed some 51% of total cash outflows, on average. As a result , the bank proved illiquid throughout the sample period, under both normal and stress condition.
[image:20.612.93.499.475.614.2]Finally, Standard Chartered had roughly the size of cash outflows as HSBC Bank, but its size of high-quality liquid assets was, on average, less than 31% of the size of HSBC’s. Thus, its liquid assets could not even cover cash outflow from on-demand retail deposits in any of the sample years, causing the bank to remain illiquid, in both normal and stess conditions, throughout the sample period.
Table 9: UK banks’ normal LCRs1
2005 2006 2007 2008 2009 2010 (%) (%) (%) (%) (%) (%) Barclays Bank Plc 108.75 132.50 128.45 131.17 139.52 161.12 Bank of Scotland 36.33 41.71 31.51 29.37 22.02 22.12 HSBC Bank Plc 161.43 147.96 122.79 98.50 129.57 103.82 Lloyds TSB 43.56 43.01 34.53 85.26 35.94 60.71 Natwest 2.45 2.30 2.58 3.36 2.08 17.94 RBS Bank Plc 13.14 11.39 9.75 25.60 20.40 27.30 Santander UK Plc 91.27 31.79 64.10 53.07 48.55 63.56 Standard Chartered 30.09 30.32 32.71 45.62 33.94 37.73
Notes: 1.The banks’ normal postions (in£bn.) are depicted in Figure 1.
5.2 Net Cash Capital
Table 10: UK banks’ stress LCR1
2005 2006 2007 2008 2009 2010 (%) (%) (%) (%) (%) (%) Barclays Bank Plc 100.18 119.37 114.43 111.22 123.37 143.34 Bank of Scotland 31.02 35.63 26.94 24.40 18.70 18.76 HSBC Bank Plc 138.66 126.86 105.23 88.69 119.62 96.43 Lloyds TSB 37.25 36.81 29.71 76.24 33.54 56.05 Natwest 2.20 1.99 2.26 2.61 1.85 12.15 RBS Bank Plc 11.35 9.87 8.35 21.78 17.88 24.48 Santander UK Plc 77.71 27.07 54.61 45.52 42.34 58.33 Standard Chartered 26.42 26.41 28.44 39.88 29.99 33.84
Notes: 1.The banks’ stress positions (in£bn.) are depicted in Figure 1.
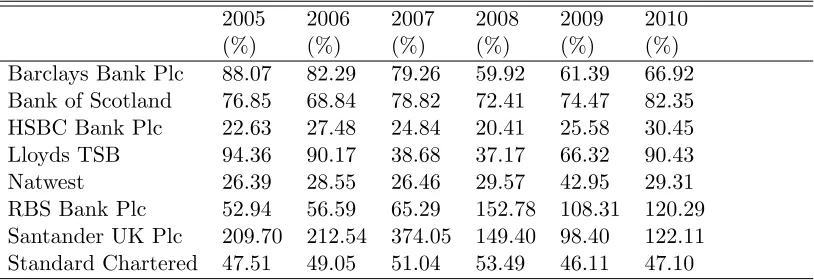
respectively, resulting in average NCCRs of 58.74% and 58.27% respectively (see Tables 11 and 12). The post 2008 improvement reflected increased funding from derivative trading, senior debt issuance, and equity issuance. For example, the bank’s 2009 equity increased by £9bn (20%) to £55.2bn.35 As a result, its total long-term funding could cover both illiquid assets
and securities, even under stressed conditions.
Santander UK Plc also posted healthy long-term liquidity positions, but not in 2009. Al-though the bank’s illiquid assets and securities rose by only 4% between 2008 and 2009, the size of its long-term funding shrank by 32%, causing the illiquidty. A 28% growth in long-term funding in 2010 restored the bank’s healthy net cash capital position that year.
Table 11: UK banks’ normal NCCRs1
2005 2006 2007 2008 2009 2010 (%) (%) (%) (%) (%) (%) Barclays Bank Plc 90.27 84.18 80.72 61.14 62.77 68.71 Bank of Scotland 78.49 70.35 80.18 73.05 75.11 82.90 HSBC Bank Plc 23.11 28.09 25.43 21.08 26.28 31.48 Lloyds TSB 94.80 97.61 38.96 38.44 66.97 91.38 Natwest 26.45 28.51 26.53 29.66 43.05 29.37 RBS Bank Plc 53.54 57.05 65.63 153.59 109.40 121.64 Santander UK Plc 209.82 212.56 374.12 150.09 98.52 122.14 Standard Chartered 49.53 47.84 53.03 55.69 47.98 48.64
Notes: 1.The banks’ normal positions (in£bn.) are depicted in Figure 1.
Table 12: UK banks’ stress NCCRs 1
2005 2006 2007 2008 2009 2010 (%) (%) (%) (%) (%) (%) Barclays Bank Plc 88.07 82.29 79.26 59.92 61.39 66.92 Bank of Scotland 76.85 68.84 78.82 72.41 74.47 82.35 HSBC Bank Plc 22.63 27.48 24.84 20.41 25.58 30.45 Lloyds TSB 94.36 90.17 38.68 37.17 66.32 90.43 Natwest 26.39 28.55 26.46 29.57 42.95 29.31 RBS Bank Plc 52.94 56.59 65.29 152.78 108.31 120.29 Santander UK Plc 209.70 212.54 374.05 149.40 98.40 122.11 Standard Chartered 47.51 49.05 51.04 53.49 46.11 47.10
[image:22.612.93.500.503.643.2]6
Summary and conclusions
Our balance sheet analysis, based on the work of BCBS1 and Moody’s2, but modified to account for recent market experience and to give greater recognition to the actual maturity profiles of banks’ assets and liabilities, has demonstrated that the largest eight UK banks have all suffered some liquidity strains since 2005. Our results show that only Barclays Bank remained liquid on a short-term basis throughout the sample period (2005-2010); while the HSBC Bank also proved liquid on a short-term basis, although not in 2008 and 2010. On a long-term basis, RBS has remained liquid since 2008 after receiving government support; while Santander UK also proved liquid, except in 2009. The other banks, especially Natwest, are shown to have faced challenging conditions, on both a short-term and long-term basis, over the sample period.
References and Notes
1. BCBS. (2010). Basel III : International framework for liquidity risk measurement, stan-dards and monitoring. Basel, December.
2. Moody’s. (2001). How Moody’s evaluates US bank & bank holding company liquidity. Global Credit Research, Moody’s Investors Service, New York.
3. BCBS. (2003). Overview of The New Basel Capital Accord. Bank for International Set-tlements, Basel, April.
4. The Sterling Stock regime basically requires UK banks to be able to cover their five-day wholesale net outflow and 5% of withdrawable retail deposits over the same period (Hall, 1999, Chapter 18, pages 304-26).
5. FSA. (2008). Strengthening liquidity standards 1 (08/22). Policy Statment. London, October.
6. FSA. (2009). Strengthening liquidity standards 2 (09/13). Policy Statment. London, April.
7. FSA. (2009). Strengthening liquidity standards 3 (09/14). Policy Statment. London, June.
8. FSA. (2009). Strengthening liquidity standards including feedback on CP08/22, CP09/13 and CP09/14. Policy Statment. London, October.
9. BCBS. (2008). Principles for Sound Liquidity Risk Management and Supervision. Basel, September.
10. Ray Barrell, E. Philip Davis, Iana Liadze, and D Karim. (2010). Does the current account balance help to predict banking crises in OECD countries? NIESR Discussion Papers No. 351, National Institute of Economic and Social Research.
11. Leonardo Gambacorta. (2010). Do bank capital and liquidity affect real economic activity in the long run? A VECM analysis for the US. mimeo. BIS.
12. Lehman Brothers collapsed in September 2008, a year after the start of the US sub-prime crisis.
14. Douglas W. Diamond and Raghuram G. Rajan. (2001). Liquidity risk, liquidity creation, and financial fragility: A theory of banking. Journal of Political Economy, 109(2):287–327.
15. Xavier Freixas and Jean-Charles Rochet. (1999). Microeconomics of Banking. the MIT Press, Massachusetts.
16. Fenghua Song and Anjan V. Thakor. (2007). Relationship Banking, Fragility and the Asset-Liability Matching Problem. Review of Financial Studies, 20(6):2129–77.
17. V V Chari and Ravi Jagannathan. (1988). Banking panics, information, and rational expectations equilibrium. Journal of Finance, 43(3):749–61.
18. Gary Gorton and Richard Rosen. (1992). Corporate control, portfolio choice, and the de-cline of banking.NBER Working Papers. No.4247, National Bureau of Economic Research, Inc, Massachusetts.
19. Charles W Calomiris and Charles M Kahn. (1991). The role of demandable debt in structuring optimal banking arrangements. American Economic Review, 81(3):497–513.
20. Peter Neu. (2007). Liquidity Risk Measurement and Management. John Wiley & Sons (Asia) Pte Ltd.
21. Fitch. (2010). Managing Cash Capital in Banks. London, July.
22. The FSA requires all UK banks to maintain adequate liquidity resources at all times and not to depend on other parts of their group to satisfy the overall liquidity adequacy rule.
23. Even though banks are required to report daily cash flow from both on-balance-sheet and off-balance-sheet accounts, there is no requirement that all the information is made available to external analysts.
25. Louise D. Raffis. (2007). The net cash capital tool in bank liquidity management. Chapter 11 in Liquidity Risk Measurement and Management, art. Leonard Matz, Peter Neu. John Wiley & Sons, Singapore.
26. FSA. (2011). List of banks as compiled by the FSA on 30 June 2011. Technical Report. London.
27. Barclays. (2005). Barclays Bank Plc: Annual Report 2005. Note 62, pp. 131-140, London.
28. Deloitte. (2011). Summaries of International Financial Reporting Standards. Deloitte Global Services Limited. Available at (http://www.iasplus.com/standard/ifrs07.htm).
29. The available-for-sale portfolio includes Treasury and other bills, debt securities, and equity securities. We also assume unexpected rating downgrades or other market volatility might reduce the market value of fianncial assets by 15%.
30. The stress scenarios include bank-specific scenarios and systemic funding strains.
31. Kleopatra Nikolaou. (Feburary 2009). Liquidity (risk) concepts definitions and interactions. Working paper 1008, European Central Bank.
32. As loans and advances to banks were not replaced quickly by funding elsewhere within the banking system between 2007 and 2009, different from Moody’s2, we therefore, include them as illiquid assets.
33. The balance sheet data is available on request.
34. The average level of cash and deposits held with central banks between 2009 and 2010 was 5 times as high as it was between 2005 and 2007, reflecting the ‘hoarding’ of liquidity by banks during the global financial crisis.