2019 2nd International Conference on Informatics, Control and Automation (ICA 2019) ISBN: 978-1-60595-637-4
Research on SOC Prediction of Lithium Battery Based on Whale and
Genetic Algorithm Optimized Elman Neural Network
Xiao-yi MAO, Yao-yi TANG, Xiao-qi DING, Hao-yan JIANG,
Jian-fei CHEN and Sheng ZHANG
*School of Electronics and Optical Engineering, Nanjing University of Posts and Telecommunications, China
*Corresponding author
Keywords:State of charge, Elman neural network, Whale and genetic algorithm.
Abstract. Accurate estimation of the state of charge (SOC) of lithium batteries is the research hotspot. As a dynamic recurrent neural network, Elman neural network has a simple structure and can adapt to time-varying characteristics, which have led to its widespread application in the field of SOC prediction. However, the simple network structure can also cause problems such as low learning efficiency, easy to fall into local extremes, and difficulty converge to the optimal weight solution. This paper proposes to combine the whale optimization algorithm (WOA) with genetic algorithm (GA) to optimize the weights and thresholds of the Elman neural network, thus improving the learning speed and prediction accuracy. We select three parameters of current, voltage and temperature as system variables, and simulate the experimental data. The experimental results show that, compared with the traditional Elman neural network and the Elman neural network optimized only by genetic algorithm, the hybrid algorithm performs best. The number of network iterations is small, and the average error drops below 1%.
Introduction
In order to deepen the research on lithium batteries, it is necessary to establish relevant battery models. Accurate battery model is of great significance for battery management and battery-powered system development. The SOC is a critical variable, which is defined that the ratio of the remaining capacity of the battery to the rated capacity under certain discharge conditions [1].
There are many methods used to estimate the value of SOC, such as kalman filter, neural network and fuzzy inference [2]. The kalman filter method is an algorithm that uses the linear system state equation to estimate the system state through the input and output of the system. However, the battery model is not linear and complicated to implement. The neural network method has adaptive learning ability and can approximate any nonlinear system. The main difficulty is to speed up the convergence and avoid local optimization. The fuzzy inference method can establish fuzzy rules through a large amount of data, and determine the membership function. However, this method lacks of adaptive ability and learning ability.
To solve the shortage of traditional neural network to predict the SOC, this paper proposes a SOC prediction method based on whale and genetic algorithm to optimize the weights and thresholds of Elman neural network. We select current, voltage and temperature as the system variables to construct a three-input and one-output Elman neural network model.
Principle of Predictive Model for Optimizing Weight and Threshold of Elman Neural Network Based on Whale and Genetic Algorithm
Elman Neural Network Introduction
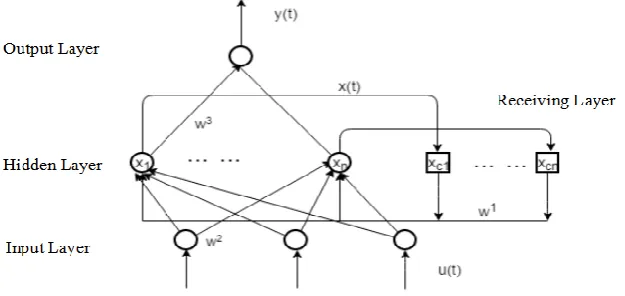
hidden layer before the moment. So the Elman network does not need to store all the input information, but can reflect the influence of all historical signals on the current system in the network, and can approximate any nonlinear projection with arbitrary precision. Its structure is shown in figure 1:
Figure 1. Structure of Elman neural network.
Through figure 1, it can be see that u(t) is the network input vector, y(t) is the output vector, )
(t
xc is the receiving layer output vector, w1 represents the connection weight of the receiving layer to the hidden layer, w2 represents the connection weight from the input layer to the hidden layer, and 3
w represents the connection weight from the hidden layer to the output layer. The input
and output relationship of the Elman network can be written as follows:
) b ) ( ( ) (
y t g w3x t 2 (1)
) b ) ( )
( ( )
(t f w1x t w2u t 1
x c
(2)
) 1 ( )
(t x t
x (3)
Where f() is the transfer function of the hidden layer neurons, g() is the transfer function of the output layer neurons, b1 is the hidden layer threshold, b2 is the output layer threshold.
The error indicator function will be used later in this article: y(k) is the actual output and the
) (k
d is the expected output. It is defined as:
2 n
1 k
)] ( ) (
[y k d k E
(4)
Whale and Genetic Algorithm Optimization Principle
The whale optimization algorithm is an intelligent algorithm with better search ability, which is not easy to fall into local optimization and has fewer adjustment parameters [4]. To briefly describe the whale algorithm, we assume the following four idealization rules: all whales communicate by ultrasound in the search area; each whale can calculate its own distance from other whales; the quality of the food found by each whale is expressed by the fitness value; the movement of the whale is guided by the whales that are better than it and the whales closest to it. The formula for the movement of the whale x under its ‘better and more recent’ whale y is as follow:
) (
0 rand
1 t
i t i t
i t
i x y x
The genetic algorithm is known for its versatility and parallel search ability, which can obtain the optimal solution of the problem to be optimized in a short time [5, 6]. The main process of genetic algorithm is to start from the initial chromosome group, through the mutation operator, crossover operator and selection operator, and continue to evolve (change the fitness) in the feasible solution space to get the optimal chromosome.
The traditional Elman neural network uses the gradient descent method to modify the weights, while the gradient descent method is a local optimization algorithm with poor optimization. We combine the whale optimization algorithm with genetic algorithm, to optimize the connection weights and thresholds. This hybrid algorithm mainly based on the whale algorithm, and then the genetic algorithm is added in the algorithm process. We replace the worst whale in the whale algorithm with the optimal chromosome in the genetic algorithm, and improve the fitness function
) (t
F in the genetic algorithm by introducing the diversity function D(t) to ensure the diversity of the population:
t i N i
i t D N
E t D E t F
N
t i
( , ), 1,2 ,
1 1 1 ) ( 1 )
( (6)
Where E is the value of Eq. 4, N is the number of samples, D(t,i) represents the degree of difference between t and i individuals.
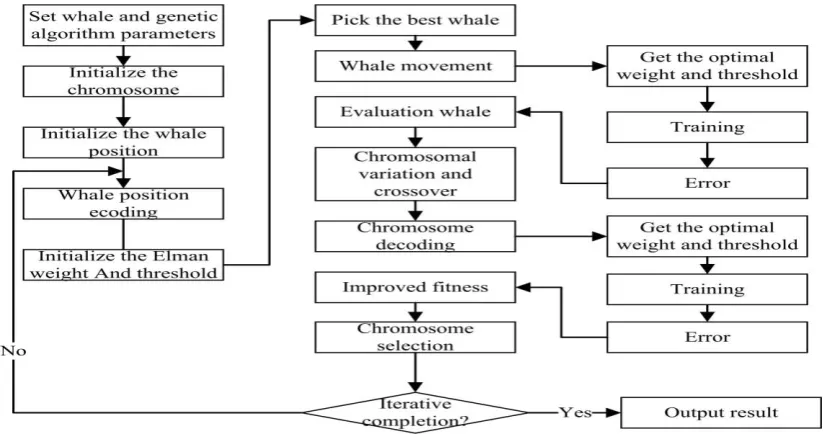
Specific Steps to Optimize the Weights and Thresholds of Elman Neural Networks Based on Whales and Genetic Algorithm
We use the weights and thresholds of the Elman neural network as the coding individual, and used the training error as the criterion for changing the fitness value of the individual. The specific optimization parameters include the weight matrix 1
w , 2
w , 3
w and the threshold matrix b1, b2. Step 1 Set the initial parameters of the whale and genetic algorithm, and encode the data.
Step 2 Use the error index function of the Elman neural network as the fitness to evaluate the whale, and select the optimal whale, then the whale position is adjusted to satisfy the principle of ‘better and more recent’. The weights and thresholds are updated at the same time.
Step 3 Mutate and cross the poor whales, and use the improved fitness functionF(t) as the evaluation criterion to select the optimal chromosome, then replace the poor whale with the optimal chromosome. The weights and thresholds are updated at the same time.
[image:3.595.92.504.556.773.2]Step 4 Keep iterating until the output conditions are met. Then output optimal weights and thresholds, and apply the optimized weights and thresholds to the Elman neural network to obtain the optimal predicted value. The flow chart is as follows (Shown as the figure 2):
Lithium Battery Data Acquisition
The test objects are lithium iron phosphate batteries with a nominal voltage of 3.2V and a nominal capacity of 15Ah.The battery parameter detection system mainly uses STM32F103 single-chip microcomputer as the main processor to measure various parameters of the battery. The battery discharge voltage is sampled using the 16-bit high-precision low-power analog-to-digital converter ADS1115. The discharge current is measured by TI's special high-side current sampling chip INA282. The temperature and residual power of different discharge states are measured by DS18B20 temperature sensor and ADI's battery power measurement chip LTC2941.Set the experimental sampling interval to five minutes. The sampled data is displayed through the TFTLCD liquid crystal module and transmitted to the computer in real time through serial communication.
[image:4.595.64.525.559.711.2]Through comprehensive consideration of battery performance and experimental conditions, we set the load to 1Ω and the discharge cut-off voltage to 2.7V. The following table shows some test data for 1Ω constant resistance discharge (Shown as the table 1):
Table 1. Part of the experimental data.
Voltage(V) 3.206 3.179 3.208 3.171 3.157 3.151 3.195 3.054 3.111 3.165 Current(A) 2.932 2.901 2.942 2.89 2.868 2.865 2.914 2.772 2.828 2.885 Temperature
(°C) 18.2 18.5 17.2 18.6 18.8 18.8 18.5 19.0 18.6 18.3 Measured
SOC Value
0.8509 0.6606 0.9549 0.5881 0.4293 0.3864 0.7481 0.1187 0.2443 0.5303
Simulation Results and Analysis
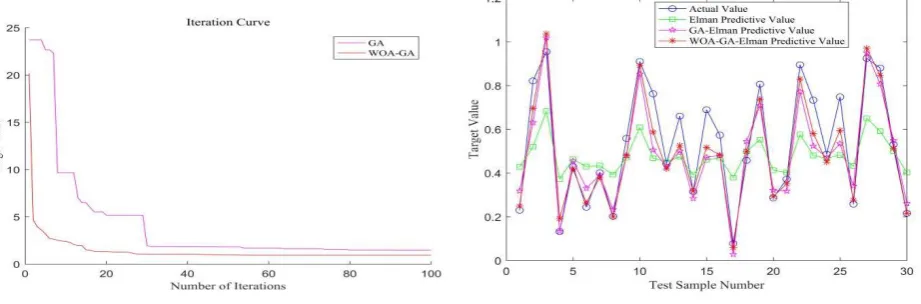
The parameters of the whale and the genetic algorithm are set as follows: the coding length is 105, the population number is 50, the maximum number of iterations is 100, the mutation probability is 0.1, and the crossover probability is 0.7. In order to verify the advantages of the whale optimization algorithm combined with the genetic algorithm in optimizing the Elman neural network, we use the same parameters to compare with hybrid algorithm and the genetic optimization algorithm. The analysis is performed by the algorithm fitness iterative curve and the prediction effect diagram.
As the figure 3 shown, the number of iterations of the Elman neural network optimized by whale and genetic algorithm (about 20 times) is significantly less than the number of iterations of Elman nerves optimized only by genetic algorithm (about 30 times), and it is not easy to fall into local extremum and can quickly converge to the target value. Therefore, the hybrid algorithm has a stronger search ability and the ability to jump out of the local optimal solution.
Figure 3. Iterative Curve. Figure 4. Comparison of actual and predicted values.
In order to evaluate the accuracy of the proposed algorithm in this paper more effectively and comprehensively. The average absolute percent error (MAPE) and mean square error (MSE) are used to evaluate the performance of the three methods presented in Figure 5. The small value of MAPE and MSE means that the smaller the difference between the predicted value of the model and the real data. In other words, the performance of the model is good. The prediction accuracy of Elman optimized by different algorithms is shown in Table 2. For the MAPE and MSE, the Elman neural network optimized by whale and genetic algorithm is smaller than other algorithms.
Table 2. Prediction accuracy table. Evaluation index MAPE MSE
Elman 50.6560 0.0433 GA-Elman 17.6663 0.0124 WOA-GA-Elman 10.8105 0.0063
Summary
This paper proposes a method based on whale and genetic algorithm to optimize the weights and thresholds of Elman neural network. It is used to predict the remaining capacity of the battery. The experimental result shows that the algorithm can reach the optimal solution faster, and the average error of the predicted value is below 1%. Compared with other optimization algorithms, the hybrid algorithm has small prediction error, fast prediction speed and excellent prediction value. It can be used as a reliable method for SOC prediction, and can also be used as a prediction method for other types of data.
Acknowledgement
This work is supported by China National Natural Science Foundation (61601237), Jiangsu Natural Science Foundation (BK20160901).
References
[1] Gao Antong, Zhang Jin, Chen Ronggang, Zuo Xiuwei. Estimation of Charge State and Residual Life Prediction of Lithium Ion Batteries[J]. Power Supply Technology, 2014, 38(06): 1066-1068.
[2] Quan Kuisong. Research on SOC estimation method for electric vehicle battery [D]. Liaoning University of Technology, 2016.
[3] Wang Yang, Jiang Yanning. Grey Elman Neural Network Prediction Model Based on Genetic Algorithm and Its Application[J]. Mathematics in Practice and Theory, 2017, 47(22):315-320.
[4] Zhang Qianyun. Port throughput prediction and fuzzy evaluation based on whale optimization algorithm [D]. Lanzhou University, 2018.
[5] Yao Zhen, Xu Jiping, Kong Jianlei, Liu Songbo. Research on river water level prediction method based on GA-Elman[J]. Journal of Yangtze River Scientific Research Institute, 2018, 35(09): 34-37.