2018 2nd International Conference on Modeling, Simulation and Optimization Technologies and Applications (MSOTA 2018) ISBN: 978-1-60595-594-0
Big Data Processing Method for Detection of Abnormity of Electric Meter
Xiang FANG
1,*, Dong XU
2, Ming LIU
2, Duo-lin WANG
2,
Qing HE
3and Fang-xing LIU
31
Qinghu Rising Sunshine Data Technology (Beijing) Co., Ltd, Beijing, China
2
University of Missouri, DBL, Columbia, Missouri, USA 3
National Institute of Metrology, Beijing, China
*Corresponding author
Keywords: Big data, Detection, Electric meter, Difference.
Abstract. The smart meters are more and more widely used in China. The detection of abnormity of electric meter and management is very important. It will lead to massive capital savings and monitoring of electricity using. The method of data filtering, processing, calculation, fitting and difference etc. is introduced based on true data of abnormity of electric meters in the paper. The research will be significant to the management and application of electric meters in China.
Introduction
Smart meters are smart terminals and data entry for smart grid. Smart meter has many kinds of application function including two-way multiple rate measurement, end user terminal real-time control, multiple data transmission modes and intelligent interaction etc. in order to adapt to smart grid. Building smart grid brings broad market needs of products on global smart meters such as electricity information collection and handling system etc.[1, 2]
The objective of the research is to do analysis to true electricity data which is collected from community. The abnormal information will be detected based on relevant methods. Then the abnormal meter will be found [3].
Data Analysis and Processing Method
Data Analysis and Processing
Problems Need to Be Solved. (1) Try best to extract the characteristics that affect the error of the meter through various methods of feature engineering.
(2) A regression model is established through the relationship between feature and error. Prediction test will be concentrated on a point / time error. The conclusion is whether the error is within the normal range of the meter. If not, is there any abnormity in the electric meter of community?
(3) If having abnormal electric meter, the meter will be found based on the electricity characteristic behavior model of single meter.
Data format and data cleaning. The difference between the total meter and the user meter is E.
(1)
There are two kinds of type error in collected data. They are duplicate values and illegal values. The solution is to replace the missing value with the whole point current voltage. Eventually data cleaning is finished through deleting error value and filling in missing values.
Data Formatting
[image:2.595.142.440.580.727.2]The following features are added to each date so as to do machine learning analysis easily. The detail is showed in Table 1.
Table 1. The added features.
Characteristics Explanation
Total meter data(super) Total meter current value
Error Total meter minus summary of user meter
Related date(com_date) Someday is base date 0. The number of days difference between 0 and the base date
Week Normalized 7 dimensional vector
Month Normalized 12 dimensional vector
Year Normalized 3 dimensional vector
Logarithmic value(log) The total meter is based on the logarithmic value of 2
Users(numbers) Total users of the date
Average current value(A_mean) Average current value of the date Average voltage(A_mean) Average voltage of the date
Pearson Correlation Coefficient Analysis. Correlation coefficients are analyzed between each dimension in order to give machine learning more directional suggestions [4].
K-fold Cross Validation. 5-fold cross validation is done to the collected data. 1/5 data are used to test. The other data are used to training. Different training set and test set of 5 groups can be obtained [5].
Feature Engineering and Fitting
Data Analysis
At same moment, the voltage situation of different users in the community is almost same. At the different date, the change trend of voltage is very similar.
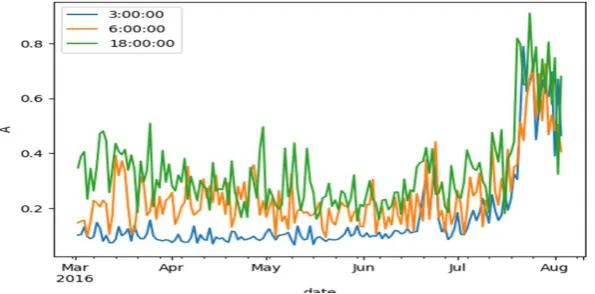
Then the current situation is analyzed. Broken line diagram of current at different times to appointed meter can be drawn. In Fig. 1, for example, 3am, 6am and 6pm current situation of one meter can be got in different times.
Figure 1. Current situation to appointed meter.
Outlier Analysis
Outlier should be eliminated in calculation and analysis. Otherwise the result will be affected greatly. The user's box diagram about voltage can be drawn through Python method in the research. The outliers in data batches can be identified through using box diagram [6].
Polynomial Fitting
The electricity value of individual user can be calculated by formula W=U*I*t summarizing. The value is deducted by the value of total meter. Then the error of testing can be obtained. The error value can be fitted through poly0 fit and drawn curve [7, 8].
Deep Learning Time Series Model
Long and short term memory (LSTM) model has certain advantages in dealing with timing problems. Because it predicts future values based on past values and past predicted values rather than using discrete features such as season only. The method leads to more stable model. The error in every step of the training process is accumulative. When there is an extreme mistake in one step, it may destroy the prediction quality of all subsequent steps.
In the research, the original data sets are transformed into data sets suitable for time series prediction. The data is processed and adapted to LSTM model for multivariate time series prediction problem. Then the result can be predicted and analyzed [9].
Time Series Data Preprocessing
Time step is an important super parameter in this model. LSTM executes back-propagation through time step when learning sequence prediction problems. Dedicated timing data set is prepared for LSTM model. This will touch using datasets as supervised learning problems. The supervised learning problem is assigned as below. Electric meter error for current time (t) is forecasted according to the total meter and other inputs of the previous time period. The electric meter error of the hour of next hour will be predicted by the electric meter yesterday and the forecast of next hour.
The data set is divided into training set and testing set. Then training set and testing set are divided into input and output variable respectively [10].
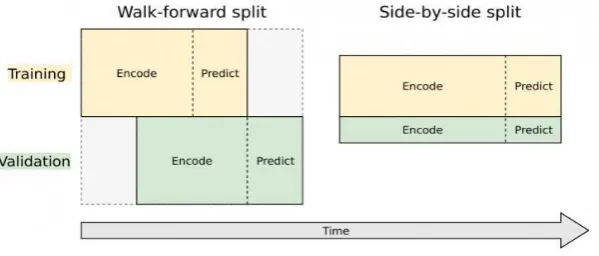
[image:3.595.151.451.537.665.2]Data Training. There are two methods to split training set and validation set in time problems. The method is showed in Fig. 2.
Figure 2. Method to split training set and validation set.
Walk-forward Split. The method does not split data actually in fact. The complete set of data sets is also used as training set and validation set at the same time. However, the validation set uses different timetables. Comparing to the timetable of training set, the timetable of validation set is ahead of one prediction interval.
The validation set based on walk-forward split in the model is used to optimize parameters only. The last prediction model must operate under completely uncorrelated data with training set and validation set.
Analysis and Anomaly Detection
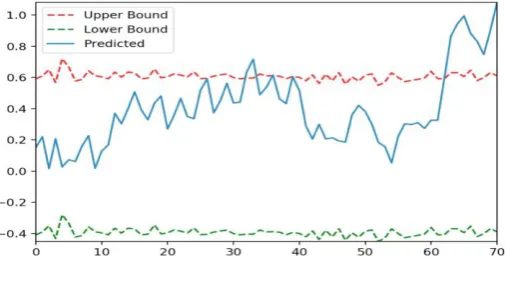
[image:4.595.139.442.199.390.2]Prediction Result. The prediction results of double-layer LSTM and single-layer LSTM are tested in Fig. 3.
Figure. 3. Data comparision between prediction and truth.
The predication is quite accurate in initial steps. The predicted value has a certain lag at the same time.
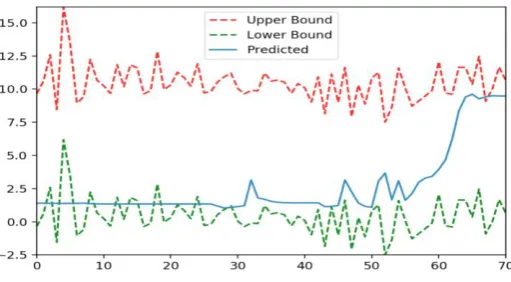
Anomaly Detection. Test with sliding windows is used. The sliding window with width 1 and threshold t is assigned. If the difference between prediction and truth is bigger than threshold to each sliding in sliding window, the error appears from the date. The result shows as Fig. 4 when window width is 4 and threshold is 0.5.
Figure 4. Calculated abnormal date.
In Fig. 4, data displays anomaly detection from the sixty-fifth day. Higher precision results can be got through the width and threshold adjustment.
[image:4.595.171.424.512.656.2]Figure 5. Prediction is within range.
Summary
The method discussed in the paper is effective and efficient. There is big room to develop the relevant method and application in electric meters domain.
Acknowledgement
This research was financially supported by the National Institute of Metrology.
References
[1] Wang Dewen, Yang Liping, Large data flow processing method and anomaly detection for smart grid, Automation of Electric Power System, Vol. 40, No. 14 (2016) 122-125.
[2] Liao Wenquan, Yang Jialong, Chen Chun, Yang Zewu, Bai Yong, Design of power consumption anomaly detection system based on big data analysis, Journal of Chongqing Electric Power College, Vol. 22, No. 6 (2017).
[3] Li Zhiqiang, Gao Dabing, Su Sheng, Wang Jiancheng, Chen Dandan, Big data based intrusion detection method of smart meters, Journal of Electric Power Science and Technology, Vol. 31, No. 1 (2016) 121-126.
[4] Wang Xinghua, Xu Xuanhao, Zhou Yawu, A power user load curve clustering algorithm based on Pearson correlation coefficient, Heilongjiang Electric Power, Vol. 39, No. 5 (2017) 397-401.
[5] Cui Xu, Application of K-Fold cross validation and BP neural network in library intelligent distribution, Inner Mongolia Science Technology & Economy, Vol. 176, No. 22 (2008).
[6] Luo Xiao, Ren Yong, Shan Xiuming, Mixed language programming based on Python and its implementation, Computer Application and Software, Vol. 24, No. 12 (2004) 17-18.
[7] Zhang Yongchang, Zhang Bingsen, Ding Haixia, Application of numerical analysis method based on polynomial fitting in color matching of fabric dyeing, Journal of Qingdao University(Engineering & Technology Edition), Vol. 25, No. 4 (2010) 28-32.
[8] Zhang Qian, Application of polynomial fitting in mathematical modeling, Peer, No.14 (2016) 340
[9] Chen Liang, Wang Zhen, Wang Gang, Application of LSTM network in short term power load forecasting under deep learning framework, Electric Power Information and Communication Technology, No. 5 (2017) 8-11.
[10] Guo Feng, Wang Bin, Liu Min, Research on time series prediction based on BP neural network,