2019 International Conference on Computation and Information Sciences (ICCIS 2019) ISBN: 978-1-60595-644-2
Finite Element Analysis of Origin Dynamic
Stiffness and Vibration Sensitivity of BIW
Wei Wang and Changcheng Yin
ABSTRACT
In this paper, Hyperworks software is used for geometric cleaning, meshing and grid quality checking of the BIW model. The BIW model is assembled with solder joint units, and then the dynamic stiffness of the joints is analyzed. The acceleration frequency response function (IPI) curve is obtained by simulating the body with the method of origin admittance. The dynamic stiffness deficiency is found by comparing with the dynamic stiffness curve of the target value. Vibration transfer function of the body is obtained by vibration sensitivity analysis, and the sensitive parts of the body under excitation are located more accurately. Some corresponding suggestions and optimization are put forward to improve the NVH performance of the body.
1. INTRODUCTION
The dynamic stiffness of the key points of the Body-Mount has an important influence on the vibration and fatigue failure of the BIW. It is measured at the level of the local dynamic stiffness of the joints in the frequency range concerned. The dynamic stiffness is inversely proportional to the input energy of the structure, so the dynamic stiffness of the key connection points needs to be large enough to reduce the input energy of the structure; too low the dynamic stiffness can easily cause greater vibration noise.
The sensitivity of the body vibration response the structural vibration characteristics of the body. Usually it is used to measure the vibration contribution
of each excitation point to a certain response point and the sensitivity of each response point under a certain excitation point vibration. Therefore, the above two performance indexes have a greater impact on the vehicle NVH performance, which is the first factor to be considered in the vehicle NVH analysis.
2. ESTABLISHMENT OF FINITE ELEMENT MODEL FOR BIW
[image:2.612.193.414.283.362.2]Figure 1, the finite element model includes 633322 nodes, 602513 shell elements, 13974 1D elements, 9419 solder joint units. The total number of triangular elements is 40730, and the triangle elements account for 6.76%, less than 10%.
Figure 1. Finite element model diagram of the BIW.
2.1 Solder Joints and Materials
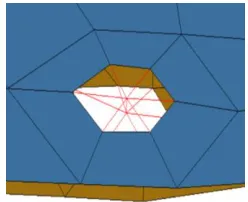
[image:2.612.133.257.545.646.2]RBE2 element is used to simulate the bolt connection of the BIW. The center of the circular hole is the independent node between the two bolt holes, and the peripheral nodes are the non-independent nodes to establish RBE2 element. The bolt connection is shown in Figure 2, and the distribution of the solder joints of the BIW is shown in Figure 3.
[image:2.612.316.478.547.649.2]Body sheet metal has its material and corresponding properties, sheet metal material is mild steel, solder joint material is common cold rolled steel (ST12), the specific parameters of its material properties are shown in Table I.
TABLE I. ATTRIBUTE TABLE OF BODY MATERIAL.
Material Modulus of elasticity(MPa) Poisson ratio Density t/mm3
Mild steel 210000 0.3 7.9E-09
Cold rolled steel 215000 0.3 7.85E-09
2.2 Grid quality check
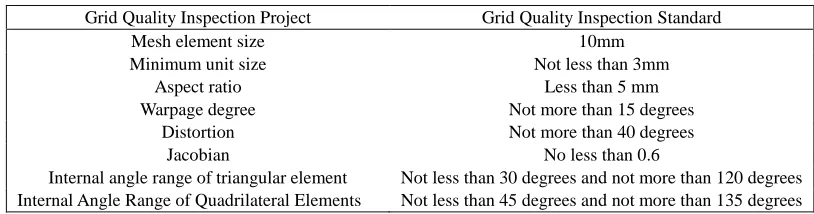
[image:3.612.92.499.404.511.2]The grid quality needs to meet the quality criteria first, and then following analysis can be reached. The higher the grid quality, the smaller the error of simulation analysis results. Quality standard inspection items as shown in Table II mainly include twist degree, warpage degree, Jacobian, aspect ratio, the proportion of triangular units and so on.
TABLE II. STANDARD TABLE FOR QUALITY INSPECTION OF BIW GRIDS.
Grid Quality Inspection Project Grid Quality Inspection Standard
Mesh element size 10mm
Minimum unit size Not less than 3mm
Aspect ratio Less than 5 mm
Warpage degree Not more than 15 degrees
Distortion Not more than 40 degrees
Jacobian No less than 0.6
Internal angle range of triangular element Not less than 30 degrees and not more than 120 degrees Internal Angle Range of Quadrilateral Elements Not less than 45 degrees and not more than 135 degrees
3.
LOCATION AND BOUNDARY CONDITIONS OF CONTACT
POINTS
structural damping is 0.06, and the acceleration response in corresponding directions is output.
Figure 4. The main attachment points.
4.
ANALYSIS AND EVALUATION OF DYNAMIC STIFFNESS
OF CONNECTION POINTS
[image:4.612.158.488.502.643.2]In the Y direction of left attachment point of engine mount, the peak acceleration exceeds the standard stiffness reference curve of 4000N/mm, and the dynamic stiffness of Y direction is insufficient. In addition, the Z direction is higher than the reference curve between 20 and 100 Hz. The response curve of X direction is basically below the reference curve of 4000N/mm, which meets the design requirements. In the Y direction of the right engine mount, the acceleration response is too large at 40 Hz and 80-110 Hz; in the Z direction, the response is too large at 20-40 Hz and 40-60 Hz, indicating that the dynamic stiffness is insufficient, while the X direction meets the design criteria, as shown in Figures 5 and 6.
Figure 5. Acceleration admittance IPI curve of engine left mount point.
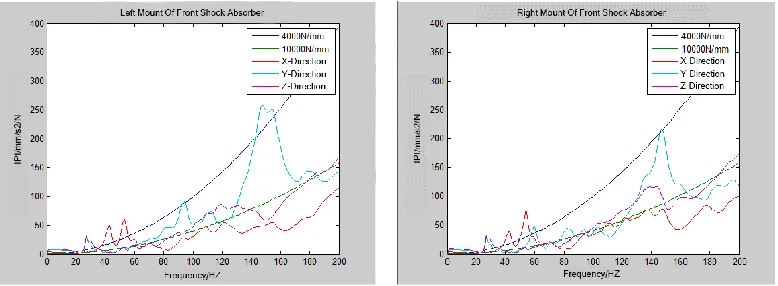
The attachment points of the front shock absorber are slightly higher than 4000N/mm in the frequency range of 40-60 Hz in the X direction. The dynamic stiffness of the other directions basically meets the design requirements, and the dynamic stiffness is enough to resist external excitation. Figures 7 and 8.
[image:5.612.104.493.223.366.2]The stiffness is enough to withstand deformation for a curve that is much lower than the target curve 104N/mm. It can be considered to reduce the material layout and reduce the stiffness appropriately to achieve lightweight.
Figure 7. Acceleration Admittance IPI Curve of Left Attachment Point of Shock
Absorber before Figure 9.
Figure 8. Acceleration Admittance IPI Curve of Right Attachment Point of Front
Damper.
The rest of the results will not be listed and displayed, and all the data can be summarized in Table III, which can intuitively see the non-compliance, and targeted optimization and improvement.
TABLE III. DYNAMIC STIFFNESS CALCULATION TABLE FOR KEY JOINTS OF AUTOMOBILE BODY.
X Y Z
Left connection point of front shock absorber × √ √
Right Connection Point of Front Shock Absorber × √ √
Left connection point of rear shock absorber √ × ×
Right Connection Point of Rear Shock Absorber √ × ×
Front suspension left mounting point √ √ √
Front Suspension Right Installation Point √ √ √
Front-left mounting point of rear suspension √ √ ×
Front and Right Installation Points of Rear Suspension √ √ ×
Right mounting point after rear suspension √ √ ×
Left Connection Point of Engine Mount × × ×
Right Connection Point of Engine Mount √ × ×
Left Connection Point of Exhaust Pipe Suspension √ √ ×
Exhaust pipe suspension right connection point √ √ ×
Transmission Suspension Connection Point √ √ ×
(√means that it meets the design criteria; ×means that it does not conform to the design criteria)
5. DISTRIBUTION OF EXCITATION AND RESPONSE POINTS
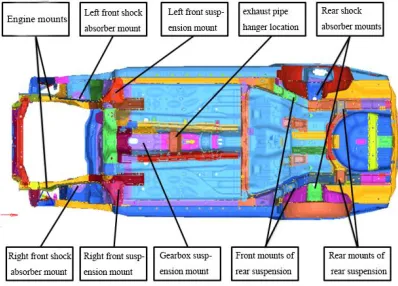
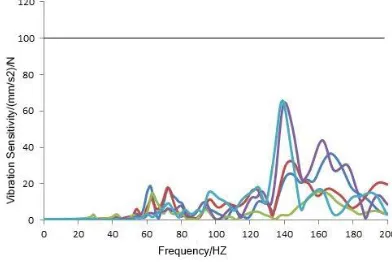
[image:6.612.112.480.85.159.2]The Optistruct module of Hyperworks software is used to calculate the vibration sensitivity of the body in white. Three directions of excitation force are applied to each vibration excitation point, and the output responses of five response points are calculated in this case.
Figure 9. X-Directional Vibration Transfer Function of Right Rear Suspension Shock
[image:6.612.103.286.293.429.2]Absorber Bearing.
Figure 10. Vibration transfer function of right rear suspension shock absorber bearing in Y on direct.
Figure 11. Z-directional Vibration Transfer Function of Right Rear Suspension Shock
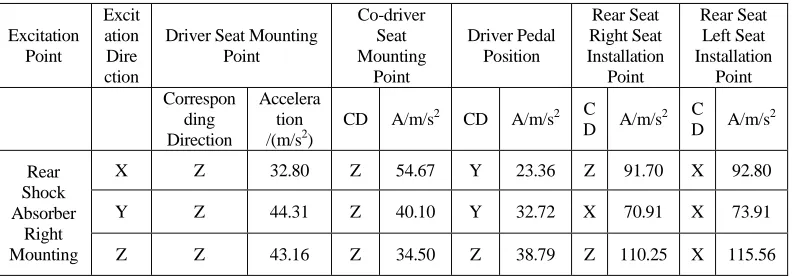
[image:6.612.299.495.299.430.2]From the analysis results of figs. 9, 10 and 11, it can be seen that the response acceleration of the right rear suspension shock absorber bearing under X and Y direction excitation is less than the target value; under Z direction excitation, the peak value of the vibration response at the installation point of the rear seat and the left seat is more than the target value of 100 (mm/s2)/N near 140 HZ. It can be considered to increase the damping to reduce the vibration response. The maximum response values of all directions are sorted out and listed in Table IV. The maximum response values and direction of each response point can be visually seen.
TABLE IV. MAXIMUM RESPONSE VALUE AND DIRECTION OF EACH RESPONSE POINT UNDER POINT EXCITATION OF RIGHT REAR SUSPENSION SHOCK ABSORBER.
Excitation Point Excit ation Dire ction
Driver Seat Mounting Point Co-driver Seat Mounting Point Driver Pedal Position Rear Seat Right Seat Installation Point Rear Seat Left Seat Installation Point Correspon ding Direction Accelera tion /(m/s2)
CD A/m/s2 CD A/m/s2 C
D A/m/s
2 C
D A/m/s
2 Rear Shock Absorber Right Mounting
X Z 32.80 Z 54.67 Y 23.36 Z 91.70 X 92.80
Y Z 44.31 Z 40.10 Y 32.72 X 70.91 X 73.91
Z Z 43.16 Z 34.50 Z 38.79 Z 110.25 X 115.56
6. CONCLUSIONS
Based on the analysis of the dynamic stiffness of the key joints of the body, the dynamic characteristics and structural vibration performance of the key joints of the BIW are evaluated with the derived formulas and principles. The weak points of vibration transmission are found through the list arrangement, which provides direction for reducing the vibration of the BIW.
REFERENCES
1. Jian Pang, Gang Jian, Hua He. 2006. “Automobile Noise and Vibration: Theory and Application,” Beijing: Beijing University of Technology Press, 2006.
2. Shouyuan Zhang, Yimin Zhang, Yun Dai, Lei Shen. 2010. “Dynamic stiffness analysis of body joints and NVH performance improvement,” Automotive technology, 10:26-29.
3. Wanli Lou, Xiao Wang, Huixia Liu, et al. 2014. “Dynamic stiffness optimization analysis of the attachment point of the minibus BIW,” Mechanical design and manufacturing, 2014 (1): 217-219.
4. Peipei Yang, Wei Qian, Dawei Gao, et al. 2016. “Optimal design of NVH for a pure electric vehicle body,” Agricultural Equipment and Vehicle Engineering, 54 (6): 1-5.
5. Yuqing Gu, Junpeng Li, Liping Gao, et al. 2012. “Dynamic stiffness test analysis of connecting points of car subframe,” Mechanical research and application, 2012(6): 71-73.
6. Dhanaji Kalsule, David Hudson, 2011. “Yogesh Yeola and Jakir Bohari. Structure Borne Noise and Vibration Reduction of a Sports Utility Vehicle by Body-Mount Dynamic Stiffness Optimization,” SAE Paper 2011 -01-1599.
7. Hong-Sun Baik and Seung-Gyoon Jung, Yeon-Jun Kang. 2007. “The Study on the Optimization of Attachment Stiffness in Vehicle Body,” SAE Paper 2007-01-2346.
8. Kichang Kim and Inho Choi. 2003. “Design Optimization Analysis of Body Attachment for NVH Performance Improvements,” SAE Paper 2003-01-1604.
9. Mark Allen Daly. 2003. “Influence of Mount Stiffness on Body/Subframe Acoustic Sensitivities,” SAE Paper 2003-01-1714.