2018 2nd International Conference on Applied Mathematics, Modeling and Simulation (AMMS 2018) ISBN: 978-1-60595-580-3
Mathematic Model on Distribution Line Reliability
Under Typhoon Weather
Hai-tao LI
1, Jian-wei WU
2, Jian-feng WEN
1and Xue-jiao HAN
3,*1
Guangdong Power Grid Co., Ltd Guangdong 510000, China
2
Jiangmen Power Supply Company of Guangdong Power Grid Co., Ltd Guangdong 529000, China
3
Tsinghua University, Beijing 100084, China
*Corresponding author
Keywords: Distribution line, Load, Component failure, Reliability.
Abstract. Distribution line reliability under typhoon weather is studied in the paper. Firstly, the probability density of wire and concrete pole bending strength is studied. Then, a distribution line reliability model with consideration of typhoon wind speed and wind direction is established. When wind speed and wind direction under typhoon weather are known, the load reliability of wire and pole is obtained according to wire tensile strength probability density function and pole bending strength probability density function. Line is equivalent to component series model for obtaining overhead distribution line reliability. The line load risk level is reflected.
Introduction
Typhoon is formed in Tropical Ocean at latitude between 5 and 26 degrees. It moves at the speed of 5-50km/h as a whole during counterclockwise rotation around the typhoon center, and wind speed and wind direction are changed at any time in the places swept by typhoon [1-3]. Meanwhile, wind load on the distribution line in the wind field is also changed accordingly. In recent years, power system failure brought by strong disastrous typhoon weather is also more and more frequent with environment deterioration. Though design standard of overhead distribution line has been improved in some regions, typhoon wind speed is higher than the design wind speed sometimes. The research on overhead distribution line reliability parameter model under typhoon weather is still rare at present [4-7]. It is necessary to establish an overhead distribution line reliability model under typhoon weather according to actual weather information and line design condition, thereby reflecting pole falling and wire breaking probability of distribution line under real time weather conditions. Early warning information is provided for operators, emergency plans can be adopted timely, thereby ensuring safe operation of power distribution system. Line single-element load effect is calculated according to real-time weather information on the basis of structure reliability principle in the paper. An overhead distribution line time varying load reliability model is established on the basis of line component strength probability density function and load effect.
Random Change of Line Single-Element Strength
Whether line component failure is related to component own strength and load applied on the component (or force). Structure strength refers to the ability of the structure to resist external force damage. The strength of line component is generally uncertain in actual engineering production due to manufacturing technology, material mechanical performance, size error and reasons in other aspects. Therefore, whether the component validity is also certain when it bears certain external load.
section. Pole strength generally refers to pole bending strength, namely the ability of the pole to resist bending without breaking.
The bending strength of commonly used concrete pole in the distribution line is relatively scattered due to uncertainty in manufacturing error, construction technology, etc. The average value of concrete pole bending strength is slightly higher than the carrying capacity checking bending moment generally, the bending strength is in line with normal distribution, and the probability density function of concrete pole bending strength can be expressed as follows:
(1) In the formula, , refers to mean value of concrete pole bending strength, value can be obtained through actual operation experience or destructive experiment. refers to carrying capacity checking bending moment of concrete pole, N ; refers to standard deviation of concrete pole bending strength, and refers to variation coefficient, which can be obtained through actual operation experience or destructive experiment.
Unreliability Calculation of Overhead Distribution Line Single-element Load
When load effects of line component strength and component are known, performance function can be adopted for calculating the load reliability of the component under external load role. Line component state can be expressed with performance function according to structure reliability theory:
Z=g(X)=g(X1,X2,X3,...,Xn) (2) Wherein, X=(X1,X2,X3,...,Xn)T is n basic variables to describe the component state, Xi(i=1,2,3,...,n) refers to line mechanical parameter, undertaken role, etc. The component states can be divided into three categories according to the value of structure performance function: reliable state, limiting state and invalid state.
When the component is in reliable state, the performance function can be expressed as follows:
Z=g(X1,X2,X3,...,Xn)>0 (3) When the component is in limiting state, the performance function can be expressed as follows:
Z= g(X1,X2,X3,...,Xn)=0 (4) When the component is in invalid state, the performance function can be expressed as follows:
Z= g(X1,X2,X3,...,Xn)<0 (5) Therefore, component load reliability refers to the probability of component in the reliable state:
Pr=P{Z= g(X1,X2,X3,...,Xn)>0} (6) Basic variable of component state is described into continuous variable generally. Therefore, performance function also belongs to continuous function, the probability of component in the limiting state is zero, and reliable and invalid states of the component are considered only:
Pr+Pf=1 (7) Wherein, Pr refers to component load reliability; Pf refers to component load unreliability.
Basic variables for describing component state in performance function can be divided into two categories, namely component strength variable and load effect variable. Performance function can be expressed as follows:
Wherein, R refers to component strength, and it is usually random variable following certain distribution. S refers to component internal effect caused by wind load, namely stress which is related to wind speed and wind direction.
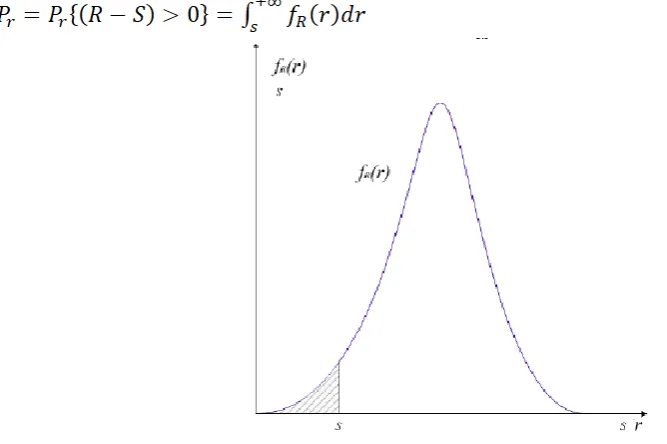
Wind speed and wind direction of different points in the typhoon wind field can be predicted and simulated. Therefore, the wind load effect of component structure affected by typhoon also should be predicted. The uncertainty of predicting wind speed and wind direction is not considered in the distribution line component load reliability model under typhoon weather established in the paper. Wind speed and wind direction are fixed values at the prediction time point. Component internal effect S is also a fixed value. Probability density function of component strength R is set as fR(r), the relationship of component strength probability density function and load effect is shown in figure 1. The vertical coordinate in the figure refers to the value of probability density function, the abscissa expresses the load effect or component strength, the shady part area in the figure represents the probability of component strength lower than load effect. Therefore, line component reliability is shown as follows:
[image:3.595.73.407.284.506.2](9)
Figure 1. Sketch map of component strength random variable and load effect.
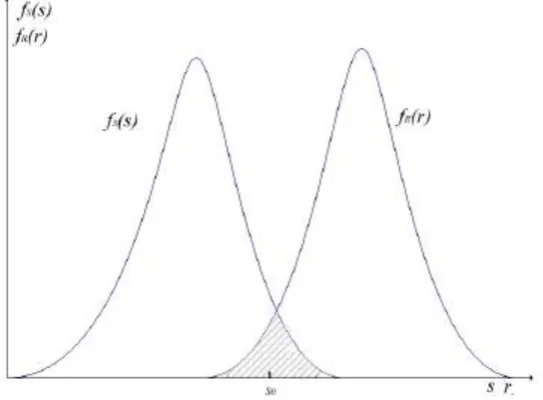
Different wind speeds should be considered in structure planning and design. Wind speed or wind direction is a random variable under the condition, and component internal effect caused by wind load is also a random variable. Load effect S probability density function is set as fS(s), namely the relationship between component strength probability density function and load effect probability density function is shown in figure 2. There is a cross area of strength probability density function and load effect probability density function (shady part in the figure), it is obvious that component strength may be smaller than load effect, namely component is prone to failure. One load effect value s0 is selected in the cross area scope, namely the probability of component load effect falling in the value neighborhood is shown as follows:
(10) Probability of the component strength higher than load effect is shown as follows:
(11)
(12) Therefore, component load reliability calculation formula is shown as follows aiming at any value of load effect:
[image:4.595.164.436.212.412.2](13) The most important components in overhead distribution line include wire concrete pole. The wire and pole unreliability should be analyzed during calculation of overhead distribution line load unreliability.
Figure 2. Sketch map of load effect random variable and strength random variable.
In summary, When prediction wind speed and wind direction under typhoon weather are known,
after wire stress g and pole root bending moment MT are obtained according to calculation in the first section, wire tensile strength probability density function and pole bending strength probability density function in the first section are combined. Wire and pole load reliability is respectively shown as follows:
(14)
(15) The load unreliability of wire and pole is respectively shown as follows:
(16)
(17)
Reliability Model of Overhead Distribution line
Component failure probability obtained according to calculation refers to single wire and pole failure probability at each grade. Line normal operation condition is shown as follows: wire and pole are normally operated. Therefore, the line is equivalent to component series model as shown in Figure 3:
Figure 3 Distribution line component series model
Overhead distribution line reliability P can be calculated according to the following formula:
(18) Wherein, Pi refers to the reliability of ith component.
Since the most important failure forms of overhead distribution line under typhoon weather are pole falling and wire breaking, the reliability obtained from formula (18) reflects line load risk level.
Summary
Structure reliability theory is applied in the paper to establish distribution line load reliability model under typhoon weather. Time-independent line unreliability is calculated according to change of external weather factors. Basic component reliability model and timely warning information are provided for power distribution system operation risk evaluation under typhoon weather, concrete line parameter is combined for calculation to obtain reliability parameter, which can reflect pole falling and wire breaking risk level of power distribution system under typhoon weather.
References
[1] Liu K, Shen C, Louie K. A 1, 000- Year History of Typhoon Landfalls in Guangdong Southern China Reconstructed from Chinese Historical Documentary Records [J]. Annals of the Association of American Geographers, 2001, 91(3): 453-464.
[2]Lianshou C, Zhiyong M. An Overview on Tropical Cyclone Research Progress in China during the Past Ten Years [J], Chinese Journal of Atmospheric Sciences, 2001, 3: 012.
[3]Batts M E, Simiu E, Russell L R. Hurricane wind speeds in the United States [J]. Journal of the Structural Division, 1980, 106 (10): 2001-2016.
[4] Shapiro L J. The asymmetric boundary layer flow under a translating hurricane [J]. Journal of the Atmospheric Sciences, 1983, 40 (8): 1984-1998.
[5]Meng Y, Matsui M, Hibi K. An analytical model for simulation of the wind field in a typhoon boundary layer [J]. Journal of wind engineering and industrial aerodynamics, 1995, 56(2): 291-310.
[6] Bhuiyan M R, Allan R N. Inclusion of weather effects in omposite system reliability evaluation using sequential simulation[J]. IEEE Proceedings-Generation, Transmission and Distribution, 1994, 141(6): 575-584.