Circulating levels of IGF-1 directly regulate
bone growth and density
Shoshana Yakar, … , Yves R. Boisclair, Derek LeRoith
J Clin Invest.
2002;
110(6)
:771-781.
https://doi.org/10.1172/JCI15463
.
IGF-1 is a growth-promoting polypeptide that is essential for normal growth and
development. In serum, the majority of the IGFs exist in a 150-kDa complex including the
IGF molecule, IGF binding protein 3 (IGFBP-3), and the acid labile subunit (ALS). This
complex prolongs the half-life of serum IGFs and facilitates their endocrine actions. Liver
IGF-1–deficient (LID) mice and ALS knockout (ALSKO) mice exhibited relatively normal
growth and development, despite having 75% and 65% reductions in serum IGF-1 levels,
respectively. Double gene disrupted mice were generated by crossing LID+ALSKO mice.
These mice exhibited further reductions in serum IGF-1 levels and a significant reduction in
linear growth. The proximal growth plates of the tibiae of LID+ALSKO mice were smaller in
total height as well as in the height of the proliferative and hypertrophic zones of
chondrocytes. There was also a 10% decrease in bone mineral density and a greater than
35% decrease in periosteal circumference and cortical thickness in these mice. IGF-1
treatment for 4 weeks restored the total height of the proximal growth plate of the tibia. Thus,
the double gene disruption LID+ALSKO mouse model demonstrates that a threshold
concentration of circulating IGF-1 is necessary for normal bone growth and suggests that
IGF-1, IGFBP-3, and ALS play a prominent role in the pathophysiology of osteoporosis.
Article
Endocrinology
Find the latest version:
Introduction
The IGFs are growth-promoting polypeptides that play essential roles in growth and development. In vivo, the IGFs are bound to a family of six structural-ly and evolutionaristructural-ly related IGF binding proteins (IGFBP1 through IGFPB6) (1). In serum, the majori-ty (70–80%) of the IGFs exist in a 150-kDa complex comprised of one IGF molecule, IGFBP-3, and the acid labile subunit (ALS). A smaller proportion (∼20%) of the IGFs are associated with other serum IGFBPs within a 50-kDa complex, and less than 5% of the IGFs are found in the free form of 7.5 kDa. ALS is a protein that binds to the IGF/IGFBP-3 binary com-plex, primarily in serum. Association with ALS
prolongs the t1/2of serum IGFs and facilitates their endocrine actions. Compared with other IGF-IGFBP complexes, the ternary IGF/IGFBP-3/ALS complex is thought to cross the capillary barrier very poorly (2, 3). The ternary complex is not detectable in the lymph, nor has ALS been found in extravascular flu-ids. This suggests that ALS plays a significant role in regulating the passage of IGFs from the circulation into the extravascular compartment, thereby modu-lating its biological activities. The liver is the princi-pal source of circulating IGF-1, IGFBP-3, and ALS, which are synthesized by hepatocytes in a manner dependent on growth hormone (GH) (4, 5). IGF-1 is also expressed by all nonhepatic tissues, where it acts in a paracrine/autocrine fashion.
In order to better understand the endocrine versus the autocrine/paracrine roles of IGF-1 in growth and devel-opment, we previously used the Cre/loxPsystem to gen-erate liver IGF-1–deficient (LID) mice (6). The LID mice grew and developed normally, despite a 75% reduction in serum IGF-1 levels (6). Expression of IGF-1 in non-hepatic tissues was normal, suggesting that the normal growth exhibited by these animals was mediated by autocrine/paracrine actions of IGF-1, as well as by some nonhepatic sources of circulating IGF-1.
Circulating levels of IGF-1 directly regulate
bone growth and density
Shoshana Yakar,
1Clifford J. Rosen,
2Wesley G. Beamer,
2Cheryl L. Ackert-Bicknell,
2Yiping Wu,
1Jun-Li Liu,
3Guck T. Ooi,
4Jennifer Setser,
1Jan Frystyk,
5Yves R. Boisclair,
6and Derek LeRoith
11Section on Cellular and Molecular Physiology, Clinical Endocrinology Branch, National Institute of Diabetes and Digestive
and Kidney Diseases, National Institute of Health, Bethesda, Maryland, USA
2The Jackson Laboratory, Bar Harbor, Maine, USA
3Department of Medicine, Royal Victoria Hospital and McGill University, Montreal, Quebec, Canada 4Prince Henry’s Institute of Medical Research, Clayton, Victoria, Australia
5Institute of Experimental Clinical Research, Aarhus University Hospital, Aarhus, Denmark 6Department of Animal Science, Cornell University, Ithaca, New York, USA
IGF-1 is a growth-promoting polypeptide that is essential for normal growth and development. In serum, the majority of the IGFs exist in a 150-kDa complex including the IGF molecule, IGF binding protein 3 (IGFBP-3), and the acid labile subunit (ALS). This complex prolongs the half-life of serum IGFs and facilitates their endocrine actions. Liver IGF-1–deficient (LID) mice and ALS knockout (ALSKO) mice exhibited relatively normal growth and development, despite having 75% and 65% reductions in serum IGF-1 levels, respectively. Double gene disrupted mice were generated by cross-ing LID+ALSKO mice. These mice exhibited further reductions in serum IGF-1 levels and a signifi-cant reduction in linear growth. The proximal growth plates of the tibiae of LID+ALSKO mice were smaller in total height as well as in the height of the proliferative and hypertrophic zones of chon-drocytes. There was also a 10% decrease in bone mineral density and a greater than 35% decrease in periosteal circumference and cortical thickness in these mice. IGF-1 treatment for 4 weeks restored the total height of the proximal growth plate of the tibia. Thus, the double gene disruption LID+ALSKO mouse model demonstrates that a threshold concentration of circulating IGF-1 is nec-essary for normal bone growth and suggests that IGF-1, IGFBP-3, and ALS play a prominent role in the pathophysiology of osteoporosis.
J. Clin. Invest.110:771–781 (2002). doi:10.1172/JCI200215463.
Received for publication March 15, 2002, and accepted in revised form July 9, 2002.
Address correspondence to:Derek LeRoith, Clinical
Endocrinology Branch, NIDDK, NIH, Room 8D12, Building 10, Bethesda, Maryland 20892-1758, USA. Phone: (301) 496-8090; Fax: (301) 480-4386; E-mail: [email protected].
Conflict of interest:No conflict of interest has been declared.
In another previous study, ALS knockout (ALSKO) mice were generated using a target gene inactivation strategy (7). ALSKO mice exhibited a marked reduction in circulating IGF-1 and IGFBP levels. Presumably, this was due to increased degradation of these proteins, which occurs in the absence of ALS. Despite a 65% reduction in circulating IGF-1 levels, the ALSKO mice demonstrated only about a 10% reduction in body weight. This finding is consistent with the idea that locally synthesized IGF-1 plays a predominant role in body growth, either in an autocrine/paracrine fashion or via the circulation.
The present study aimed to clarify the endocrine ver-sus autocrine/paracrine roles of IGF-1 in growth and development by further diminishing serum IGF-1 con-centrations. To do this, we crossed LID mice with ALSKO mice, creating double-knockout LID+ALSKO mice. Serum levels of IGF-1 were reduced to about 10–15% of normal levels in these animals. GH levels were markedly increased and linear growth was severely atten-uated in LID+ALSKO mice. Circulating levels of IGF-1 appear to play a major role in bone remodeling and have a direct impact on linear bone growth, as shown by vari-ous skeletal parameters evaluated in this study.
Methods
Animal husbandry and genotyping. The generation and genotyping of LID (with a mixed genetic background of FVB/N, C57BL, and 129Sv) and ALSKO mice (with a mixed genetic background of BALB/c and 129Sv) has been described previously (6, 7). LID and ALSKO mice were crossed to create a double gene disruption of both the Igf-1gene in the liver and the Alsgene. All proce-dures were approved by the Animal Care and Use Com-mittee of the National Institute of Diabetes and Diges-tive and Kidney Diseases, NIH.
Animal crossing strategy for generation of LID+ALSKO mice. LID mice were crossed with ALSKO mice to generate the double gene disrupted LID+ALSKO mice. Crossing of males and females from the F2 generation gave rise to four different genotypes within the same litter. Control mice, which are homozygous for the Igf-1floxed allele, carry an intact Alsgene (Als+/+), and do not carry the Alb -Cretransgene. LID mice, which are homozygous for the Igf-1floxed allele, carry the Alb-Cretransgene and carry an intact Als gene (Als+/+). ALSKO mice, which are homozygous for the Igf-1floxed allele, have two Alsnull alleles (Als–/–) and do not carry the Alb-Cretransgene.
LID+ALSKO mice, which are homozygous for the Igf-1
floxed allele, carry the Alb-Cretransgene and have two Alsnull alleles (Als–/–). Mice that were heterozygous for any of the Alsor floxed Igf-1alleles were not included in the study. No difference was observed between mice that carried one or two copies of the Cretransgene. The above four genotypes represent the mice that were used throughout this study.
Growth and development. Growth was determined by measuring body weight and body length (nose to anus) of mice at weekly intervals from birth to 8 weeks of age.
Bone length (femur and tibia) was measured from x-ray radiographs of animals from 3 weeks to 10 weeks after birth. Measurements of femur length were also obtained by peripheral quantitative computerized tomography (pQCT; see below) at 6 weeks of age. Ani-mals were grouped according to their genotypes.
Hormone levels in serum. Blood was collected from the retro-orbital sinus of 6- to 8-week-old male mice. Serum insulin levels were measured using a rat insulin RIA kit with a sensitivity of 0.1 ng/ml (Linco Research Inc., St. Charles, Missouri, USA). Serum concentra-tions of GH and IGF-1 were determined using RIA kits with sensitivities of 0.3 ng/ml and 0.02 ng/ml, respec-tively (National Hormone and Pituitary Program, Har-bor-UCLA Medical Center, Torrance, California, USA), as shown in Figure 1a and the first paragraph of Results. To determine the concentration of free IGF-1, sera from 3–4 mice from the same litter and genotype were pooled. All samples were analyzed in duplicate as described previously (8) and presented under the Results section Serum levels of free IGF-1. In brief, serum samples were adjusted to pH 7.4 by being gassed with CO2. Aliquots of 400 µl were then applied to Amicon YMT30 membranes and MPS-1 supporting devices (Millipore Corp., Beverly, Massachusetts, USA), incu-bated for 30 minutes at 37°C, and centrifuged at 350 gat 37°C (Rotixa/RP; Hettich Zentrifugen, Tuttlingen, Germany). Serum-free IGF-1 levels were determined directly from the ultrafiltrates by RIA using a poly-clonal rabbit antibody (Nichols Institute Diagnostics, San Clemente, California, USA) and recombinant human IGF-1 as a standard (Amgen Inc., Thousand Oaks, California, USA).
camera magnification of ×20. All histological measure-ments were performed within the central two-thirds of the growth plate sections. Heights of the different zones of chondrocytes were measured parallel to the chon-drocyte columns using the MacBAS version 2.5 pro-gram (Koshin Graphic Systems, Sapporo, Japan). Four measurements were taken from each sample. Three or more cells aligned with the long axis of the bone were presumed to be proliferative. The proliferative zone was measured from chondrocytes at the top of the column to the point where cells greater than 10 µm in height were detected. The hypertrophic zone was measured from the end of the proliferative zone to the point where vascular invasion began. The height of the resting zone was defined by subtraction of the proliferating and hypertrophic zones from the total growth plate height.
pQCT. Total bone mineral density (BMD) was
meas-ured in the mid-diaphyseal shaft of the femur using pQCT adapted for mouse bones (Stratec XCT 960M;
Norland Medical Systems Inc., Fort Atkinson, Wiscon-sin, USA), as described previously (10). Isolated femurs were scanned at 2-mm intervals over their entire lengths. Total BMD values were calculated by dividing the total mineral content at the mid-diaphyseal shaft by the appropriate bone volume and were expressed in mg per mm3. Femoral periosteal circumferences and cortical thicknesses were calculated at the midpoint of the dia-physis. Calibration of the densitometer was performed with a set of hydroxyapatite standards (0.050–1.0 mg/mm3), yielding a correlation coefficient of 0.997 between standards and the pQCT estimation of density. Confirmation of calibration was confirmed on a daily basis, using a phantom of known density. Precision of the XCT 960M for repeated measurements of femoral BMD was 1.2%. The coefficient variance for progenitor strains ranged between 2.8% and 3.1% for total BMD.
Microcomputed tomography. We used a high-resolution
[image:4.576.79.515.293.606.2]desktop microtomographic imaging system (µCT20
Figure 1
Serum levels of IGF-1, IGFBPs, GH, and insulin in control, ALSKO, LID, and LID+ALSKO mice. (a) Serum was treated with acid/ethanol to remove IGFBPs. Total IGF-1 was determined by RIA (provided by the National Hormone and Pituitary Program) in single serum samples from control (Ctl) mice (n= 23), ALSKO mice (n= 36), LID mice (n= 21), and LID+ALSKO mice (n= 61). *P< 0.01 compared with control mice. †P< 0.01 compared with LID or ALSKO mice. (b) GH levels were determined in the serum of control mice (n= 9), ALSKO mice
(n= 11), LID mice (n= 10), and LID+ALSKO mice (n= 28). (c) Serum insulin levels, measured in the fed state, were determined in the serum of control mice (n= 12), ALSKO mice (n= 10), LID mice (n= 17), and LID+ALSKO mice (n= 35) (d) Upper panel shows a representative lig-and blot assay performed on sera from control, ALSKO, LID, lig-and LID+ALSKO mice. Serum proteins were separated by 4–20% SDS-PAGE and IGFBPs were detected by incubating the blots with 125I–IGF-1, as described in Methods. The graph shows quantification of 125I–IGF-1
and µCT40; Scanco Medical AG, Bassersdorf, Switzer-land) to evaluate the BMD and morphology of the entire femur, including the cortical midshaft and tra-becular distal femur. For evaluation of the mid-dia-physeal cortical bone, the bone was scanned with 18 slices at a resolution of 6 µm in a 1-mm-thick region at the mid-diaphysis. Mean values for cortical
thick-ness (µm), circumference (mm), and bone volume
(mm3) were calculated for each mouse. The images
were stored in three-dimensional arrays. The distal metaphyseal regions were scanned for 100 slices at a resolution of 12 µm just proximal to the growth plate, and mean values for trabecular bone volume and total volume were calculated for each mouse. Morphomet-ric parameters were computed using a direct three-dimensional approach that does not rely on any assumptions about whether the underlying structure is either plate- or rod-like (11).
Quantitative real-time PCR. Bilateral femurs and tib-iae were collected and ground under liquid nitrogen. RNA was extracted using an RNAgents kit (Promega Corp., Madison, Wisconsin, USA) according to the manufacturer’s instructions. The RNA was treated with DNase I (Ambion Inc.) for 30 minutes at 37°C and further purified using RNeasy spin columns (Qiagen Inc., Valencia, California, USA) according to the manufacturer’s instructions. Samples containing
2 µg of RNA were converted to cDNA in a reverse
transcription reaction using Superscript II (Invitro-gen Corp.) and random hexamers as primers. The
for-ward primer sequence used was 5′-
GCTCTGCTTGCT-CACCTTCAC-3′ and the reverse primer sequence
was 5′-CTCGGTCCACACACGAACTG-3′. The probe
se-quence was 5′-ccaccacagctggaccagagaccct-3′. The
label was FAM and the quencher was TAMRA. Con-trol primers and probe for 18S rRNA were used as ref-erences in each reaction labeled with VIC and using TAMRA as a quencher (Applied Biosystems, Foster City, California, USA). The reaction mixture con-tained 3.2 µl of double distilled H2O, 5 µl of TaqMan Universal PCR Master Mix (Applied Biosystems), 0.5
µl of control primers and probe (premixed by the
manufacturer [Applied Biosystems]), 0.45 µl of 20
mM forward and reverse primers, 0.0125 ml of 100
mM stock TaqMan probe, and 1 µl of cDNA from the
RT reaction. Cycling conditions were: 2 minutes holding at 50°C, 10 minutes holding at 50°C, and 40 cycles at 95°C for 15 seconds and 60°C for 1 minute. Statistical analysis. Statistical analyses were performed using StatView 4.5 (SAS Institute Inc., Cary, North Car-olina, USA) software. Unpaired Student ttests were used to compare hormone levels between groups. Skeletal parameter comparisons (pQCT and micro-computed tomography) were performed using two-way ANOVA. All values are reported as mean ± SEM, and statistical significance was accepted at P< 0.05.
Results
The effect of double gene disruption on circulating hormone lev-els. IGF-1 levels in sera were determined by RIA (Nation-al Hormone and Pituitary Program), as shown in Fig-ure 1a. As reported previously, LID mice showed a 75% reduction in circulating IGF-1 levels (34 ± 7 ng/ml as compared with control mice 137 ± 8 ng/ml). Similarly, the ALSKO mice showed a 65% reduction in circulating IGF-1 levels (45 ± 4 ng/ml) compared with control mice. Disruption of both the liver Igf-1and Alsgenes in LID+ALSKO mice resulted in a decrease of 85–90% in circulating IGF-1 levels (21 ± 1.7 ng/ml). Circulating IGF-1 levels negatively feed back to inhibit GH secre-tion. Thus, we also assessed the effects of reduced serum IGF-1 levels on serum GH levels. As shown in Figure 1b, mean GH levels in male LID mice were ele-vated by approximately 4.5-fold compared with control mice. GH levels were even further elevated in the dou-ble gene disrupted LID+ALSKO mice, by about 15-fold compared with control and ALSKO mice. Serum insulin levels in LID mice were elevated by approxi-mately threefold compared with control mice (Figure 1c), which is consistent with our previous study (6). In contrast, ALSKO mice exhibited normal serum insulin levels. Interestingly, there was an even further elevation in serum insulin in LID+ALSKO mice, to about fivefold higher than control levels (Figure 1c).
[image:5.576.56.292.53.219.2]Serum levels of IGFBPs. We next determined the effect of the double knockout in LID+ALSKO mice on serum IGFBPs. Western ligand blot analysis revealed the Figure 2
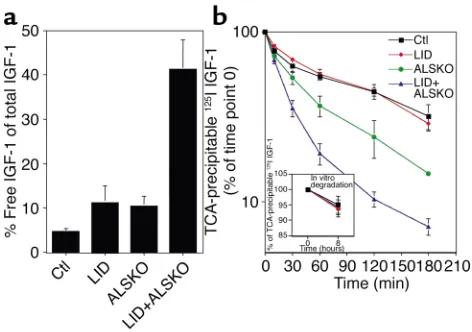
Serum levels of free IGF-1 and clearance studies. (a) Levels of total IGF-1 and free IGF-1 were measured by RIA in the same serum sam-ples. Graph shows free IGF-1, expressed as a percentage of total IGF-1, in control (n= 6 samples, drawn from a tube containing 23 pooled samples), LID (n= 5 from 19 pooled samples), ALSKO (n= 9 from 35 pooled samples), and LID+ALSKO mice (n= 9 from 64 pooled samples). (b) Serum clearance of 125I–IGF-1 in the various
genotypes. Serum was obtained from the retro-orbital vein at the intervals shown after 125I–IGF-1 was injected into control (n= 3), LID
(n= 3), ALSKO (n= 3), and LID+ALSKO (n= 3) mice. The percent-age of TCA-precipitable 125I is expressed as the ratio of
TCA-precip-itable 125I at an indicated time divided by TCA-precipitable 125I at 0
time point. Inset shows in vitro degradation of 125I–IGF-1 protein,
presence of four distinct bands corresponding to IGFBP-3 (45 kDa), IGFBP-2 (34 kDa), IGFBP-1 (29 kDa), and IGFBP-4 (24 kDa) (6). Quantification of
125I–IGF-1 bound to the IGFBP-3 band showed
dra-matic reductions in IGFBP-3 levels in both ALSKO and LID mice, and IGFBP-3 levels were reduced even fur-ther in LID+ALSKO mice (Figure 1d). IGFBP-3 mRNA levels in livers of LID, ALSKO, and LID+ALSKO mice did not differ significantly from those in control mice (Figure 1e), despite the high levels of GH in the serum of LID and LID+ALSKO mice. These results suggest that the reduction in IGFBP-3 levels is due to degrada-tion of the IGFBP-3 protein and that GH does not directly regulate IGFBP-3 mRNA expression in mice. Serum levels of free IGF-1Since we observed a marked reduction in IGFBPs in the sera of LID, ALSKO, and the double gene disrupted LID+ALSKO mice, we next deter-mined the levels of free IGF-1. Serum levels of free IGF-1 were determined in pooled sera, followed by RIA using a polyclonal rabbit antibody (versus the RIA sup-plied by the National Hormone and Pituitary Program, which was analyzed by single sample). The mean value of free IGF-1 determined by later assay was 6.3 ± 0.9 ng/ml in control mice (total IGF-1, 151.4 ng/ml), 9.4 ± 3 ng/ml in LID mice (total IGF-1, 85.2 ng/ml), and 6.8 ± 4.4 ng/ml in the ALSKO mice (total IGF-1, 74.8 ng/ml). However, the mean serum level of free IGF-1 in the LID+ALSKO mice was 22.3 ± 3.2 ng/ml (total IGF-1 was 55.19 ng/ml). The values obtained in this assay are slightly different from those obtained in the
RIA for determination of total IGF-1 shown in Figure 1a because here we used a different antibody (see Methods). Calculation of the relative levels of free IGF-1 revealed that free IGF-1 was 4.52% ± 0.9% of the total levels of IGF-1 in control mice, 11.3% ± 3.7% in LID mice, and 10.42% ± 2.24% in ALSKO mice (Figure 2a). However, the percentage of free IGF-1 was 41.28% ± 6.6% in the LID+ALSKO mice. These data sug-gest that the concentration of free IGF-1 in serum does not differ significantly between control, LID, and ALSKO groups (4–6 ng/ml). However the absolute val-ues and concentration of IGF-1 in the LID+ALSKO mice increase about twofold. Additionally, these obser-vations demonstrate that while total IGF-1 levels in the circulation of the LID+ALSKO mice were only about 10–15% of that observed in control mice, 41% of the cir-culating IGF-1 is in the form of free IGF-1.
[image:6.576.224.537.422.741.2]Clearance of 125I–IGF-1 from serum in vivo. The clearance of IGF-1 from serum is accelerated when IGFBPs are absent (i.e., in response to gestation, hypophysectomy, or diet restriction) (12, 13). Therefore, it was of interest to determine whether the clearance rate of 125I–IGF-1 from serum is altered in the double gene disrupted LID+ALSKO mice, which have very low levels of IGFBPs and lack ALS. 125I–IGF-1 was injected into 4- to 5-week-old control, LID, ALSKO, and LID+ALSKO mice. The total amount of 125I present in serum, as well as that in the TCA-insoluble and TCA-soluble fractions was meas-ured between 0 and 3 hours after injection of 125I–IGF-1. As shown in Figure 2b, the t1/2of 125I–IGF-1 in the serum
Figure 3
of control mice was 69 ± 2 minutes, which was not sig-nificantly different from that measured in LID mice (t1/2, 73 ± 3 minutes). In contrast, the t1/2 in ALSKO and LID+ALSKO mice was dramatically shorter, 32 ± 3 min-utes and 18 ± 2 minmin-utes, respectively. The major change in disappearance rates was seen during the first 60 min-utes in all genotypes (Figure 2b). In all genotypes, the amount of radioactivity in the TCA-soluble fraction,
which represents the degraded 125I–IGF-1 peptide,
reached a plateau after about 60 minutes. Higher levels of radioactivity were detected in the TCA-soluble frac-tion from LID+ALSKO mice than in that from control mice (10% in LID+ALSKO mice versus 5% in control mice, data not shown). These data indicate that the clear-ance rate of IGF-1 was about four times more rapid in the serum of LID+ALSKO mice than in control or LID mice, and about twice as fast as in ALSKO mice. In con-trast to the estimated degradation rates in vivo, the in vitro degradation rate of 125I–IGF-1 incubated with serum at 37°C for 8 hours did not signifi-cantly differ between the various genotypes (control, 4.9% ± 1.3%; LID, 5.4 ± 1.1%; ALSKO, 6.2% ± 2.8%; and LID+ALSKO, 5.8% ± 2.4%).
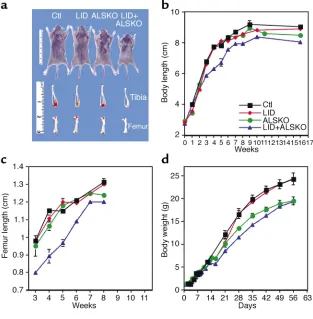
Postnatal growth of LID+ALSKO mice. Measurements of body length (nose to anus) revealed a 30% reduction in body length of the LID+ALSKO mice compared with control mice (P< 0.01) (Figure 3, a and b) starting at 2–3 weeks of age. The body length of LID and ALSKO mice did not significantly differ from that of control mice during the first 6 weeks of development (P> 0.05). Similarly, x-ray measurements of femoral length dur-ing postnatal growth showed that the femurs of LID+ALSKO mice were 20% shorter than those of con-trol mice, as measured at 21 days (the earliest time this measurement was practical) (P< 0.01) (Figure 3c). LID and ALSKO mice did not exhibit significant differences in femoral length until 6 weeks of age, as measured by x-ray. However, a more direct measurement of femurs using digital calipers revealed reductions of 6% and 7.5% in femoral length in the LID and ALSKO mice, respectively, at the age of 6 weeks (P< 0.01), as shown in Table 1. Consistent with findings from previous
[image:7.576.55.539.80.191.2]studies, the body weight of LID mice did not differ sig-nificantly from that of control mice, despite a 75% reduction in serum IGF-1 levels (Figure 1a). While a previous study reported that ALSKO mice had 10% lower body weights than control mice had (7), we found that body weights of ALSKO mice were approx-imately 20% lower than those of control mice. This dif-ference may be a result of strain variations between the two studies. However, the difference in growth curves between ALSKO and LID mice (which have similar lev-els of total IGF-1 in serum) may be due to the stability of the remaining IGF-1 in circulation. The clearance study (see Figure 2b) suggests that there is higher turnover of IGF-1 in the circulation of ALSKO mice than in control and LID mice. This supports the notion
Figure 4
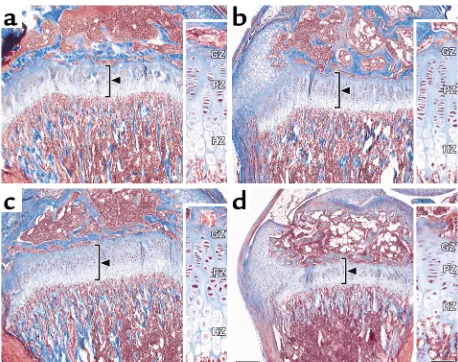
LID+ALSKO mice exhibit alterations in growth plate height. Repre-sentative proximal tibia sections from control (a), LID (b), ALSKO (c), and LID+ALSKO (d) mice at postnatal day 28. Sections were visual-ized with the Masson trichrome technique, which stains nuclei black, stains collagen blue, and stains calcified matrix red. In LID+ALSKO mice, the total height of the growth plate is significantly reduced (bar, 200 µm). Inserts (bar = 50 µm) show the germinal zone (GZ), prolif-erating zone (PZ), and hypertrophic zone (HZ) of chondrocytes.
Table 1
Deletion of liver Igf-1and Alsalters various bone characteristics
Control LID ALSKO LID+ALSKO
Tibia length (mm at 4 weeks) 14.2 ± 0.2 14.1 ± 0.1 13.8 ± 0.2 11.2 ± 0.6ABC
Proximal tibia growth plate
Total height (µm) 268.5 ± 12.4 264.4 ± 12.9 317.7 ± 16.6 217.5 ± 10.1ABC
Hypertrophic zone (µm) 103.5 ± 8.7 91.9 ± 5.4 126.1 ± 6.4 76.9 ± 4.5ABC
Proliferating zone (µm) 114.8 ± 7.7 140.3 ± 9.7 155.6 ± 11.5 98.6 ± 6.2ABC
Germinal zone (µm) 24.2 ± 2.9 29.2 ± 2.1 24.3 ± 2.0 36.0 ± 2.7ABC
Height of first hypertrophic cell (µm) 34.6 ± 4.3 32.4 ± 1.4 36.2 ± 1.9 23.5 ± 1.6ABC
n 5 7 6 8
Data are derived from mice at postnatal day 28. Measurements given in mm or µm represent the longitudinal dimension of the structure parallel to the long axis of the bone. All data are expressed as mean ± SEM for the right tibia. ASignificantly different from control; BSignificantly different from LID; C
[image:7.576.308.537.446.627.2]that it is not only the total amount of IGF-1 in circula-tion that plays a role, but its bioavailability as well.
Dis-ruption of both the liver Igf-1 and Als genes in
LID+ALSKO mice resulted in a further decrease in body weight (∼30% overall) that was detectable from postnatal day 14 (Figure 3d). Overall, these data demonstrate that disruption of both the liver Igf-1and Alsgenes leads to a decrease in linear growth, as meas-ured by body and femoral length. Postnatal growth and development were quantitatively similar in male and female mice, although the data presented here are derived from male mice only.
Retardation of bone development and acquisition. We next analyzed a number of skeletal parameters to deter-mine the effect of reduced circulating IGF-1 on linear growth. These results are summarized in Table 2. Total BMD was measured in the mid-diaphyseal shaft of the femur using pQCT (10). Femoral periosteal
[image:8.576.60.359.53.305.2]circumference and cortical thickness were significant-ly less in LID and ALSKO mice than in controls. How-ever, the double-knockout LID+ALSKO mice exhibit-ed an even smaller periosteal circumference and cortical thickness, as shown in Table 2. Total BMD and cross-sectional area of bone were also lower in the LID, ALSKO, and LID+ALSKO mice than in controls. Interestingly, we also detected modest but significant differences in femoral length in the LID and ALSKO mice; femoral length was 6% and 7.5% smaller in LID and ALSKO mice, respectively, than in controls. The double gene disrupted LID+ALSKO mice exhibited a femoral length that was approximately 12% shorter than that of control mice at 6 weeks of age. The above skeletal parameters correlated directly with serum lev-els of IGF-1 (cortical density, r2= 0.956; cortical thick-ness, r2= 0.925; periosteal circumference, r2= 0.773; and femoral length, r2= 0.842).
Figure 5
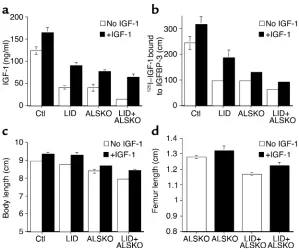
Four weeks of IGF-1 treatment results in increased serum levels of IGF-1 and IGFBP-3 and an increase in body and femoral lengths. (a) Serum levels of IGF-1 following 4 weeks of IGF-1 injec-tions were determined by RIA as described above. (b) Serum levels of IGFBP-3 were determined by ligand blot assay. The graph shows quantification of 125I–IGF-1 binding to IGFBP-3 in samples from
[image:8.576.59.537.583.712.2]control, LID, ALSKO, and LID+ALSKO mice (n= 8 per group). (c) Body length of control, LID, ALSKO, and LID+ALSKO mice at 8 weeks of age, with and without IGF-1 treatment. (d) Length of femurs of ALSKO and LID+ALSKO mice at 8 weeks of age, with and without IGF-1 treatment.
Table 2
Bone development and acquisition
Control LID ALSKO LID+ALSKO
Femoral length (mm) 14.05 ± 0.2 13.22 ± 0.17A 13.1 ± 0.15A 12.38 ± 0.27ABC
Total density (mg/mm3) 0.47 ± 0.009 0.43 ± 0.005A 0.43 ± 0.005A 0.44 ± 0.005A
Cortical density (mg/mm3) 0.59 ± 0.006 0.55 ± 0.008A 0.56 ± 0.008A 0.53 ± 0.005ABC
Cortical thickness (µm) 0.394 ± 0.01 0.317 ± 0.01A 0.297 ± 0.01A 0.255 ± 0.011ABC
Periosteal circumference (mm) 4.97 ± 0.13 4.41 ± 0.09A 4.1 ± 0.12A 3.32 ± 0.18ABC
Cross-sectional area (mm2) 2.07 ± 0.10 1.65 ± 0.05A 1.42 ± 0.08A 0.94 ± 0.07ABC
Femoral cortical bone volume (mm3) 0.117 ±0.004 0.086 ±0.004A 0.089 ±0.004A 0.075 ±0.003ABC
Femoral trabecular bone volume (mm3) 1.053 ± 0.049 1.029 ± 0.072 0.674 ± 0.060AB 0.581 ± 0.026AB
Anterior/posterior diameter (mm) 0.231 ±0.012 0.178 ±0.007A 0.194 ±0.011A 0.171 ±0.006ABC
n 11 14 14 13
pQCT and microcomputed tomography analyses of femurs from mice at postnatal day 42. All data are expressed as mean –SEM. ASignificantly different from
Microcomputed tomography measurements revealed that femurs of LID, ALSKO, and LID+ALSKO mice were smaller than those of controls, as evidenced by reduced bone volume of the entire femur and midshaft regions (Table 2). LID mice, which had only a slight reduction in bone length (6%), had an approximately 26% reduction in cortical bone volume, an indication that periosteal bone formation was reduced. Similarly, ALSKO mice, which had a 7.5% reduction in femoral length, had a 24% reduction in femoral cortical bone volume. LID and ALSKO mice show 75% and 65% reductions in circulat-ing levels of IGF-1, respectively, with no change in skele-tal IGF-1 mRNA production and an approximately 25% reduction in bone volume. This suggests that circulating IGF-1 levels must regulate the modeling process by tar-geting periosteal osteoblasts in a manner that defines bone volume. For the distal femur, which is composed chiefly of trabecular bone, both ALSKO and LID+ALSKO mice showed marked reductions in trabec-ular bone volume (37% and 48%, respectively; P< 0.0001 vs. controls). However, of the three genetically engi-neered strains, only the LID+ALSKO mice showed a decrease (–15%; P= 0.06) in trabecular bone density (bone volume/total volume) compared with controls. The growth of bone, like that of other tissues, results from an increase in cell number, cell size, and extracellu-lar ground substance. We studied the proximal growth plate of the tibia, which is considered to be representative of long bone development. We also compared bone growth in the various genotypes at postnatal day 28. This developmental stage was chosen because it corresponds to the middle of the linear growth period, when GH and IGF-1 play major roles in growth and development. The tibia length in control, LID, ALSKO, and LID+ALSKO mice was proportional to whole body length in the vari-ous genotypes. Tibia length of LID+ALSKO mice was 20% shorter than that of control mice (Table 1). Com-parison of histological sections of the proximal tibia growth plate revealed that the total height of the growth plate was reduced by 20% in the LID+ALSKO mice (Fig-ure 4, Table 1). LID+ALSKO mice also exhibited an iso-metric reduction of about 15% in the height of the
proliferative zone, 26% in the height of the hypertrophic zone of chondrocytes, and a 30% reduction in the height of the first hypertrophic cell — that determine bone length. In contrast, the height of the germinal zone was significantly increased in the LID+ALSKO mice (Figure 4, Table 1) compared with control mice.
Extrahepatic IGF-1 production in LID+ALSKO mice. IGF-II production in the adult mouse is turned off. Therefore, in order to determine whether there is a compensatory induction of Igf-1, IGF-1 receptor, or GH receptor gene expression in extrahepatic tissues, we measured these mRNA levels. Expression of IGF-1 and GH receptor in kidney, muscle, spleen, lung, heart, and fat did not differ between groups (data not shown). However, expression of IGF-1 receptor was upregulated in muscle and heart of the LID+ALSKO mice by approximately 1.5-fold (P< 0.01) (data not shown).
IGF-1 mRNA levels in bone were determined using quantitative real-time PCR. This revealed no signifi-cant changes in IGF-1 mRNA expression between the various genotypes (control mice, 20.28 ± 4.2 cycles; LID, 18.76 ± 3.17 cycles; ALSKO, 19.1 ± 5.7 cycles; LID+ALSKO, 16.9 ± 4.0 cycles, as corrected to 18S control). This observation suggests that the differ-ences in skeletal parameters between genotypes are not due to differences in the local production of IGF-1 mRNA in bone itself.
[image:9.576.56.541.79.190.2]IGF-1 treatment restores longitudinal growth in LID+ALSKO mice. Animals were injected with IGF-1 (1 mg/kg) twice daily from 4 weeks to 8 weeks of age. At the endpoint of the treatment, serum levels of IGF-1 and IGFBPs were determined by RIA and ligand blot assays, respectively. Serum IGF-1 levels increased in all the treated animals (Figure 5a). Similarly, serum IGFBP levels, particular-ly IGFBP-3, increased in all groups (Figure 5b). All IGF-1–treated mice showed an increase in body length compared with untreated mice (Figure 5c). Body length after 4 weeks of treatment increased by 6.25% in control mice, 8.79% in LID mice, 3.57% in ALSKO mice, and 6.07% in the double gene disrupted LID+ALSKO mice. Femoral length was significantly increased in all groups of the IGF-1–treated mice (Figure 5d).
Table 3
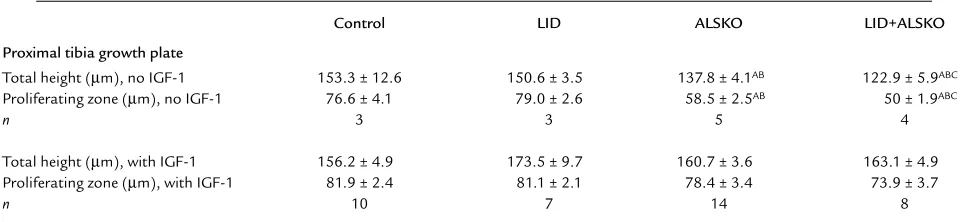
IGF-1 treatment restores the height of the growth plate in LID+ALSKO mice
Control LID ALSKO LID+ALSKO
Proximal tibia growth plate
Total height (µm), no IGF-1 153.3 ± 12.6 150.6 ± 3.5 137.8 ± 4.1AB 122.9 ± 5.9ABC
Proliferating zone (µm), no IGF-1 76.6 ± 4.1 79.0 ± 2.6 58.5 ± 2.5AB 50 ± 1.9ABC
n 3 3 5 4
Total height (µm), with IGF-1 156.2 ± 4.9 173.5 ± 9.7 160.7 ± 3.6 163.1 ± 4.9
Proliferating zone (µm), with IGF-1 81.9 ± 2.4 81.1 ± 2.1 78.4 ± 3.4 73.9 ± 3.7
n 10 7 14 8
Data are derived from mice at postnatal day 56 (4 weeks after initiation of IGF-1 treatment). Measurements given in µm represent the longitudinal dimension of the structure parallel to the long axis of the bone. All data are expressed as mean –SEM for the right tibia. ASignificantly different from control; B
The total height of the growth plate of LID+ALSKO mice was restored after IGF-1 treatment. This was also reflected by an increase in the proliferative zone of chondrocytes (Table 3).
Discussion
The IGFs play an important role in the acquisition and maintenance of bone. The majority of circulating IGFs are normally bound in a 150-kDa complex that includes IGF-1, IGFBP-3, and ALS. The skeletal compartment produces and stores IGFs, IGFBPs, and the IGFBP pro-teases. In this study, we demonstrate that simultaneous disruption of both the liver Igf-1and Alsgenes decreases linear growth as measured by various skeletal parameters. As described previously (6), serum IGF-1 levels in LID mice were 75% lower than those of control mice. This dramatic decrease is attributed to the lack of IGF-1 pro-duction by the liver, which under normal conditions is the main source of circulating IGF-1. ALSKO mice exhibited a 65% reduction of serum IGF-1 levels com-pared with control mice. The loss of circulating IGF-1 in these animals results from an accelerated turnover of IGF-1 and a decreased stability of the binary complex composed of IGF-1 and IGFBP-3. Interestingly, simul-taneous disruption of both the liver Igf-1and Alsgenes in LID+ALSKO mice led to a further decrease in serum IGF-1 and IGFBP-3 levels. These effects were mediated by a combination of the lack of liver IGF-1 production and a decrease in the stability of the circulating IGF-1 that originated from nonhepatic sources due to disrup-tion of the Alsgene. The absence of the protective ALS protein leads to the proteolytic cleavage of IGFBP-3. This in turn impairs the ability of IGFBP-3 to protect IGF-1, since the affinity of the fragmented IGFBP-3 for IGF-1 is reduced by 95% as compared to the affinity of the intact protein (14–16). Accordingly, 42% of the cir-culating IGF-1 in the serum of LID+ALSKO mice exists in the free form, versus 5% in control mice and approx-imately 10% in LID and ALSKO mice. Despite the markedly increased levels of circulating free IGF-1 in LID+ALSKO mice, these animals exhibited a dramatic retardation in growth. Increased degradation of free IGF-1, most likely in the extravascular compartment, could explain this growth retardation. Indeed, in its binary complex (with IGFBP-3), IGF-1 appears to be more potent than the free form of IGF-1 under many conditions (17–19).
Clearance studies showed that 125I–IGF-1 was cleared from serum at an accelerated rate in LID+ALSKO mice. This was most likely due to more rapid distribution of 125I–IGF-1 into the extravascular space. These changes in
distribution may be mediated by alterations in the bind-ing of IGF-1 to IGFBPs. In control and LID mice, IGF-1 is distributed in three ways: into the ternary complex (IGF-1/IGFBP-3/ALS), with a t1/2of 10–16 hours; into the binary complex (IGF-1/IGFBP-3), with a t1/2of 30–60 minutes; and as the free form (IGF-1 alone), with a t1/2of 10 minutes. In ALSKO mice, most IGF-1 is associated with the binary complex (which is composed primarily
of IGFBP-3 but also includes some IGFBP-1 and IGFBP-2) and is more rapidly turned over than in con-trol mice. Indeed, the clearance of 125I–IGF-1 in ALSKO mice was accelerated twofold compared with control and LID mice. In contrast, most of the circulating IGF-1 in the LID+ALSKO mice existed in the free form, due to a further decrease in IGFBPs (particularly IGFBP-3). The accelerated clearance of IGF-1 from serum in LID+ALSKO mice results in the transfer of IGF-1 to the extravascular space and enhances its degradation by pro-teases. The increased IGF-1 receptor expression in skele-tal muscle of LID+ALSKO mice might explain the more rapid distribution of 125I–IGF-1 in those mice observed in the clearance studies. Furthermore, receptor-mediat-ed internalization and degradation of IGF-1 in the extravascular compartment could give rise to the increased degradation products of 125I–IGF-1 observed in serum of LID+ALSKO mice (20).
Linear bone growth is mediated by a complex series of events that occur within the epiphyseal growth plate. This process is regulated by various nutritional, neu-ronal, and hormonal mechanisms, each of which is nec-essary for optimal bone growth. The chondrocytes in the growth plate undergo two distinct phases of growth: cell division, which takes place in the prolifer-ating zone, and cell differentiation, which occurs in the hypertrophic zone. We found that LID+ALSKO mice exhibit reduced bone length at the age of 4 weeks. As IGF-1 is known to stimulate the proliferation of chon-drocytes in vitro (21–24), the dramatic reduction of IGF-1 levels in these animals is consistent with decreased bone growth.
These findings are also consistent with the narrowing of the growth plate that occurs with age and is associ-ated with decreases in circulating IGF-1 and IGFBP-3 and decreased local production of IGF-1 in vivo (25–27). The growth plate in LID+ALSKO mice is char-acterized by reductions in height of the proliferative and hypertrophic zones of chondrocytes. However, the height of the germinal zone was significantly increased in LID+ALSKO mice. The role of the resting chondro-cytes in the germinal zone remains an open issue, and there is no hard evidence demonstrating that those cells are the immediate precursors of proliferative chondrocytes. However, there are a few studies demon-strating that this zone is responsive to GH. Therefore the expansion of the germinal zone in the LID+ALSKO mice might be due to an increase in GH action in those mice (28), which could delay the conversion of those cells to proliferating cells. Alternatively, expansion of the germinal zone could be due to a delay in the onset of formation of the secondary ossification process at the epiphysis, as was described in IGF-1 null mice (29).
While the GH/IGF-1 axis plays a major role in the growth plate, Lupu et al. (29) demonstrated that both
Igf1and the Gh receptor are expressed in the same
differentiation, and proliferating chondrocytes occur in the absence of either or both of these effector genes. The double gene disrupted LID+ALSKO mice were significantly smaller than control, LID, or ALSKO mice; nevertheless, they grew and reached a plateau at 8–10 weeks. The dramatic differences in body and femoral lengths of LID+ALSKO mice were detected as early as 2–3 weeks of age. The pubertal growth spurt, which results from GH spikes and a rise in serum IGF-1, occurs at about 2–3 weeks of postnatal develop-ment. These results suggest that the growth delay of LID+ALSKO mice is directly related to the reduced cir-culating IGF-1 levels and that circir-culating IGF-1 has a direct impact on femoral length. IGF-1 treatment for 4 weeks resulted in increased body and femoral lengths in all the mouse groups. Analysis of the tibial growth plate after IGF-1 injection revealed an increase in the total height of the growth plate, supporting a direct effect of IGF-1 on chondrocytes. However, although the height of the growth plate was restored in the LID+ALSKO mice after IGF-1 injection, the bone did not reach normal size.
This observation raises the possibility that other components of the 150-kDa complex, IGFBP-3 or ALS, may regulate IGF-1 bioavailability and therefore regu-late growth. It has been shown that coinfusion of the binary complex (IGF-1 and IGFBP-3), but not IGF-1 alone, restored growth in hypophysectomized rats (1). Cortical bone is widened during growth by osteoblas-tic bone formation on the outer bone surface, the periosteum. Consistent with the effects of IGF-1 on longitudinal bone growth, which were quite evident in this study, the LID+ALSKO mice also exhibited signif-icant alterations in the size and mass of bone, as shown by reduced femoral periosteal circumference, smaller cross-sectional area, and a thinner cortex compared with control mice. These changes were also reflected in the overall volumetric density of the femur, as meas-ured by pQCT. Moreover, there was a direct relation-ship between serum levels of IGF-1 and the skeletal parameters relating to bone size. Taken together, these data suggest that large changes in circulating concen-trations of IGF-1 may play an important role in the acquisition of peak bone mass and strength.
Several lines of evidence from both animal and human studies have previously provided indirect sup-port for the hypothesis that circulating IGF-1 plays an important role in the acquisition of peak bone mass and strength. For example, inbred strains of mice that exhibit differences in femoral volumetric BMD also show similar differences in serum IGF-1 concentra-tions (30). A spontaneous mutant, the growth
hor-mone–releasing, hormone receptor–resistant lit/lit
mouse has circulating levels of IGF-1 similar to those of LID+ALSKO mice. Interestingly, lit/litmice have sig-nificantly reduced volumetric femoral bone density (31). Expression of skeletal IGF-1 mRNA, as deter-mined by quantitative real-time PCR analysis, showed no difference between control, LID, ALSKO, and
LID+ALSKO mice, suggesting that circulating IGF-1 levels must play an important role in the acquisition of peak BMD. Human studies have also supported a link between circulating IGF-1 and bone density and/or strength. Langlois et al. reported a relatively strong cor-relation between serum IGF-1 levels and BMD at sev-eral sites in women from the Framingham cohort (32). More recently, Gamero et al. noted that low serum lev-els of IGF-1 were associated with a significantly greater risk of hip fractures among a large cohort of older post-menopausal women in France (33).
Until now, however, the evidence of a causal link between serum levels of IGF-1 and bone acquisition has remained indirect. The current study provides some important new insight into the relationship between bone mass and circulating IGF-1. Indeed, one of the key findings from this study is the altered skeletal phenotype of the LID, ALSKO, and LID+ALSKO mice. In addition to reduced total femoral volumetric BMD (as measured by pQCT), femurs from LID and ALSKO mice, which were only slightly shorter than femurs of control mice, had sig-nificantly reduced bone volumes even without dif-ferences in skeletal IGF-1 mRNA expression. These data suggest that circulating IGF-1 is critical for the modeling of bone, particularly periosteal growth (even more than linear growth, since femoral length of the LID and ALSKO mice was only slightly affect-ed). Moreover, it appears likely that a threshold level of circulating IGF-1 is necessary for the proper acqui-sition of peak bone mass. However, the precise mech-anism by which circulating IGF-1 levels function in the growing skeleton remains to be determined. Fur-ther characterization of the role of circulating IGF-1 in bone acquisition may have important implications for the clinical management of osteoporosis.
Acknowledgments
The authors wish to thank Lisa Heron and Patricia Pennisi (NIH) for helpful discussions, German Iniguez and Bernice Samuels (NIH) for technical assistance, A.F. Parlow (National Hormone and Pituitary Program, Harbor-UCLA Medical Center) for help in establishing the GH RIA, and Dana Beitner-Johnson for editing the manuscript. Determination of free IGF-1 was funded by Aarhus University–Novo Nordisk Centre for Research in Growth and Regeneration (Danish Health Research Council grant 9700592). Generation of ALSKO mice was funded by NIH grant DK-51624.
1. Jones, J.I., and Clemmons, D.R. 1995. Insulin-like growth factors and their binding proteins: biological actions. Endocr. Rev.16:3–34. 2. Binoux, M., and Hossenlopp, P. 1988. Insulin-like growth factor (IGF) and
IGF-binding proteins: comparison of human serum and lymph. J. Clin. Endocrinol. Metab.67:509–514.
3. Bar, R.S., et al. 1990. Transcapillary permeability and subendothelial dis-tribution of endothelial and amniotic fluid insulin-like growth factor binding proteins in the rat heart. Endocrinology.127:1078–1086. 4. LeRoith, D., Bondy, C., Yakar, S., Liu, J.L., and Butler, A. 2001. The
somatomedin hypothesis: 2001. Endocr. Rev.22:53–74.
6. Yakar, S., et al. 1999. Normal growth and development in the absence of hepatic insulin-like growth factor I. Proc. Natl. Acad. Sci. USA.96:7324–7329. 7. Ueki, I., et al. 2000. Inactivation of the acid labile subunit gene in mice results in mild retardation of postnatal growth despite pro-found disruptions in the circulating insulin-like growth factor sys-tem. Proc. Natl. Acad. Sci. USA.97:6868–6873.
8. Yakar, S., et al. 2001. Liver-specific igf-1 gene deletion leads to mus-cle insulin insensitivity. Diabetes.50:1110–1118.
9. Thissen, J.P., Davenport, M.L., Pucilowska, J.B., Miles, M.V., and Underwood, L.E. 1992. Increased serum clearance and degradation of 125I-labeled IGF-I in protein-restricted rats. Am. J. Physiol.
262:E406–E411.
10. Beamer, W.G., Donahue, L.R., Rosen, C.J., and Baylink, D.J. 1996. Genetic variability in adult bone density among inbred strains of mice. Bone.18:397–403.
11. Hildebrand, T., Laib, A., Muller, R., Dequeker, J., and Ruegsegger, P. 1999. Direct three-dimensional morphometric analysis of human cancellous bone: microstructural data from spine, femur, iliac crest, and calcaneus. J. Bone Miner. Res.14:1167–1174.
12. Cohen, K.L., and Nissley, S.P. 1976. The serum half-life of somatomedin activity: evidence for growth hormone dependence. Acta Endocrinol. (Copenh.)83:243–258.
13. Davenport, M.L., et al. 1990. Regulation of serum insulin-like growth factor-I (IGF-I) and IGF binding proteins during rat pregnancy. Endocrinology.127:1278–1286.
14. Zadeh, S.M., and Binoux, M. 1997. The 16-kDa proteolytic fragment of insulin-like growth factor (IGF) binding protein-3 inhibits the mitogenic action of fibroblast growth factor on mouse fibroblasts with a targeted disruption of the type 1 IGF receptor gene. Endocrinol-ogy.138:3069–3072.
15. Lassarre, C., et al. 1991. Serum insulin-like growth factors and insulin-like growth factor binding proteins in the human fetus. Rela-tionships with growth in normal subjects and in subjects with intrauterine growth retardation. Pediatr. Res.29:219–225. 16. Hossenlopp, P., et al. 1990. Evidence of enzymatic degradation of
insulin-like growth factor-binding proteins in the 150K complex dur-ing pregnancy. J. Clin. Endocrinol. Metab.71:797–805.
17. Blum, W.F., et al. 1989. Insulin-like growth factor I (IGF-I)-binding protein complex is a better mitogen than free IGF-I. Endocrinology.
125:766–772.
18. Conover, C.A., Bale, L.K., Durham, S.K., and Powell, D.R. 2000. Insulin-like growth factor (IGF) binding protein-3 potentiation of IGF action is mediated through the phosphatidylinositol-3-kinase pathway and is associated with alteration in protein kinase B/AKT sensitivity. Endocrinology.141:3098–3103.
19. De Mellow, J.S., and Baxter, R.C. 1988. Growth hormone-dependent insulin-like growth factor (IGF) binding protein both inhibits and
potentiates IGF-I-stimulated DNA synthesis in human skin fibrob-lasts. Biochem. Biophys. Res. Commun.156:199–204.
20. Philippe, J., et al. 1981. Increased clearance and degradation of [3H]insulin in streptozotocin diabetic rats. J. Clin. Invest.67:673–680. 21. Lindahl, A., Isgaard, J., Carlsson, L., and Isaksson, O.G. 1987. Differ-ential effects of growth hormone and insulin-like growth factor I on colony formation of epiphyseal chondrocytes in suspension culture in rats of different ages. Endocrinology.121:1061–1069.
22. Lindahl, A., Isgaard, J., Nilsson, A., and Isaksson, O.G. 1986. Growth hormone potentiates colony formation of epiphyseal chondrocytes in suspension culture. Endocrinology.118:1843–1848.
23. Lindahl, A., Nilsson, A., and Isaksson, O.G. 1987. Effects of growth hormone and insulin-like growth factor-I on colony formation of rabbit epiphyseal chondrocytes at different stages of maturation. J. Endocrinol.115:263–271.
24. Ohlsson, C., Nilsson, A., Isaksson, O.G., and Lindahl, A. 1992. Effect of growth hormone and insulin-like growth factor-I on DNA syn-thesis and matrix production in rat epiphyseal chondrocytes in monolayer culture. J. Endocrinol.133:291–300.
25. Rosen, C.J., Donahue, L.R., and Hunter, S.J. 1994. Insulin-like growth factors and bone: the osteoporosis connection. Proc. Soc. Exp. Biol. Med.206:83–102.
26. Rosen, C.J. 1999. Serum insulin-like growth factors and insulin-like growth factor-binding proteins: clinical implications. Clin. Chem.
45:1384–1390.
27. Rosen, C.J., and Bilezikian, J.P. 2001. Clinical review 123: anabolic therapy for osteoporosis. J. Clin. Endocrinol. Metab.86:957–964. 28. Wang, J., Zhou, J., and Bondy, C.A. 1999. Igf1 promotes longitudinal
bone growth by insulin-like actions augmenting chondrocyte hyper-trophy. FASEB J.13:1985–1990.
29. Lupu, F., Terwilliger, J.D., Lee, K., Segre, G.V., and Efstratiadis, A. 2001. Roles of growth hormone and insulin-like growth factor 1 in mouse postnatal growth. Dev. Biol.229:141–162.
30. Rosen, C.J., et al. 1997. Circulating and skeletal insulin-like growth factor-I (IGF-I) concentrations in two inbred strains of mice with dif-ferent bone mineral densities. Bone.21:217–223.
31. Donahue, L.R., and Beamer, W.G. 1993. Growth hormone deficiency in ‘little’ mice results in aberrant body composition, reduced insulin-like growth factor-I and insulin-insulin-like growth factor-binding protein-3 (IGFBP-protein-3), but does not affect IGFBP-2, -1 or -4. J. Endocrinol.
136:91–104.