© 2015, IRJET ISO 9001:2008 Certified Journal Page 1097
PARAMETRIC ANALYSIS OF HYPERBOLIC COOLING TOWER UNDER
SEISMIC LOADS THROUGH STAAD.Pro
Iqbal Hafeez Khan
1, Rakesh Patel
2, Aslam Hussain
31
Student, Department of Civil Engineering, Sagar Institute of Research Technology and Science, Bhopal
2
Faculty, Department of Civil Engineering, Sagar Institute of Research Technology and Science, Bhopal
3
Faculty, Department of Civil Engineering, UIT RGPV Bhopal
Abstract
-Hyperbolic cooling towers are large, thin shell reinforced concrete structures which contribute to environmental protection and to power generation efficiency and reliability. The safety of hyperbolic cooling towers is important to the continuous operation of a power plant. It is observed from the analysis that maximum displacement, support reactions, support moments, stresses and bending moments in plates due to seismic loading on a hyperbolic cooling tower is continuous function of geometry (top diameter, throat diameter and height). earthquake zone plays the important role in analysis. So from this work it can be observed that 300 thickness, throat diameter 64m and height 150 m is much efficient among all but if height is mandatory to extent than height should not be more than 159m (height taken from actual work) and 170 m height is critical.Keywords
- Hyperbolic, cooling, tower, height, seismic, displacement, shear force etc1.
INTRODUCTION
- Hyperbolic cooling towers are large, thin shell reinforced concrete structures which contribute to environmental protection and to power generation efficiency and reliability. The cooling tower shell is supported by a truss or framework of columns bridging the air inlet to the tower foundation. The two loading types affect different parts of the structure. While the earthquake activates the entire 360° cross section, the wind load tends to concentrate its influence over only about 180°. This has a marked effect upon the amplification of the loading forces into the meridional shell forces. Following prominent literature reviews- Gupta (1996) reviewed that the safety of hyperbolic cooling towers is important to the continuous operation of a power plant. Depending upon the site, earthquake may govern the design of the tower. Methods of seismic analysis have been presented. It is concluded that the response spectrum method of analysis is of maximum practical use. A method to construct the design response spectra for various earthquake zones is presented. An earthquake motion consists of three components; however, it is shown that designing for one horizontal component only is adequate.T Aksu(1998)showed that the Column supported
hyperboloid cooling towers are analyzed with a finite element formulation including the effects of thickness shear deformations and the term z/R. Both shell and columns are modelled by using the same curved trapezoidal finite element with 40 degrees of freedom. The stress concentration at the shell column junctions is studied by taking into account the effect of the column support width.
Dieter Buschet.al (2005) reviewed that In the years 1999 to 2001 a new natural draft cooling tower has been built at the RWE power station at Niederaussem, with 200 m elevation the highest cooling tower world-wide. For many reasons, such structures cannot be designed merely as enlargement of smaller ones, on the contrary, it is full of innovative new design elements. The present paper starts with an overview over the tower and a description of its geometry, followed by an elucidation of the conceptual shape optimization. The structural consequences of the flue gas inlets through the shell at a height of 49 m are explained as well as the needs for an advanced high performance concrete for the wall and the fill construction. Further, the design and structural analysis of the tower is described with respect to the German codified safety concept for these structures. Zingoniet.al(2005) worked on Damage, deterioration and the long-term structural performance of cooling-tower shells from the issues of response to short-term loading and immediate causes of collapse in the early part of this period, to the issues of deterioration phenomena, durability and long-term performance in more recent times.
© 2015, IRJET ISO 9001:2008 Certified Journal Page 1098
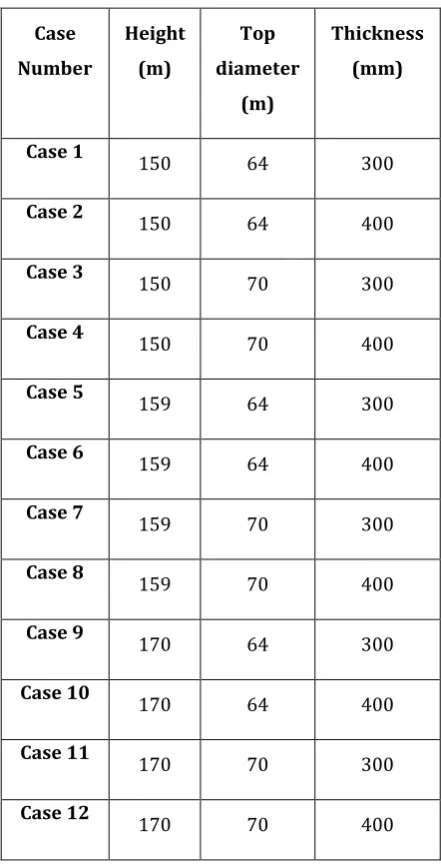
Table 1: Cases in earthquake zone IV
Table 2:Cases in earthquake zone V
Case Number
Height (m)
Top diameter
(m)
Thickness (mm)
Case 1 150 64 300
Case 2 150 64 400
Case 3 150 70 300
Case 4 150 70 400
Case 5 159 64 300
Case 6 159 64 400
Case 7 159 70 300
Case 8 159 70 400
Case 9 170 64 300
Case 10 170 64 400
Case 11 170 70 300
Case 12 170 70 400
Case Number
Height (m)
Top diameter
(m)
Thickness (mm)
Case 13 150 64 300
Case 14 150 64 400
Case 15 150 70 300
Case 16 150 70 400
Case 17 159 64 300
Case 18 159 64 400
Case 19 159 70 300
Case 20 159 70 400
Case 21 170 64 300
Case 22 170 64 400
Case 23 170 70 300
© 2015, IRJET ISO 9001:2008 Certified Journal Page 1099
2. RESULT AND DISCUSSION
2.1 Displacement
[image:3.595.33.286.192.529.2]2.1.1 Displacements in Earthquake zone IV
Table 3:Comparison of nodal displacement of cooling tower diameter 300mm (MaxmRst)
Height of Cooling Tower
Node Displacement for 64m & 70 m throat diameter cooling tower 64m Throat
diameter
70m Throat diameter
150 30.417 26.863
159 33.620 31.947
170 38.733 35.723
Fig. 1: Graph of nodal displacement of cooling tower diameter 300mm (MaxmRst)under earthquake zone IV
Table 4:Comparison of nodal displacement of cooling tower diameter 400mm (MaxmRst)
Fig 2: Graph of of nodal displacement of cooling tower diameter 400mm (MaxmRst) under earthquake zone IV
2.1.2 Displacements in Earthquake zone V
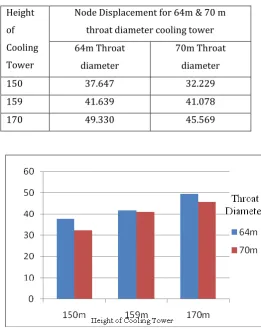
Table 5: Comparison of nodal displacement of cooling tower diameter 300mm (MaxmRst)
Height of Cooling Tower
Node Displacement for 64m & 70 m throat diameter cooling tower 64m Throat
diameter
70m Throat diameter
150 37.647 32.229
159 41.639 41.078
170 49.330 45.569
Fig. 3: Graph of nodal displacement of cooling tower diameter 300mm (MaxmRst)under earthquake zone V
Height of Cooling Tower
Node Displacement for 64m & 70 m throat diameter cooling tower 64m Throat
diameter
70m Throat diameter
150 29.901 26.482
159 33.093 31.619
[image:3.595.311.573.356.686.2]© 2015, IRJET ISO 9001:2008 Certified Journal Page 1100
Table 6: Comparison of nodal displacement of cooling tower diameter 400mm (MaxmRst)
Height of Cooling Tower
Node Displacement for 64m & 70 m throat diameter cooling tower 64m Throat diameter 70m Throat diameter
150 36.981 26.482
159 40.943 40.635
170 48.689 45.950
Fig. 4: Graph of nodal displacement of cooling tower diameter 400mm (MaxmRst)under earthquake zone V
2.2 Support Reaction
[image:4.595.40.502.120.736.2]Table 7 Comparison of support reactions for throat diameter 64 m under seismic zone IV
[image:4.595.28.286.129.518.2]Fig. 5 Graphofsupport reactionof cooling tower diameter 300mm under earthquake zone IV
Table 8 Comparison of support reactions for throat diameter 70 m under seismic zone IV
Height Of Cooling
Tower
Support Reactions (KN)
Cooling Tower with 300mm
thickness
Cooling Tower with 400mm
thickness
150 33114.219 44151.480
159 36762.703 49015.842
170 37719.945 50292.148
Height Of Cooling Tower
Support Reactions (KN)
Cooling Tower with
300mm thickness
Cooling Tower with
400mm thickness
150 37083.765 49444.051
159 31917.471 42557.148
[image:4.595.316.541.153.385.2] [image:4.595.338.511.481.695.2]© 2015, IRJET ISO 9001:2008 Certified Journal Page 1101
[image:5.595.311.549.94.365.2]Fig. 6 Graph of support reactionof cooling tower diameter 400mm under earthquake zone IV
Table 9 Comparison of support reactions for throat diameter 64 m under seismic zone V
Height Of Cooling Tower
Support Reactions (KN)
Cooling Tower with 300mm
thickness
Cooling Tower with 400mm
thickness
150 36194.605 48258.238
159 40148.738 53530.219
170 41606.488 55473.633
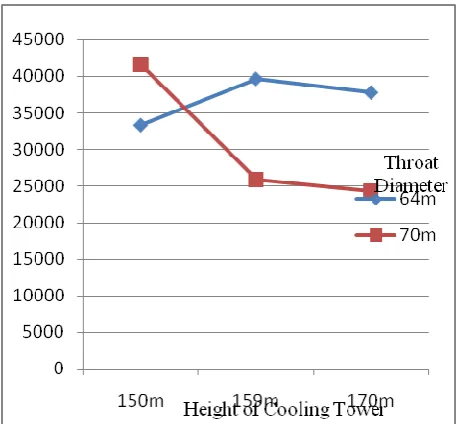
Fig. 7 Graph of support reactionof cooling tower diameter 300mm under earthquake zone V
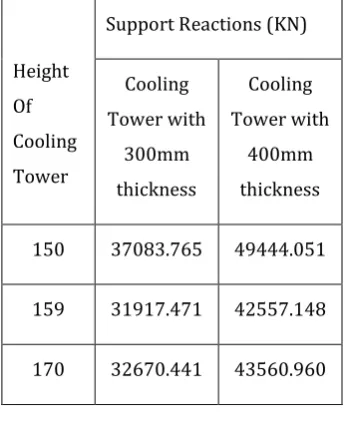
Table 10 Comparison of support reactions for throat diameter 70 m under seismic zone V
Height Of Cooling Tower
Support Reactions (KN)
Cooling Tower with 300mm
thickness
Cooling Tower with 400mm
thickness
150 40191.434 53587.527
159 35535.828 47381.875
© 2015, IRJET ISO 9001:2008 Certified Journal Page 1102
Fig. 8 Graph of support reaction of cooling tower diameter 400mm under earthquake zone V
[image:6.595.35.286.92.349.2]2.3 Support Moments
Table 11 Comparison of support moments for throat diameter 64m under seismic zone IV
Height Of Cooling Tower
Support Moment (KN-m)
Cooling Tower with 300mm
thickness
Cooling Tower with 400mm
thickness
150 22810.482 30656.117
159 26932.635 36173.148
170 25644.725 34358.180
Fig.9 Graph of support moment of cooling tower diameter 300mm under earthquake zone IV
Table 12 Comparison of support moments for throat diameter 70m under seismic zone IV
Height Of Cooling Tower
Support Moment (KN-m)
Cooling Tower with
300mm thickness
Cooling Tower with
400mm thickness
150 28682.670 38573.235
159 17110.275 22862.023
[image:6.595.312.529.92.324.2] [image:6.595.309.515.451.692.2]© 2015, IRJET ISO 9001:2008 Certified Journal Page 1103
Fig. 10 Graph of support moment of cooling tower diameter 400mm under earthquake zone IV
[image:7.595.36.250.87.324.2]Table 13Comparison of support moments for throat diameter 64 m under seismic zone
[image:7.595.302.531.408.631.2]Fig. 11 Graph of support moment of cooling tower diameter 300mm under earthquake zone V
Table 14Comparison of support moments for throat diameter 70 m under seismic zone V
Height Of Cooling Tower
Support Moment (KN-m)
Cooling Tower with
300mm thickness
Cooling Tower with
400mm thickness
150 34845.664 33385.305
159 29337.629 39637.191
170 28227.814 37789.047
Height Of Cooling Tower
Support Moment (KN-m)
Cooling Tower with 300mm
thickness
Cooling Tower with 400mm
thickness
150 31000.469 41651.133
159 19019.438 25934.945
© 2015, IRJET ISO 9001:2008 Certified Journal Page 1104
Fig. 12 Graph of support moment of cooling tower diameter 400mm under earthquake zone V
[image:8.595.36.267.140.352.2]2.4 Membrane Stresses
Table 15Comparison of membrane stresses for throat diameter 64 m under seismic zone IV
Height Of Cooling Tower
Membrane Stress (N/mm2)
Cooling Tower with 300mm
thickness
Cooling Tower with 400mm
thickness
150 4.784 4.781
159 5.001 4.873
170 5.299 5.296
Fig. 13 Graph of membrane stressesof cooling tower diameter 300mm under earthquake zone IV Table 16 Comparison of membrane stresses for throat diameter 70 m under seismic zone IV
Height Of Cooling Tower
Membrane Stress (N/mm2)
Cooling Tower with 300mm
thickness
Cooling Tower with 400mm
thickness
150 4.696 4.833
159 5.184 5.305
[image:8.595.338.565.477.689.2]© 2015, IRJET ISO 9001:2008 Certified Journal Page 1105
Fig. 14 Graph of membrane stresses of cooling tower diameter 400mm under earthquake zone IV
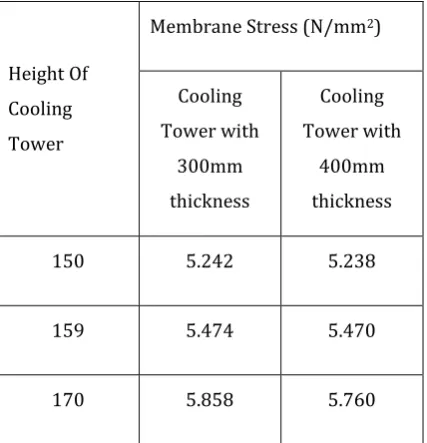
[image:9.595.35.260.91.329.2]Table 17 Comparison of membrane stresses in plates for throat diameter 64 m under seismic zone V
Fig. 15 Graph of membrane stresses of cooling tower diameter 300mm under earthquake zone V
Table 18 Comparison of membrane stresses in plates for throat diameter 64 m under seismic zone V
Height Of Cooling Tower
Membrane Stress (N/mm2)
Cooling Tower with
300mm thickness
Cooling Tower with
400mm thickness
150 5.242 5.238
159 5.474 5.470
170 5.858 5.760
Height Of Cooling Tower
Membrane Stress (N/mm2)
Cooling Tower with
300mm thickness
Cooling Tower with
400mm thickness
150 5.254 5.249
159 5.916 5.916
[image:9.595.32.246.373.595.2] [image:9.595.307.521.419.643.2]© 2015, IRJET ISO 9001:2008 Certified Journal Page 1106
Fig. 16 Graph of membrane stresses of cooling tower diameter 300mm under earthquake zone V
2.5 Bending Moment in plates
Table 19Comparison of bending moments in plates for throat diameter 64m under seismic zone IV
Height Of Cooling Tower
Bending Moment (KN-m/m)
Cooling Tower with 300mm
thickness
Cooling Tower with 400mm
thickness
150 11.618 20.500
159 11.645 20.981
[image:10.595.330.566.368.561.2]170 10.658 19.652
Table 20Comparison of bending moments in plates for throat diameter 64m under seismic zone IV
Height Of Cooling Tower
Bending Moment (KN-m/m)
Cooling Tower with 300mm
thickness
Cooling Tower with 400mm
thickness
150 10.285 18.084
159 8.087 14.448
[image:10.595.30.290.481.668.2]© 2015, IRJET ISO 9001:2008 Certified Journal Page 1107
[image:11.595.22.544.40.676.2]Fig. 18 Graph of bending moment in plates of cooling tower diameter 400mm under earthquake zone IV
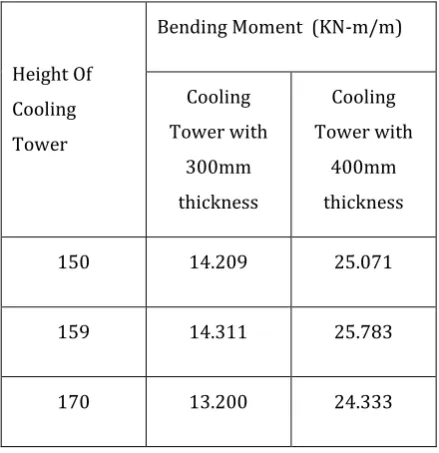
[image:11.595.34.256.79.312.2]Table 21Comparison of bending moment in plates for throat diameter 64 m under seismic zone V
[image:11.595.316.520.409.630.2]Fig. 19 Graph of bending moment in plates of cooling tower diameter 300mm under earthquake zone V
[image:11.595.30.250.422.649.2]Table 22 Comparison of bending moment in plates for throat diameter 64 m under seismic zone V
Fig. 20 Graph of bending moment of cooling tower diameter 400mm under earthquake zone V
CONCLUSION
Maximum nodal displacement
a) For seismic zone IV & V, for constant thickness & throat diameter, on increasing height of the Height Of
Cooling Tower
Bending Moment (KN-m/m)
Cooling Tower with
300mm thickness
Cooling Tower with
400mm thickness
150 14.209 25.071
159 14.311 25.783
© 2015, IRJET ISO 9001:2008 Certified Journal Page 1108
structure, the resultant of nodal displacement increases.
b) For seismic zone IV & V, for constant thickness, the resultant of nodal displacement decreases as height & throat diameter of the structure increases.
c) The cooling tower of all the three considered heights with 64m throat diameter having higher displacements as compared to the cooling towers with 70m throat diameter for 300mm & 400mm thicknesses respectively.
d) Higher values of nodal displacements are found in seismic zone V as compared to the values in seismic zone IV.
Maximum support reaction;
a) For seismic zone IV & V, for constant thickness & throat diameter, on increasing height of the structure, the support reaction increases. b) The cooling tower of all the three considered
heights with 64m throat diameter having lower support reactions as compared to the cooling towers with 70m throat diameter for 300mm & 400mm thicknesses respectively.
c) For seismic zone IV & V, the combination of 150m cooling tower, 64m throat diameter with 400mm thickness are giving the higher values of support reactions.
d) Higher values of support reactions are found in seismic zone V as compared to the values in seismic zone IV.
e) The cooling tower having 159m height with all other parametric combinations having least values of support reactions.
Maximum support moment
a) For seismic zone IV & V, for constant thickness & throat diameter, on increasing height of the structure, the support moments decreases.
b) The cooling tower of all the three considered heights with 64m throat diameter having lower support moments as compared to the cooling towers with 70m throat diameter for 300mm & 400mm thicknesses respectively.
c) For seismic zone IV, the combination of 159m cooling tower, 64m throat diameter with 400mm thickness are giving the lower values of support moments.
d) Higher values of support moments are found in seismic zone V as compared to the values in seismic zone IV.
Maximum shear stress in plates;
a) For seismic zone IV & V, shear stresses in plates of the hyperbolic cooling towers are found to approximately equal.
Maximum membrane stress in plates;
a) For seismic zone IV & V, for constant thickness & throat diameter, on increasing height of the structure, the membrane stresses in plates found increasing.
b) For seismic zone IV & V, for constant thickness, membrane stresses in plates increases as height & throat diameter of the structure increases. c) Higher values of membrane stresses in plates
are found in seismic zone V as compared to the values in seismic zone IV.
d) The percentage change in the values of membrane stresses in plates is negligible.
Maximum bending moment in plates;
a) For seismic zone IV & V, for constant thickness & throat diameter, on increasing height of the structure, the bending moment in plates increases.
© 2015, IRJET ISO 9001:2008 Certified Journal Page 1109
cooling towers with 70m throat diameter for 300mm & 400mm thicknesses respectively.
c) Higher values of bending moment in plates are found in seismic zone V as compared to the values in seismic zone IV.
REFERENCES
1. IS 1893 (Part 2&3): 2002,” Criteria for Earthquake Resistant Design of Structures”, Bureau of Indian Standards, New Delhi.
2. Seismic analysis and design of hyperbolic cooling tower by A.K.GUPTA sergeant and lundy, Chicago Illinois 60603 USA. Pg 1-10.
3. IS 11504-1985, Criteria for structural design of RCC natural draft cooling towers, BIS new delhi.
4. Types and forms of shell structures An idea book for designers, Pg 1-33.
5. Scawthorn“EarthquakeEngineering”StructuralE ngineering Handbook Ed. Chen Wai-Fah Boca Raton: CRC Press LLC, 1999
6. Gould, P.L. and Kratzig, W.B. “Cooling Tower Structures” Structural Engineering Handbook Ed. Chen Wai-Fah Boca Raton, CRC Press LLC, 1999
7. Abu-Sitta SH, Davenport AG. Earthquake design of cooling towers. Journal of the Structural Division, Pg 132-139.
8. Sollenberger NJ, Scanlan RH, Billington DP. Journal of the Structural Division 1980, Pg 601– 607.
9. Static and dynamic analysis of structures” A physical approach with emphasis on earthquake engineering, Pg 111-225.
10. Kratzig,W.B. and Zhuang, Y. 1992. Collapse simulation of reinforced natural draught cooling towers, Eng. Struct., Pg 291-299.