NOVEL FAULT DETECTION ON THREE-PHASE TRANSMISSION LINE
USING MODIFIED ARTIFICIAL NEURAL NETWORK WITH WAVELET
BASED ANALYSIS
M. Nithyavelam
and Siddappanaidu
Rangarajan Research and Development Institute of Science and Technology, Avadi, India Email: [email protected]
ABSTRACT
Fault type identification and fault distance calculation are the major phases of reliability improvisation in power transmission in terms of fault restoration. This paper proposes a novel approach for fault discovery of three-phase double transmission line, which is primarily based upon the discrete wavelet transformation (DWT) and modified neural network algorithm. The proposed identification requires double side three phase measured values of transmission current and voltage also considers the shunt capacitance. Three phase currents of most effective one end are measured and discrete features are extracted using discrete wavelet transform. Those features are then used as inputs to the Modified neural network algorithm. The training data set for modified neural network algorithm is obtained by way of simulating the ten extraordinary kinds of faults the use of diverse values of fault inception angles and fault resistances, so that the accurate consequences may be received. The proposed modified neural network algorithm employs twenty inputs and best one output for classifying the faults. The distinctiveness of the proposed approach is that all the features, inputs used in developing the algorithm are normalized, in order that the approach may be used for any system with none significant changes. The simulation of the three-phase transmission line network and discrete wavelet Transformation analysis are achieved inside the toolboxes of MATLAB® and modified neural network algorithm codes also are written in MATLAB®.
Keywords: wavelet transform, neural network algorithm, fault detection.
INTRODUCTION
The chance of fault occurrence is high when compared to other transmission systems, the main cause for this fault was power transmission system directly exposed to the varying real-time atmosphere conditions. The fault restoration directly deals with the time. Even minimum amount of delay will lead to the improper system stability and system failure. The fault location identification will significantly reduce the delay in
restoration activity. Fault location identification approach classified into following categories:
Frequency-based schemes. Traveling wave based scheme.
Synchronized measurement based scheme (PMU). Artificial intelligence based scheme.
Differential protection based scheme.
Figure-1. Line diagram of proposed fault identification power system network.
The transmission line network is shown in Figure-1. It contains of 500 kV, 50 Hz power transmission line distributed into 3 sections having length 200 km. In this study our concern is to design a directional relay thus section 2 is considered to be a primary line to be protected by relay installed at bus-2 and voltage and currents signals
measured at bus-2 are used. In section-2, fault section identifier FSI-2 determines the zone of fault and fault locator FL-2 estimates the location of the fault.
best affects the power quality of electricity provides to the patron but additionally improves the brief balance of the electricity system. The discovery of rapid virtual computers and huge information storage system gadgets has digitalized the complete energy system. The methods of fault detection are changing from analog to virtual; hence the algorithms for fault detection have to be modified for that reason. A few conventional methods which are based upon the electricity frequency additives of three-phase voltage and current signals (e.g. Over cutting-edge, distance, underneath/over voltage, differential, and so on.) are well recognized methods of fault detection. But those techniques are suffered from their inherent boundaries and are system based. The method of fault detection and classification begins with the measurement of three phase voltages and/or currents. The proposed approach uses the phase current of respective three levels at one factor of transmission network. The next very critical component is collecting of the information from the considered voltage/phase current samples. The following techniques are typically used for this reason: fourier transform [5], wavelet transformation [5], [8], [9], S Transformation [4] etc. The Fourier Transformation analyzes the whole signals in time domain best, so the constrained statistics can be extracted from this analysis tool. The localization of signal in Fourier Transformation is also not viable; the accuracy of technique is tormented by this lack of ability. The S Transformation is distinctly new tool in electrical power system, the validity and reliability of this technique remains a subject of look at. The proposed studies paper makes use of the Discrete Wavelet Transformation (DWT) for the evaluation of the
measured signals, which is a nicely established tool in energy System and is in used for years. The DWT transformation can analyze the indicators not most effective in time but also in frequency domain. Due to the fact the localization of the signal is also feasible by using windowing feature of the DWT, consequently required evaluation may be accomplished effectively. The sampling of required whole signals generates huge amount information and it isn't feasible to research this data without any tender computing method. Numerous soft computing strategies (e.g. Fuzzy logic, artificial neural network, modified neural network algorithms) are to be had for studying the data and to declare the significant conclusion from the sampled data set. Lots of research on artificial neural network (ANN) related to fault detection and type has been reported in the literature [3], [6], [8]. The proposed studies research adopted the Modified neural network algorithm for fault detection and classification in three-phase transmission network. The performance of any Modified neural network algorithm approach network relies upon the training and testing of the advanced modified neural network Algorithm. The rigorous training and checking out makes the use of modified neural network algorithm quite smooth, efficient and reliable. The method may be very clean and no rules are required for detection and category of different sorts of faults. Except this the system can be designed for any forms of three-phase transmission line fault with none threshold cost; the distinctive problems associated with the variations in electric power System parameters are also treated.
Figure-2. Block diagram of proposed DWT and MANN based fault section identifier and fault locator.
The block diagram representing the proposed system to detect the fault section and its location in a transmission system is shown in Figure-2. Initiation of fault at any point in a network results in huge current flow. This causes a severe drop in the voltage at bus close to the fault point. For this reason, voltage and current at bus 2 in a network are used to identify fault section and its location in a system. The wavelet transform is a linear transform which gives better time-frequency resolution for a given signal as compared with the results given by the Fourier transform. The wavelet transform has capabilities of providing accurate location and classification of electrical transients in power system.
This paper is assessed into 5 chapters: the first part incorporates the quick introduction of the related studies work already finished an introduction of the proposed approach, in the second chapter discrete wavelet Transformation and in its software in fault category is discussed. The third chapter is about the basic principles of modified neural network algorithm, it's training, in fourth chapter model beneath consideration and its effects are mentioned, the fifth chapter is the conclusion of this paper. The overall twenty inputs are used as inputs and one output is assigned in order to detection and category of the faults by way of modified neural network algorithm. The effects of simulation set up the validity of the proposed approach.
MANN module For fault section Pre-processing Of voltage and
Current signals Using discrete
Wavelet Transform 3-phase
Voltages
Figure-3. Three-phase voltage and current signal of double circuit line during LL fault in circuit-1.
To investigate the voltage and current signals of two circuits during the faulty situation, consider a single line to a ground fault has occurred in circuit-1 at 60 ms. At 60 ms, A1G fault has occurred in circuit-1, so phase ‘‘A’’ phase current of circuit-1 increases and other phase currents remains same as shown in Figure. 3. In circuit-2 the phase ‘‘A’’ current is disturbed owing to the zero sequence mutual coupling between the two phases of double circuit line.
Processing of signals and fault information collection Processing of signals and Fault Information Collection is the first step in the procedure of fault classification of the three-phase transmission network is to gather the proper electrical signal, that's used inside the manner of fault detection and classification. The information received from the evaluation create the signal is beneficial in maintaining the kind of fault. Any electric three-phase transmission network has simplest two signals that can be received and analyzed correctly. The first is voltage and second is Phase Current. On this paper, the Phase Current of respective three stages of transmission network at bus one is measured i.e. the proposed technique makes use of the signals of 1 location handiest. The continuous wavelet Transform (CWT) is a very commanding System for reading an electric signal. The CWT can examine the signals in the time domain as properly in frequency area, as it can decompose the sign into one of a kind frequency ranges through the use of fixed wavelet function referred to as parent wavelet with
the assist of translation and dilation belongings. Loads have been on the wavelet transformation; nonetheless, the quick idea about CWT is presented here to make the proposed method clean for readers. The CWT of any signal f(t) is represented by
𝐶𝑊𝑇(𝑎, 𝑏) = 1
√|𝑎|∫ 𝑓(𝑡)𝜓(
𝑡 − 𝑏 𝑎 ∞
−∞ )𝑑𝑡
using in which, 𝜓(t) is parent wavelet, which essentially is a windowing characteristic, t is time, a and b are the dilation and translation parameters respectively. The parameters a and b, each are continuous parameters with appreciate to time [11]. The realistic packages of CWT are constrained as to be had signals might also vary in nature e.g. Stationary bound to non-stationary bound. Besides this, the information provided by way of CWT may be very big, which makes the analysis of data and choice making tough. The above hassle is addressed with the Discrete Wavelet transform (DWT), which a digitalized shape of CWT and might be obtained without difficulty. The DWT of any signal x(t) is represented by
𝐷𝑊𝑇(𝑚, 𝑘) = 1
√𝑎0𝑚
∑ 𝑥(𝑡)𝜓 𝑛
(𝑘 − 𝑛𝑏𝑎 0𝑎0𝑚 0𝑚 )
way of where ѱ(t) is the parent wavelet, a0 is
implementation of DWT is executed with the aid of degree filtering i.e. One filter is a high pass filter and second is filter low pass filter. The DWT damage the received present-day sign into diverse frequency stages and this is done by means of down sampling route of technique. The acquired phase current signal is passed via low pass filter
and excessive bypass filter concurrently, consequently damaged into by excessive frequency part and low-frequency part. This method is typically acknowledged as the multi decision evaluation (MDE) i.e. Analysing the sign at numerous and extraordinary frequency levels.
Figure-4. Discrete wavelets transform analysis.
The functional execution of DWT is attained by two-stage filtering i.e. one filter is a high pass filter and second is filter low pass filter. The DWT break the obtained current transmission signal into several frequency ranges which are accomplished by straight down sampling span of the process. The acquired current transmission signals are passes through low pass filter and high pass filter simultaneously, therefore broken into simply by high-frequency part and a low-frequency component. This method is generally identified as the Multi Quality Analysis (MQA) i.e. examining the signal at numerous and various frequency amounts. The analysis supplies the approximate and fine detail coefficients. The approximate and details coefficients attained by down sampling course. This info and approximate coefficients contain useful info, based upon that your types of fault could be classified. The complete process could be understood easily simply by Figure-1. This paper has adopted the Daubechies mother wavelet of level four (Db4) for evaluation of three stage current because Db4 provides most accurate outcomes for power system signals. The measured three stage respective current is analyzed up to the amount of four for obtaining fine detail and approximate coefficients. The precision and performance are dependent upon the degree of decomposition, the decomposition did up to level 4, which gives required accuracy. The analysis affords the
approximate and detail coefficients. The approximate and element coefficients accomplished by using down sampling route. Those info and approximate coefficients comprise useful records, based totally upon which the forms of the fault may be categorized.
respective to the three phase currents; correspondingly there are general six element coefficients three for degree three and three for four stages respectively. Overall twenty one of kind mixtures ten for degree three and ten for stage four are fashioned based totally upon the element coefficients of the three section cutting-edge signal. Those twenty combos of exact coefficients of three-phase currents are used to make the inputs information set. This records set is employs for growing the proposed Algorithm. The Figure-1 depicts obtained three phase currents for healthy system. The three currents are balanced and symmetric. Figure-3 depicts the received three phase currents for line to ground fault on phase A, the distortion may be discovered. Those three phase distorted currents when analyzed with the help of DWT offers exclusive values of approximate and element coefficients.
MODIFIED NEURAL NETWORK ALGORITHM The generated data from the simulation of three-phase transmission network contain masses of data approximately the fault and the information cannot be analyzed with any suitable artificial shrewd approach. Modified neural network algorithm can be applied for fault classification correctly because it's for a programming technique applicable to the troubles where the information to be had in big, vague, redundant,
distorted and cannot be sorted out via any linear programming approach. In the problems of fault classification, they're efficaciously relevant because of: They may be educated by using offline information and in addition, can be used online
There are numerous elements which impact the fault category e.g. Fault impedance, fault inception angle, distance from the relaying points and many others. The outcomes of Modified neural network Algorithm
are delay less processing, dependable and accurate, if it's miles educated properly and may be retrained easily.
The weights may be changed easily, even at some stage in the feature training procedure.
The basic Modified neural network algorithm network has 4 simple tools in performing its complete challenge:
choice of the populace- approach the enter statistics set which can come to be a better parent
go over from the chosen populace- accomplishing near to better answer i.e. From the parent of ultimate step production of recent and better offsprings Mutations of off-springs- elimination of similar
[image:5.595.75.523.426.625.2]solutions i.e. On similar off-springs is used in further choice
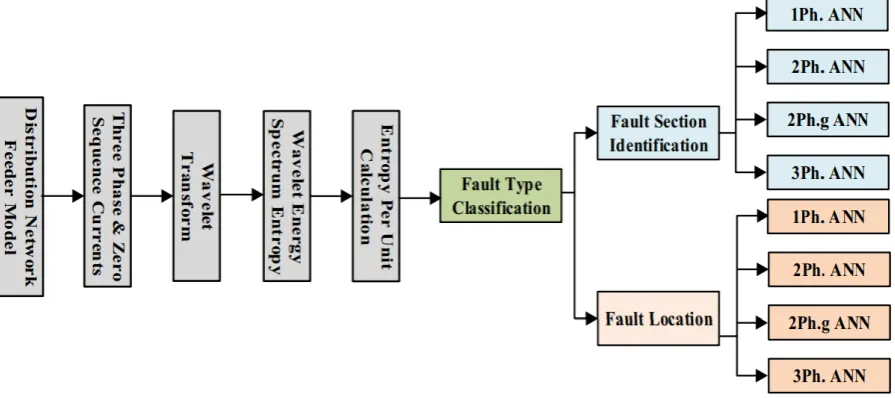
Figure-5. Proposed fault identification technique based on DWT and MANN for a 3-phase transmission line.
Survival of mightiest and fittest-the final solution i.e. the satisfactory outcomes are to sustain and utilized. The performance of any modified neural network algorithm depends upon the schooling of community. The proposed approach has adopted dynamic weights method so that the Algorithm can converse without difficulty and quick. The procedures for the overall operation of the proposed system 2-stage modified method are exposed in Figure. 4. The fault power signal current waveforms are disintegrated using discrete wavelet transform. entropy calculated is later computed and given as the input to the
MANN model. The specific MANN prototypical to use is resolute over the use of the fault-type identification algorithm proposed.
Primary concepts of modified neural network algorithm and modeling of the modified neural network algorithm
each provides the potential to deal with the nonlinearity worried within the hassle of fault detection and type. The typical advanced Modified neural network algorithm version techniques the output by taking the sum of the output of Sigmoid characteristic and Gaussian characteristic. Subsequently, the proposed model is known as summation kind version. The very last output of the Modified neural network algorithm is a feature of two
outputs OΣ and Oπ, where Σ is summation characteristic
and π is aggregation characteristic. The output of
summation component is given via
oε= 1 e⁄ −λs∗s_net
Where 𝒔𝒏𝒆𝒕= Σ𝑊𝑖𝑋𝑖+ 𝑋𝑂Σ
The overall results of the product aggregation part can be denoted as
𝑂𝜋= 𝑒−𝜆𝑝∗𝑝𝑖_𝑛𝑒𝑡2
Where p _ net 𝜋𝑊𝑖𝑋𝑖𝑋𝑂𝜋 and the final output of the MNN is given by (5).
𝑀𝐴𝑁𝑁𝑜𝑢𝑡𝑝𝑢𝑡= 𝑂Σ∗ 𝑊 + 𝑂𝜋 ∗ (1 − W)
B. Error minimization in MNN
The output of the Modified neural network set of rules truly will include error, and this mistake is calculated and minimized with the aid of evaluating it with the favored output. Essentially the sum squared errors for convergence of version is used. The sum squared error Ep is given by means of
Ep Ei
where, Ei is error i.e. 2 Ei (Yi Oi) between input Yi and output Oi .
There are handiest ten forms of fault, that could arise on a transmission line. The output matrix may be formed easily because of this, as most effective ten elements are sufficient for representing the all viable faults on a 3 phase transmission line. The Modified neural network set of rules model is educated and examined again and again that allows you to decrease the education time with an increase in accuracy and overall performance. The coding of Modified neural network algorithm is accomplished in MATLAB.
INTRODUCTION OF THE SIMULATED MODEL
Figure-6. Flowchart for proposed fault classification algorithm.
RESULTS AND DISCUSSIONS
The proposed digital wavelet and MANN based relay are compulsory to be tested for all types of faults (both forward and reverse) with dissimilarities in fault and network factors through which the network was not trained earlier. The performance of the proposed scheme is evaluated for around 10,000 different faulted cases with varying fault type (LG, LL, LLG), fault location, fault resistance, far end faults, near end faults, forward and reverse section faults and compared with previous techniques. The test results show that the proposed MANN based scheme provides much accurate fault location estimation technique. The response of the proposed scheme for backup protection operation during faults in adjacent forward and reverse line sections is also checked and discussed in the following sub-sections.
Effect of changing fault resistance
To study the effect of varying fault resistance on the performance of the proposed technique based on ANN; different types of fault in section-2 with varying fault resistance including high impedance fault (HIF) has been tested. The test results of ANN-based fault section identifier and ANN based fault locator for variation in fault resistances for different types of faults at different fault location ranging from 0.1 to 99.9 km from the relaying point are shown in Tables 1 and 2 respectively. As the fault is in section2, all the outputs are high (1) for S2 and low (0) for other output of ANN-based section
identifier as shown in Table-1. For different types of fault with different fault resistances, the estimated fault distance and percentage error in the location of fault estimated by ANFIS and proposed ANN technique are given in Table-2. The percentage error in fault location is calculated using the formula (6).
To research the result of varying fault level of resistance on the overall performance of the proposed technique predicated on MANN; various kinds of fault in section-2 with varying fault level of resistance including high impedance fault (HIF) offers been examined. The test outcomes of MANN centered fault section identifier and MANN structured fault locator for variation in fault resistances for various kinds of faults at different fault area which range from 0.1 to 99.9 km from the relaying stage are demonstrated in Tables 1 and 2 respectively. As the fault is usually in section2, all of the outputs are high (1) for S2 and low (0) for the additional result of MANN centered section identifier as proven in Table 1. For various kinds of fault with different fault resistances the approximated fault range and percentage mistake in the area of fault approximated by proposed MANN technique are definitely given in Table-2. The percentage mistake in fault area is usually calculated using the following method.
% Error = {Actual distance − Estimated distanceTotal line length ]
∗ 100
Table-1. Test results of ANN-based fault section identifier for varying fault resistance.
Fault resistance (Ω)
Fault type
Fault distance
(km) Section 1 Section 2 Section 3 Section 4
5 LG 5 10−10 0.99 0 0
4 LL 12 0 10−10 0.99 0
20 LLG 80 10−10 1.00 0 10−10
15 LL 70 10−10 10−10 1.00 0
50 LLG 60 10−10 0.99 0 10−10
Table-2. Percentage error in the location of fault estimated by proposed ANN-based fault locator with varying fault resistance.
Fault resistance (Ω)
Fault type
Actual distance (km)
MANN estimated distance
(km)
% Error in MANN based scheme
5 LG 14 13.2 0.80
7 LL 55 54.9 0.10
12 LLG 20 19.22 0.88
25 LL 80 80.12 -0.12
51 LLG 40 40.33 -0.33
Backup safety to adjacent reverse section-1 faults The relay located in bus-2 offers been also tested for faults backward path from the relay location i.e. in section-1 and relay location details are provided in Tables 3 and 4. The fault location is demonstrated negative as they are invert faults in LHS from bus-2. The result S1 is usually
high (1) and S2 and S3 are low (0) for all your reverse fault instances as proven in Table-3. The approximated fault area and percentage error calculated for invert faults using MANN are demonstrated in Table-4. The proposed MANN centered technique estimate the fault area with maximum 0.90% error and minimum 0.02% error which is a lot lesser.
Table-3. Test results of ANN-based fault section identifier for different reverse faults.
Fault type Fault distance
(km) Section 1 Section 2 Section 3 Section 44
LG -7 10−6 0.99 0 10−5
LL -20 0 10−10 1.0 0
LLG -14 10−10 1.00 0 10−10
LL -55 10−10 10−10 1.00 10−6
LLG -60 10−10 1.0 0 10−10
Table-4. Error in the location of different reverse faults.
Fault Type Actual distance (km)
MANN estimated distance (km)
% Error in MANN based scheme
LG -79 -78.90 -0.10
LL -15 -15.02 0.02
LLG -25 -24.10 -0.90
LL -55 -54.90 -0.10
LLG -10 -10.40 0.40
LG -30 -29.90 0.10
Table-5. %Error in a location of different types of faults at boundary locations.
Location Fault type
Actual distance (km)
MANN estimated distance (km)
% Error in MANN based scheme
Near End Faults LG 10 10.2 0.20
Near End Faults LL 3 2.99 -0.01
Near End Faults LLG 4 3.70 0.30
Far End Faults LL 84 84.12 0.12
Far End Faults LLG 90 90.33 0.33
Far End Faults LG 89 89.50 0.50
The result of faults in the boundary area
The fault occurring in Transmitting end bus should be identified correctly while the fault current is quite saturated in case of near end faults. For examining the near end faults, the fault area is usually varied between 1-5 km in section-2 with the increment of 0.5 km with zero fault inception angle, zero fault level of resistance and test outcomes of MANN based fault locator for various kinds of faults are demonstrated in Table-5. To judge the reach establishing of the proposed technique, various kinds of faults at different places near to much end bus from 91 to 99 km from the relaying stage with the increment of just one 1 km are also studied and Transmission Location details are proven in Table 4. The proposed MANN centered fault locator will be able to
locate the near end and significantly end faults with optimum % error 0.0100 and minimum % error 0.01, which is a lot lesser scheme seeing that Table-5.
CONCLUSIONS
network set of rules for extraordinary running situations e.g. Fault inception attitude, fault resistance and ten one of a kind forms of faults. The scheme is tested time and again by using testing the set of rules for unique records set. The time taken for educating the MANN is very much less and occupies less reminiscence space of the system. The consequences proven in the given figure helps that the supplied technique may be very effective and strong in the category of the fault kind. All efforts had been made in the modeling of the 3 segment transmission line to fit with the actual existence transmission line. The mean of all errors of fault type is less than 0.02 % for the system below examine.
REFERENCES
[1] Arrillaga J., Bradly D.A., Bodger P.S. 1985. Power system harmonics. (John Wiley, New York, NY)
[2] I.Daubechies. 1992. Ten Lectures on Wavelets. Society for Industrial and Applied Mathematics, Philadelphia, PA.
[3] Z. Moravej, A.A.Abdoos and M. Sanaye-Pasand. 2010. A new approach based on s-transform for discrimination and classification of inrush current from internal fault currents using the probabilistic
neural network,‖ Tailor and Francis, Electric Power
Components and Systems. 38: 1194-1210.
[4] Sundaram E., Venugopal M. 2016. On design and implementation of three phase three level shunt active power filter for harmonic reduction using synchronous reference frame theory. Electr. Power Energy Syst. 81: 40-47
[5] P. Pillay and A. Bhattacharjee. 1996. Application of wavelets to model short-term power system disturbances. IEEE Transactions on Power Systems. 11: 2031-2037.
[6] L.A. Snider, Y.S. Yuen. 1988. The artificial neural networks-based relay algorithm for the detection of
stochastic high impedance faults, ‖ Neurocomputing.
23, pp. 243-254.
[7] Mishra S. 2016. Optimization based frequency and harmonics estimation. MTech thesis, National Institute of Technology, Raipur.
[8] Majid Jamila, Abul Kalama, A.Q. Ansaria, M. Rizwan. 2014. Generalized neural network and wavelet transform based approach for fault location estimation of a transmission line. Elsevier, Applied Soft Computing. 19: 322-332.
[9] W.D.Breingan, M.M. Chen, T.F. Gallen. 1979. Laboratory investigation for a digital system for the protection of transmission lines. IEEE Transactions on Power Apparatus and Systems. 98(2): 350- 368.
[10]Hasheminejad S., Seifossadat S.G., Morteza, R., et al. 2016. Traveling-wave-based protection of parallel transmission lines using teager energy operator and fuzzy systems. IET Gener. Transm. Distrib. 10(4): 1067-1074.
[11]M. Kezunovic, B. Perunicic. 1996. Automated transmission line fault analysis using synchronized sampling at two ends. IEEE Transactions on Power Systems. 11(1): 441-447.
[12]Chul Hwam Kim and Rajesh Agarwal. 2001. Wavelet transforms in power system-Part-II: Examples of application to actual power system transients. IEEE Tutorial: Power Engineering Journal. pp. 193-202.
[13]de Morais Pereira, C.E., Zanetta L.C. 2004. Fault location in transmission lines using one-terminal postfault voltage data. IEEE Trans. Power Deliv. 19(2): 570-575.
[14]Koley E., Kumar R., Ghosh S. 2016. Low-cost microcontroller-based fault detector, classifier, zone identifier and locator for transmission lines using wavelet transform and artificial neural network: a hardware co-simulation approach. Electr. Power Energy Syst. 81, pp. 346-360.
[15]Aguilera C., Orduna E., Ratta G. 2006. Adaptive non-communication protection based on traveling waves and impedance relay. IEEE Trans. Power Deliv. 21(3): 1154-1162.