Georgia State University
ScholarWorks @ Georgia State University
Public Health Theses School of Public Health
8-9-2016
Adverse Childhood Experiences and the
Association with Childhood Obesity: A
Cross-Sectional Study of the U.S. National Survey of
Children’s Health (NSCH), 2011-2012.
Omarwalid Noorzada
Follow this and additional works at:https://scholarworks.gsu.edu/iph_theses
This Thesis is brought to you for free and open access by the School of Public Health at ScholarWorks @ Georgia State University. It has been accepted for inclusion in Public Health Theses by an authorized administrator of ScholarWorks @ Georgia State University. For more information, please contact
Recommended Citation
Noorzada, Omarwalid, "Adverse Childhood Experiences and the Association with Childhood Obesity: A Cross-Sectional Study of the U.S. National Survey of Children’s Health (NSCH), 2011-2012.." Thesis, Georgia State University, 2016.
ABSTRACT
INTRODUCTION: Studies on the topic of adverse childhood experiences (ACEs) and childhood obesity collectively indicate an association, but there is a lack of replication in nationally representative sample of children aged 10-17 years. This study aims to expand on the definition of ACEs to include: socio-economic hardship, racial
discrimination, witness or victim of neighborhood violence, and bereavement, and to examine their individual and joint association with BMI levels, especially childhood obesity (primary outcome).
METHODS: The 2011-2012 National of Children’s Health (NSCH) was used for this study (N=45,309). One child interview weight was produced; hence, the estimates are generalized to all non-institutionalized children 10-17 years of age in the US and each state. Statistical methods used included descriptive statistics and multivariable
multinomial logistic regression models.
ACEs examined included: (1) Socioeconomic hardship, (2) Parental divorce or
separation, (3) Bereavement, (4) Incarcerated family member, (5) Witness to domestic violence, (6) Victim/witness of neighborhood violence, (7) Household mental illness, (8) Household substance abuse, (9) Racial discrimination.
BMI for the same sex and age (10-17 years) percentile relative measurement, using growth charts recommended by CDC, among children and teens were used as indicators of BMI. BMI-95th percentile or greater was considered obese.
Approximately 25.4 million (89.5%) children aged 10-17 years had experienced 3 or less ACE. The most prevalent ACE category of nine asked about for child was-living with parents who were either divorced or separated after his/her birth (26.77%) and- the least prevalent was living with a parent who died (4.84 %). ACEs were not mutually exclusive, and all nine categories of ACEs were interrelated.
The adjusted odds ratio of covariates to their reference groups that were only
statistically significant for childhood obesity relative to healthy weight encompassed: a) Place of residence in metropolitan statistical area, b) two or more chronic health
conditions of 18 asked about, c) Watching TV, videos, or playing video games across categories >1 to <4 hours and ≥4 hours, d) family members in the household eat a meal together 7 days of the week, e) and computer, cell phone or electronic device use ≤1 hour.
Moreover, the explanatory variables, namely, age, sex, physical health status of parents, and physical activity, were strongly related to childhood obesity (associated both with higher odds and lower odds of outcome) compared to overweight and underweight BMI categories.
CONCLUSIONS: This is the first study to explore the co-occurrence, individual and joint association of ACEs with childhood obesity using nationally representative sample of children aged10-17 years in the U.S. Having childhood obesity, BMI-95th percentile or above was strongly related to ACE dichotomy, ACE score ≥2 and two ACE types
(socioeconomic hardship and bereavement) than the probability of overweight, BMI-85th to 94th percentile. Underweight-BMI less than 5th percentile had only statistically significant association with socioeconomic hardship ACE category. Sociodemographic, parental, and childhood related factors were also independently associated with childhood obesity.
ADVERSE CHILDHOOD EXPERIENCES AND THE ASSOCIATION WITH CHILDHOOD OBESITY: A CROSS-SECTIONAL STUDY OF THE U.S. NATIONAL SURVEY OF CHILDREN’S
HEALTH (NSCH), 2011-2012.
by
OMARWALID NOORZADA
M.D., KABUL MEDICAL UNIVERSITY
A Thesis Submitted to the Graduate Faculty of Georgia State University in Partial Fulfillment
of the
Requirements for the Degree
MASTER OF PUBLIC HEALTH
ATLANTA, GEORGIA 30303
APPROVAL PAGE
ADVERSE CHILDHOOD EXPERIENCES AND THE ASSOCIATION WITH CHILDHOOD OBESITY: A CROSS-SECTIONAL STUDY OF THE U.S. NATIONAL SURVEY OF CHILDREN’S
HEALTH (NSCH), 2011-2012.
by
OMARWALID NOORZADA
Approved:
Dr. Shanta Rishi Dube Committee Chair
Dr. Matthew Hayat Committee Member
Author’s Statement Page
In presenting this thesis as a partial fulfillment of the requirements for an advanced degree from Georgia State University, I agree that the Library of the University shall make it available for inspection and circulation in accordance with its regulations governing materials of this type. I agree that permission to quote from, to copy from, or to publish this thesis may be granted by the author or, in his/her absence, by the professor under whose direction it was written, or in his/her absence, by the Associate Dean, School of Public Health. Such quoting, copying, or publishing must be solely for scholarly purposes and will not involve potential financial gain. It is understood that any copying from or publication of this dissertation which involves potential financial gain will not be allowed without written permission of the author.
OMARWALID NOORZADA
DEDICATION
This thesis research project would not have been possible without Allah’s grace and the
love and support from my family. I would like to dedicate this work to all my family
members who are the equator and prime meridian of my love. My father who is the
hero of my life, my mother where paradise lies beneath her feet, my two sisters who are
the angels on earth, and my small brother who is my best friend. I also want to dedicate
this work to my late grandfather who is my role model in life.
ACKNOWLEDGMENTS
THESIS COMMITTEE CHAIR: Dr. Shanta Rishi Dube
THESIS COMMITTEE CO-CHAIR: Dr. Matthew Hayat
GSU-SCHOOL OF PUBLIC HEALTH ADVISOR: Gina Sample
GSU-SCHOOL OF PUBLIC HEALTH: Instructors and Administration
GSU-INTERNATIONAL STUDENT AND SCHOLAR SERVICES ADVISOR: Mike Townsend
INTERNATIONAL INSTITUTE OF EDUCATION ADVISOR: Tom Koerber
DATA RESOURCE CENTER: Child and Adolescent Health Measurement Initiative
THE FULBRIGHT SCHOLARSHIP PROGRAM FOUNDER: Senator J. William Fulbright
THE FULBRIGHT SCHOLARSHIP PROGRAM FOR CITIZENS OF AFGHANISTAN:
The U.S. Department of State’s Bureau of Educational and Cultural Affairs
LIST OF TABLES
TABLE 2.1. Potentially Reversible Causes of Weight Gain……….21
TABLE 2.2. Literature Review Table of Causes of Childhood Obesity………23
TABLE 2.3. Literature Review Table of Consequences of Childhood Obesity………29
TABLE 2.4. Original ACE Study-ACE Burden, Scores and Associated Health Problems (N=17,337)……….36
TABLE 2.5. Total Lifetime Costs of Child Maltreatment 2008 United States………..38
TABLE 3.1. Adverse Childhood Experiences Among Children in the NSCH 2011-2012. ACEs Definitions are Based on after the Child’s Birth………..55
TABLE 3.2. BMI-Class for Children of the Same Sex and Age……...………60
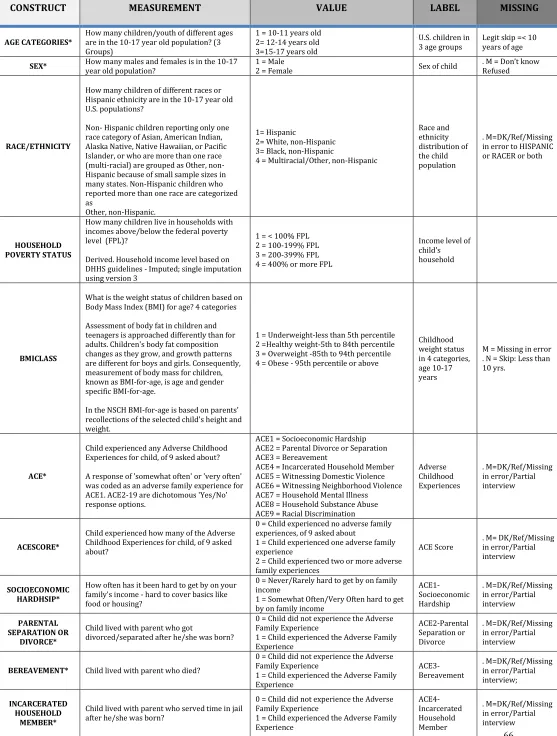
TABLE 3.3. Glossary and Explanation of Variables (2011-2012 NSCH….……….66
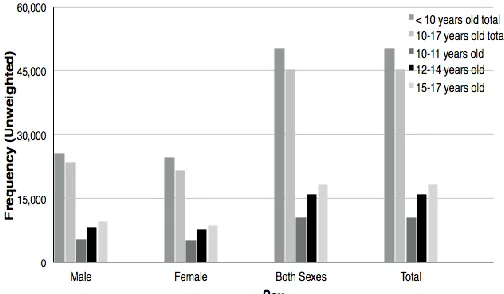
TABLE 4.1. Distribution of Age Categories by Sex………..79
TABLE 4.2. Prevalence of Each Category of ACE, ACE Scores, RACE And Household Poverty Status by Gender Among U.S. Children 10-17 Years Old. The 2011-2012 National Survey of Children’s Health (N=45,309)………..80
TABLE 4.3. Frequency Distribution of Number of ACEs……….82
TABLE 4.4. Childhood Obesity Distribution by and RACE Controlling for Gender among Children Aged 10-17 Years in the U.S.……….84
TABLE 4.5. Prevalence of Reporting of Additional Categories of ACEs Among U.S. Children 10-17 Years Old, Who Reported Exposure to First Category of ACE. The 2011-2012 National Survey of Children’s Health (N=45,309)………...87
TABLE 4.6. Tetrachoric Correlation Of Reporting of Additional Categories Of ACEs Among U.S. Children 10-17 Years of Age Who Reported Exposure To First Category Of ACE. The 2011-2012 National Survey of Children’s Health (N=45,309)…………...88
TABLE 4.7. Distribution and Association (Unadjusted Odds Ratio) of Participants’ Characteristics by their ACE Status among U.S. Children Aged 10-17 Years. The 2011-2012 National Survey of Children’s Health (N=45,309)………...91
TABLE 4.8. Distribution And Association (Unadjusted Odds Ratio) of Participants’ Characteristics by their BMI for Age Status among U.S. Children Aged 10-17 Years. The 2011-2012 National Survey of Children’s Health (N=45,309)……….96
TABLE 4.9. Crude And Covariate Adjusted Odds Ratios of Obesity; Overweight and Underweight Relative to Healthy Weight Among U.S. Children Aged 10-17 by Selected Demographic and Behavioral Characteristics. The 2011-2012 National Survey Of Children’s Health (N=45,309).………..104
TABLE 5.1. Effect of ACE Missing Values on Childhood Obesity……….114
LIST OF FIGURES
FIGURE 1.1 - Adverse Childhood Experiences Measured in NSCH 2011-2012………08
FIGURE 2.1 - Age–Standardized Prevalence of Overweight and Obesity, and Obesity Alone (Based On IOTF Cutoffs), Ages 2–19 Years, by Sex, 1980–2013……….13
FIGURE 2.2 - Prevalence of Overweight And Obesity (BMI>=25) And Obesity (BMI>=30), By Age And Sex, 2013………...14
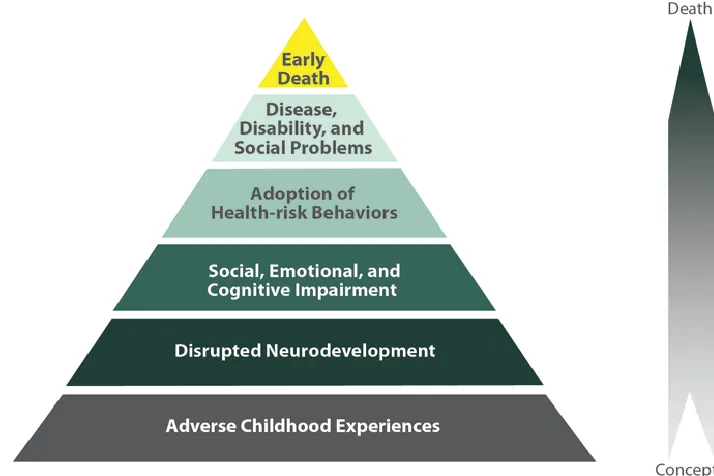
FIGURE 2.3 - The ACE Pyramid: Conceptual Framework for the Ace Study………...37
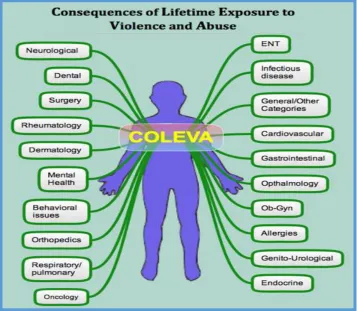
FIGURE 2.4 - Consequences of Lifetime Exposure to Violence and Abuse………..44
FIGURE 3.1 - National Survey of Children's Health Sampling and Survey Admininstration………..51
FIGURE 4.1 - Distribution of Age Categories by Sex………..79
FIGURE 4.2 - Weighted Total % of ACES………..81
FIGURE 4.3 - Frequency Distribution of Number of Aces………..82
FIGURE 4.4 - Top 10 Highest Levels of Obesity by States (Including DC) in the U.S. among Children 10-17 Years. The 2011-2012 National Survey of Children’s Health……….83
FIGURE 4.5 - Top 10 Highest Levels of ACE by States (Including DC) in the U.S. among Children 10-17 Years. The 2011-2012 National Survey Of Children’s Health………..83
FIGURE 4.6 - Comparison of BMI Class Frequencies ( Unweighted) by Sex………..84
FIGURE 4.7 - Comparison of BMI Class % (Weighted) by Sex………84
FIGURE 5.1 - BMI Class Distribution among U.S. Children Aged 10-17 Years………108
FIGURE 5.2 - Top 10 Highest ACES % (Weighted) and its Correlation with its Corresponding Obesity % (Weighted) by States (Including DC) in The U.S. Among Children 10-17 Years. The 2011-2012 National Survey of Children’s Health. ...109
FIGURE 5.3 - The ACE Pyramid: Conceptual Framework for the ACE Study………..117
FIGURE 5.4 - Potential Mechanisms of Action of ACE Leading To Childhood Obesity..118
FIGURE 5.5 - Reasons for the Early Prevention and Control of Childhood Obesity……120
FIGURE 5.6 - Association Between ACES And Childhood Obesity in Individualistic Vs. Collectivistic Societies………..121
TABLE OF CONTENTS
DEDICATION ... III ACKNOWLEDGMENTS ... IV LIST OF TABLES ... V LIST OF FIGURES ... VI
CHAPTER 1: INTRODUCTION ... 1
1.1BACKGROUND ... 2
1.2PURPOSE OF RESEARCH/RATIONAL ... 8
CHAPTER 2:REVIEW OF LITERATURE ... 11
2.1CHILDHOODOBESITY ... 12
2.1.1 Epidemiology/Burden ... 12
MALNUTRITION-THE DOUBLE BURDEN: ... 18
2.1.2 Risk Factor and Etiology ... 19
2.1.3 Prognosis and Consequences ... 26
2.2THECONTRIBUTIONOFADVERSECHILDHOODEXPERIENCESTOOBESITY ... 31
2.2.1 Origins of ACE Study:... 31
2.2.2 Epidemiology/Burden ... 32
2.2.3 Risk Factor and Etiology ... 34
2.2.4 Prognosis and Consequences ... 35
2.2.5 Overview of ACES Association with Childhood Obesity: ... 39
CHAPTER 3:METHODS AND PROCEDURES ... 49
3.1STUDYDESIGNANDSAMPLE ... 50
3.2INCLUSIONANDEXCLUSIONCRITERIA ... 52
3.3DEFINITIONOFTERMS/MEASUREMENT ... 53
3.3.1 Adverse Childhood Experiences (ACE) - Main Independent Variable) ... 53
3.3.2 Childhood Obesity (Main Outcome) ... 56
3.3.3 COVARIATES ... 61
3.4STATISTICALANALYSIS ... 69
3.4.1 Characteristics of the Study Population By Sex, ACE Status, BMI-CLASS and State: ... 71
3.4.2 Relationship Between Categories of ACE: ... 74
3.4.3 Covariate Adjusted (Final Model) Analysis of BMI-Classes Relative to Healthy Weight: (Multivariate Analysis): ... 74
3.4.4 Missing Information on Exposure and Outcome Variables (Unadjusted OR): ... 76
3.5ETHICALSTATEMENT ... 77
CHAPTER 4: RESULTS ... 78
4.1CHARACTERISTICS OF THE STUDY POPULATION: ... 79
4.3ACE AND CHILDHOOD OBESITY DISTRIBUTIONS BY STATES IN THE UNITED STATES: ... 83
4.4CHILDHOOD OBESITY DISTRIBUTION BY GENDER AND RACE IN THE UNITED STATES: ... 84
4.5RELATIONSHIPS BETWEEN CATEGORIES OF ADVERSE CHILDHOOD EXPERIENCES: ... 85
4.6DISTRIBUTION AND ASSOCIATION (UNADJUSTED ODDS RATIO) OF PARTICIPANTS’ CHARACTERISTICS BY THEIR ACE STATUS: ... 86
4.7DISTRIBUTION AND ASSOCIATION (UNADJUSTED ODDS RATIO) OF PARTICIPANTS’ CHARACTERISTICS BY BMI-CLASS: ... 93
4.8DISTRIBUTION AND ASSOCIATION (UNADJUSTED ODDS RATIO) OF PARTICIPANTS’ACE STATUS, ACE SCORE AND ACE CATEGORIES BY BMI-CLASS: ... 94
4.9.1CRUDE AND COVARIATE ADJUSTED (FINAL MODEL)ASSOCIATION OF BMI-CLASSES RELATIVE TO HEALTHY WEIGHT: ... 100
4.9.2ACE AND CHILDHOOD OBESITY: ... 102
CHAPTER 5: DISCUSSION ... 106
5.1DISCUSSIONOFRESEARCHQUESTIONS: ... 107
5.2STUDYSTRENGTHSANDLIMITATIONS: ... 112
5.2.1 Strengths: ... 112
Note:Odds Ratios of Obesity for those with ACE vs. No ACE are unadjusted and are calculated from unweighted frequencies. ... 114
5.2.2 Limitations: ... 114
5.3IMPLICATIONSOFFINDINGS: ... 116
Potential Mechanisms by Which ACES Lead to Childhood Obesity: ... 117
5.4RECOMMENDATIONSANDPREVENTIONSTRATEGIES: ... 119
5.5FURTHERRESEARCHQUESTIONS: ... 120
5.6CONCLUSION: ... 122
2 1.1 Background
Obesity is one of the 21st centuries public health issues that lies at the other end
of the spectrum of malnutrition, which has transcended geographical boundaries and
now has inscribed itself as a global epidemic “globesity”(World Health Organization
[WHO], 2015). It affects individuals of all ages, both sexes, wealthy and poor, developed
and developing countries around the world (WHO, 2015).
It is a [disease] (AMA News Room, 2013) that has been “one of the greatest
neglected health problems of our time” that grave repercussions “as great as that of
smoking”, stated by The World Health Organization press release in 1997 (In K. M. Goel
& D. K. Gupta, P.438).
Over and above, recently under the campaign of lets’ move, led by the first lady of
the United States Michelle Obama, the issue of childhood obesity was highlighted in the
United States. On the first day of her campaign, she contended, "The physical and
emotional health of an [entire generation] and the economic health and security of our
nation is at stake." (Michelle Obama, 2010).
Childhood obesity is a critical public health issue for the new generation of
children in the US and not only has reached an epidemic level, but also the children are
fatter and heavier today compared to decades before (Kohn & Booth, 2003). The
authors urge that although an epidemic of non-communicable disease such as obesity
seems “benign”; however, they are as detrimental as their “contagious infectious
3 Based on World Health Organization estimates, 42 million pre-school children
(under five years) have been overweight in the world, of which approximately 74 %
were in developing countries (WHO, 2015). There is evidence of an increase in the
number of obese children in low and middle countries, that is, the rate of childhood
overweight and obesity indicates a 30 % increase compared to that of developed
countries.
This overweight paves the ground for their obesity and eventually leads to an
increased risk for adulthood obesity, early death or disability due to different related
chronic non-communicable diseases compared to those who are non-overweight (WHO,
2014).
In a systematic review “Global, regional and national prevalence of overweight
and obesity in children and adults 1980-2013” by Ng et al. (2014) indicated that in the
year 2013 there was a considerable increase in the number of overweight and obese
among children and adolescents both in the developed and developing countries. The
authors reported that there were 23.8% (22.9-24.7) of boys and 22.6% (21.7-23.6) of
girls who were overweight or obese in the developed countries compared to 12.9%
(12.3-13.5) of boys and 13.4% (13.0-13.9) of girls who were overweight and obese in
the developing countries.
Moreover, based on theNational Health and Nutrition Examination Survey
(NHANES, 2011-2012), 8.1 % of infants and toddlers, 16.9% of 2-19-year-olds and,
4 The authors argue that the global prevalence of overweight and obesity between
1980 and 2013 has increased 27.5 % for adults and 47.1% for children, that is, from 921
million to 2.1 billion.
Based on the literature it seems that different factors at Micro, Meso, and Macro
level interplay with one another or independently increases the risk of childhood
obesity with various pathophysiological mechanisms. The individual and proximal
elements are either: A) behavioral, viz. Taking fat-energy-rich food and energy
imbalance between caloric intake and expenditure not for a day but over time (DHHS,
AIM for a Healthy weight, 2014), Medication use (CDC, 2015), Decrease in physical
activity due to sedentary lifestyles, urbanization and shift in transportation modes
(WHO Fact sheet, 2015), Technological advancement, watching TV and computer use
(K. M. Goel & D. K. Gupta, 2012; Singh, Kogan, Van Dyck, & Siahpush, 2008), B) Genetic (
Comuzzie & Allison, 1998; Rankinen et al., 2006; K. M. Goel & D. K. Gupta, 2012), C)
Biologic and evolutionary hereditary traits either by mismatch pathway (Hanson &
Gluckman, 2014) or developmental pathway from paternal (McPherson, Fullston,
Aitken, & Lane, 2014) and maternal health conditions (Whitaker, 2004; Reynolds,
Osmond, Phillips, & Godfrey, 2010; Fraser et al., 2010; Woo Baidal et al., 2016;
Eisenman, Sarzynski, Tucker, & Heelan, 2010), D) Metabolic or endocrine disorders (J.
Webster-Gandy, A. Madden, & M. Holdsworth, 2012; Chatterjea, M. N., & Shinde, R,
2012).
At the Meso level Fetal programming, as suggested by Thrifty Phenotype
Hypothesis, which is also known as Barker Hypothesis and Developmental origins
hypothesis, may lead to childhood obesity among children undernourished in the womb
5 There is myriad scientific evidence of distal factors correlation to childhood
obesity1, that is, these upstream factors include: Advertising less healthy food (CDC,
Children's Food Environment State Indicator Report, 2011; McGinnis, J. M., Gootman, J.
A., & Kraak, V. I. (2006), differences in state child care licensing regulations related to
nutrition, physical activity, and media use (Pathways and Partnerships for Childcare
Excellence, 2012; Kaphingst & Story, 2009), No Safe and appealing place, in many
communities, to play or to be active (CDC, State Indicator Report on Physical Activity,
2014), disparities in access to healthy foods (Larson, Story, & Nelson, 2009), Greater
availability of dietary-energy-dense foods and sugar-sweetened beverages (L. Johnson,
Mander, Jones, Emmett, & Jebb, 2008; Laura Johnson, Mander, Jones, Emmett, & Jebb,
2008; Reedy & Krebs-Smith, 2010; Vartanian, Schwartz, & Brownell, 2007; Wang,
Bleich, & Gortmaker, 2008), Increasing portion sizes ( Orlet Fisher, Rolls, & Birch, 2003;
Orlet Fisher et al., 2003), “Lack of breastfeeding support” (Arenz, Rückerl, Koletzko, &
Kries, 2004; Owen, Martin, Whincup, Smith, & Cook, 2005), culture (K. M. Goel & D. K.
Gupta, 2012), and Race/ethnicity, SES (Singh et al., 2008).
The study by Singh et al. (2008) indicated that both individual and social factors
are associated with Childhood and adolescence obesity. The authors in the 2003
National Survey of Children’s Health found that “Racial/Ethnic, Socioeconomic, and
Behavioral” determinants are not only independently but also jointly associated with
childhood and adolescence obesity.
Over and above, B. R. Walker, N. R. Colledge, S. H. Ralston, & I. D. Penman (2014)
urge that some causes of obesity on occasions are reversible, that is, diagnosable and
treatable.
6 The authors argue that, these causes are differentially distinguished from the others
by their short history and a recently pronounced weight gain. These causes are either
due to endocrine factors (Hypothyroidism, Cushing’s syndrome, Insulinoma,
Hypothalamic tumors or injury) or drug treatments (Atypical antipsychotics [e.g.
olanzapine], Sulphonylureas, thiazolidinediones, insulin, Pizotifen, Corticosteroids,
Sodium valproate and β-blockers).
One of the predisposing factors to childhood obesity is Adverse childhood
experiences and/or childhood maltreatment (Danese & Tan, 2014; Helton & Liechty,
2014; Li, Chassan, Bruer, Gower, & Shelton, 2015; Power, Pinto Pereira, & Li, 2015;
Whitaker, Phillips, Orzol, & Burdette, 2007; Felitti et al., 1998; Lodhia et al., 2015;
Fuemmeler, Dedert, McClernon, & Beckham, 2009; Burke, Hellman, Scott, Weems, &
Carrion, 2011) , which is defined by the Centers for Disease Control and Prevention
(CDC) as “any act or series of acts of commission or omission by a parent or other
caregiver (e.g., clergy, coach, teacher) that results in harm, potential for harm, or threat
of harm to a child” (CDC, 2015).
Power, Pinto Pereira, & Li, 2015 based on prospective 50-year British cohort
urged that life course of exposure to childhood maltreatment had a significant effect on
obesity and body mass index. They found that the effect of physical abuse in both
genders, sexual abuse in females was significant and positively associated with lifetime
BMI gains, that is, they were more likely to be at faster risk for obesity. Psychological
7 Moreover, the original ACE study examined seven categories of adversaries a
child experience in his/her childhood, which included 3 subtypes types of abuse
-(physical, sexual and psychological) and 4 subtypes of household dysfunction
(household members who were substance abusers, mother or stepmother treated
violently, mentally ill or suicidal, or ever imprisoned) (Felitti et al., 1998). Publications
from ACE study have denoted a statistically significantly positive association between
adverse childhood experiences and obesity “Body weight and obesity in adults and
self-reported abuse in childhood” ( Williamson, Thompson, Anda, Dietz, & Felitti, 2002). The
authors urge that if this association turns to be causal-prevention of childhood abuse
may lead to a modest reduction of adulthood obesity and at the same time might help to
discover the mechanisms that lead to adult obesity, and contribute to developing
therapeutic remedies.
Studies have shown that adverse childhood experience affects the results of
treatments for obesity. In a prospective case series study of 223 adult and mostly
female patients, who undergone bariatric surgery determined, a positive relationship
between ACE and postoperative BMI (Lodhia et al., 2015) .Those who were having a
high ACE score (≥6) vs. patient with lower score had significantly higher levels of
postoperative BMI both 6-months and 12 months after surgery (36.9 vs. 33.4 kg/m(2),
p = 0.03) and (34.5 vs. 30.5 kg/m2, p=0.07), respectively.Therefore, the authors urge
that is sagacious to tackle this issue preoperatively through counseling.
What is more, it is noteworthy to mention that it is also likely that children who
are maltreated, to be at higher risk of visceral obesity that those of non-childhood
8 index (Li, Chassan, Bruer, Gower, & Shelton, 2015). The authors assert, perturbation of
the hypothalamic–pituitary–adrenal axis activity and activation of the immune system,
as-probable pathophysiologic mechanisms. This conditional was coined initially as
Thin-on-the-outside fat-on-the-inside and individuals having this issue are found to be a
higher risk for metabolic disorders (Thomas et al., 2012).
1.2 Purpose of Research/Rational
The research gap indicates that more investigations are needed to elucidate the
associations between categories of ACEs and childhood obesity (V. J. Felitti et al., 1998;
Williamson et al., 2002). Therefore, this study aims to expand on the definition of ACEs
to include: socio-economic hardship, racial discrimination, witness/victim of
neighborhood violence, and bereavement and to examine their individual and joint
association with BMI levels among 45,309 U.S. children and adolescents aged 10-17
years in the 2011-2012 National Survey of Children’s Health dataset (2011-2012 NSCH).
9 Figure 1.1, above, shows the adverse childhood experiences that are examined in
the present study which includes individual and family-level risk factors: (1)
Socioeconomic hardship, (2) Parental divorce or separation, (3) Bereavement, (4)
Incarcerated family member, (5) Witness to domestic violence, (6) Victim/witness of
neighborhood violence, (7) Household mental illness, (8) Household substance abuse,
(9) Racial discrimination (NSCH, 2011-2012). We use the NSCH 2011-2012, which is a
dataset with a nationally representative sample of U.S. children 0-17 years of age.
Studies on the topic of childhood abuse and childhood obesity collectively
indicate an association, but there is the lack of replications in nationally representative
sample of children from 10-17 years of age.
The following research questions guide the study:
1) What is the relationship between the prevalence of ACEs and Childhood obesity in a nationally representative sample (NSCH 2011-2012) of children 10-17 years age in the United States?
Hypothesis 1: It is hypothesized that there is a statistically significant difference in prevalence of BMI of the given age and sex among children age (10-17years) who have adverse childhood experiences vs. No ACE in the US (National Survey of Children’s Health 2011/12 NSCH).
2) What is the contribution of individual and joined categories of childhood adversity on levels of BMI among children 10-17 years of age with adverse childhood experience compared to those without ACE in the United States?
10 to those without a history of adverse childhood experience.
3) Which ACE exposures have stronger associations with childhood obesity in a 45, 309 nationally representative sample of children 10-17 years of age with ACE compared to those with no ACE in the United States?
Hypothesis 3: ACEs associated with childhood obesity are of similar magnitude.
11
CHAPTER 2:
12 2.1 CHILDHOOD OBESITY
2.1.1 Epidemiology/Burden
Obesity is one of the 21st centuries public health issues. It lies at the other end of the
spectrum of malnutrition. It has transcended geographical boundaries and now has
inscribed itself as a global epidemic [globesity](WHO, 2015). It affects individuals of all
ages, both sex, wealthy and poor, and developed and developing countries around the
world (WHO factsheets, 2015).
Not only adolescence obesity has reached an epidemic level in the world, but also
they are fatter and heavier today compared to decades before (Kohn & Booth, 2003).
The authors urge that although epidemics of noncommunicable disease such as obesity
seems [benign]; however, they are as detrimental to health as their [contagious
infectious cousins]. It has reached pandemic level yet entirely not appropriately
addressed and as Kaye K. Gaines addressed it as the “Elephant in the room-Pandemic
Obesity” (Gaines, 2015).
Abnormal or excess accumulation of fat that leads to overweight or obesity and
possess a health risk to the individual (WHO, 2016). In 2008, based on WHO estimates,
it was reported that there were 1.4 billion overweight and more than 500 million obese
adults. In 2014, the number of overweight reached to 1.9 billion adults (38% men and
40% women) of which more than half a billion were obese (11 % men and 15%
women), which indicates that women have higher rates of overweight and obesity
13
Figure 2.2 - Age–standardized prevalence of overweight and obesity, and obesity alone (based on IOTF cutoffs), ages 2–19 years, by sex, 1980–2013 (Ng et al., 2014)
Besides, the prevalence of obesity has more than doubled between 1998-2014. On average
it takes the life of 2.8 million people worldwide (WHO: 10 facts on obesity, 2014). For
instance, in more than half of the high and middle-income country it takes more lives than
does underweight. “44 % of diabetes, 23 % IHD and 7 to 41% of certain cancers are
attributable to overweight and obesity” (WHO: 10 facts on obesity, 2014).
42 million pre-school children (under five years) have been overweight in the world of
which 31 million of them were in developing countries. There is evidence of an increase in the
number of obese children in low and middle countries, that is, the rate of childhood
overweight and obesity indicates a 30 % increase compared to that of developed countries.
This overweight paves the ground for their obesity and eventually led to elevated prevalence
of adulthood obesity, early death or disability due to different related chronic
non-communicable diseases compared to those who are non-overweight (WHO: 10 facts on
14
Figure 2.3 - Prevalence of overweight and obesity (BMI>=25) and obesity (BMI>=30), by age and sex, 2013 (Ng et al., 2014)
In a systematic review “Global, regional and national prevalence of overweight and obesity
in children and adults 1980-2013” by Ng et al. (2014) indicated that in the year 2013 there
was a marked surge in the number of overweight and obese among -children and adolescents
both in the developed and developed countries (Figure 2.1)
There were 23.8% (22.9-24.7) of boys and 22.6% (21.7-23.6) of girls who were
overweight or obese in the developed countries compared to 12.9% (12.3-13.5) of boys
and 13.4% (13.0-13.9) in girls who were overweight and obese in the developing
countries (Figure 2.2).
The authors argue that the global prevalence of overweight and obesity between
1980 and 2013 has increased 27.5 % for adults and 47.1% for children, that is, from 921
million to 2.1 billion.
These estimates among the children and adolescents category, indicates higher
15 were opposite for adult age group estimates of WHO where women had higher
overweight and obesity prevalence compared to men (WHO: Obesity and Overweight,
2015).
In the year 2012, a group of retired American Generals, Admirals, and Civilian
Military Leaders issued a report “Too Fat to Fight” that urged the prominent reason that
75% of young Americans ranging from age 17 to 24 years cannot join military forces is
[being too overweight and obese] (Mission: Readiness. Military Leaders for Kids, 2012).
This report rang a different type of bell for the American people that not only their
overall health is in danger but also, it is a significant threat to [national security] of the
US.
Another alarming point of consideration is the medial costs attributable to obesity.
Finkelstein, Trogdon, Cohen, & Dietz (2009) found that rise in obesity prevalence and
medical expenses cannot be irrelevant. The results indicate that in 2006 medical costs
of obesity have soared up to $147 billion dollars a year based on the - National Health
Expenditure Accounts (NHEA) data or $86 billion dollars based on Medical Expenditure
Panel Survey (MEPS) data, which constitutes almost 10% of all medical expenditures in
the US. Astonishingly, in 1998, these expenses were $42 and- $74 billion, respectively. It
was highlighted by the researchers that “Across all payers, obese people had medical
spending that was $1,429 greater than spending for normal-weight people in 2006.”
This spending shows a 41.5% difference compared to normal weight individuals.
Moreover, 8.5%, 11.8%, and 12.9 % are the costs incurred by Medicare, Medicaid, and
16 However, if obesity trends in the U.S. were lowered by reducing the average adult
BMI by only 5 %, millions of Americans could be spared from serious health problems-
and preventable diseases, and the country could save $29.8 billion in five years,
$158 billion in 10 years and $611.7 billion in 20 years (Trust for America’s Health &
Robert Wood Johnson Foundation, 2014).
Childhood obesity has physical and psychological health consequences during
childhood, and can contribute to behavioral and emotional difficulties, and reduces
educational attainment (Pizzi & Vroman, 2013). It is one of the alarming public health
challenges of the 21st century. However, childhood obesity and its related diseases are
preventable.WHO has developed the "Global Action Plan for the prevention and control
of non-communicable diseases 2013-2020", one of its aims is to decrease the global
obesity levels to those of 2010 (WHO, Global Action Plan for the Prevention and Control
of NCDs 2013-2020, 2013).
In a systematic review by Woo Baidal et al. (2016) comprising 282 original
quantitative studies on “risk factors for childhood obesity in the first 1,000 days” found
several categories of modifiable risk factors associated with childhood obesity. The
authors urge that these 1,000 days, from conception to 2 years, form a critical window
to prevent modifiable risk factors that are related to childhood obesity. The enumerated
list of factors that imperils children to obesity were, namely, higher maternal
pre-pregnancy BMI, prenatal tobacco exposure, maternal excess gestational weight gain,
high infant birth weight, and accelerated infant weight gain, gestational diabetes, child
care attendance, low strength of maternal– infant relationship, low SES, curtailed infant
sleep, inappropriate bottle use, introduction of solid food intake before age 4 months,
17 The UN sustainable development goals (SDGs) set 17 priority goals to be achieved
by 2030 of which goal 3 “Ensure healthy lives and promote well-being for all ages”, and
one of the deliverables by 2030 to achieve the target goal is to prevent and treat
one-third of early deaths from non-communicable diseases and to promote mental health
and well-being (Sustainable development goals - United Nations, 2015).
Similarly, the Office of Disease Prevention and Health Promotion (ODPHP) within
the U.S. Department of Health and Human Services (HHS) in December 2010 set forth
the “Healthy people 2020” initiative targeting around 43 topics (Health People 2020,
2010). One of the objectives in Nutrition and weight status domain is the 10 %
reduction in the proportion of children and adolescents’ aged 2-19 years who are obese
by the year 2020 (NSW10-Healthy people 2020, 2010).
The report of World Health Organization “ The Commission on Ending Childhood
Obesity” (ECHO) formed in 2014 indicates the magnitude of the issue of childhood
obesity and the dire need for its control and prevention (WHO, ECHO, 2016). The main
points of this report, which is the product of 2 years exhaustive expert working -
groups, elucidates the multidimensional facet of the issue: The roles of obesogenic
environments promoting weight gain, energy imbalance (as a result of unhealthy
food-consumption and marketing, availability of healthy food, sedentary lifestyle with less
physical engagement), the biological and behavioral responses of child being formed
18 The committee [ECHO] urges that there is no one size fits all solution for childhood
obesity, and there is a need for considering a) contextual conditions b) consideration of
three critical life course periods, namely, preconception and pregnancy, infancy and
early childhood and older childhood and adolescence c) treatment of children who are
already obese.
The ECHO commission final report has a comprehensive, integrated and
multisectoral (including: WHO, International organizations, Member States, NGOs,
-Philanthropic foundations, and Academic Institutions), non-vertical (in alignment with
governmental and non-governmental initiatives) set of recommendations to address
childhood obesity epidemic, namely, promotion of high nutrient value food intake by
children and adolescents; put into practice programs that physically engage them;
perinatal care and health education on prevention of noncommunicable diseases;
proper diet, sleep and physical activity management for children at their early
childhood; increase health and nutrition literacy and physically activity among
school-age children; and proper weight manschool-agement of children and adolescents who are
obese.
MALNUTRITION-THE DOUBLE BURDEN:
The World Health Organization has let off the siren of [malnourishment] in
developing countries struggling to deal with the issue of [under nutrition] for a long
time-they are in the hot zone of overweight and obesity (WHO, Obesity and overweight,
2015). WHO contends that the two-lane road of malnutrition is moving in the same
19 many noncommunicable diseases. Lack of access to food during perinatal and
-childhood period from one hand and access to reduced nutrient value and cheap food
(rich with high fat, high sugar, and high salt) on the other are doubling the burden of
malnutrition diseases in low and middle-income countries. It is not odd to find
simultaneously in families, communities and nations at large where one has
undernutrition while the other suffers from overweight and obesity.
2.1.2 Risk Factor and Etiology
Technological advancements have been one of the culprits of childhood obesity (K.
M. Goel & D. K. Gupta, 2012), that is, Watching TV and computer has induced a reduction
in physical activities and hence leads to accumulation of energy in the body that is not
consumed by physical activities. For instance, around 28% of all children in the United
States are watching TV more than 4 hours per day (NHANES 3 survey). Moreover, the
authors underpin that genetics and culture are also as primary determining factors for
childhood obesity, with estimated contributions of 25 % and 30%, respectively.
Over and above, physical activity is one of the most determining factors in the
prevention of overweight and obesity; however, no more than 49 % and 20 % of
Americans are active at moderate and vigorous levels, respectively (S. J. McPhee, M. A.
Papadakis, & M. W. Rabow, 2). Besides, it is noted that only three out of every hundred
-Americans follow the four of the five recommendations of the food guide pyramids
when it comes to eating high nutrient value food such as, grains, fruits, vegetables, dairy
products and meat, and merely a quarter of Americans consume the suggested five or
20 Besides, the Human Obesity Gene Map in 2005 urged that there are 20 to 30 genes in
human DNA that are responsible for obesity in humans (Rankinen et al.,2006).
The authors contended that:
[176 human obesity cases due to single-gene mutations in 11 different genes have been reported…The number of human obesity QTLs derived from genome scans continues to grow, and we now have 253 QTLs for obesity-related phenotypes from 61 genome-wide scans…The obesity gene map shows putative loci on all chromosomes except Y.] (p. 529)
B. R. Walker, N. R. Colledge, S. H. Ralston, & I. D. Penman (2014) indicates twin and
adoption studies have confirmed the genetic contribution in obesity that can be either
polygenic or single gene disorders. “The pattern of inheritance suggests a polygenic
disorder, with small contributions from a number of different genes, together
accounting for 25–70% of variation in weight.”
Although single gene disorders are known to be rare, yet still they cause severe
obesity among children, namely, mutations of the melanocortin-4 receptor (MC4R),
which account for approximately 5% of serious early-onset obesity, the authors argued;
defects in the enzymes processing propiomelanocortin (POMC, the precursor for
adrenocorticotrophic hormone [ACTH]) in the hypothalamus; and mutations in the
leptin gene. Childhood obesity can be a feature of genetic syndromes, such as
Prader-Willi and Lawrence-Moon-Biedl syndromes.
Besides, the authors urge that on occasions some causes of obesity are reversible
(diagnosable and treatable). These causes are differentially distinguished from the
21
TABLE 2.1. Potentially reversible causes of weight gain
Endocrine factors Drug treatments
• Hypothyroidism • Cushing’s syndrome • Insulinoma
• Hypothalamic tumors or injury
• Atypical antipsychotics (e.g. olanzapine) • Sulphonylureas, thiazolidinediones, insulin • Pizotifen
• Corticosteroids • Sodium valproate • β-blockers
Other mechanisms that lead to childhood obesity has been postulated (D. L. Longo,
A. S. Fauci, D. L. Kasper, S. L. Hauser, J. L. Jameson, & J. Loscalzo, 2013):
Increase nutrient absorption in the intestine depending on food composition,
[sleep deprivation], and [unfavorable gut flora].
Polygenic, monogenic (mutations) and syndromic obesity pathways
Secondary causes of obesity include hypothalamic injury, hypothyroidism,
Cushing's syndrome, and hypogonadism. Drug-induced weight gain is also
common in those who use antidiabetes agents (insulin, sulfonylureas,
thiazolidinediones), glucocorticoids, psychotropic agents, mood stabilizers
(lithium), antidepressants (tricyclics, monoamine oxidase inhibitors, paroxetine,
mirtazapine), or antiepileptic drugs (valproate, gabapentin, carbamazepine).
22 Biological factor has also been found to be a risk factor for obesity by different
pathophysiologic mechanisms:
1) MISMATCH PATHWAY:
The evidence in the field of developmental origins of health and disease (DOHaD)
indicates “the result of the physiological processes of developmental plasticity, which
may have potential adverse consequences in terms of NCD risk later” and “operate
across the normal range of development and are largely physiological rather than
pathophysiological”(Hanson & Gluckman, 2014). The authors urge that the field of
DOHaD explains how [conditionings mechanisms] represents physiological processes in
early life, but how later health status is endangered. The authors argue that one of the
reasons that NCDs, such as obesity, have increased is due to a [mismatch], where
neither evolutionary traits nor physiologies of individuals are prepared to attune to.
The [mismatch] resulting from westernization, socio-economic development, change in
nutritional habits, sedentary life style, etc. results in nonadaptive consequences.
2) DEVELOPMENTAL PATHWAY:
Paternal overweight/obesity has shown to have genetic and epigenetic effects on
sperm function, embryo development and damage of offspring health subsequently
(McPherson, Fullston, Aitken, & Lane, 2014). Moreover, many studies have also
indicated a relationship between adverse maternal health conditions and childhood
obesity:(Whitaker, 2004; Reynolds, Osmond, Phillips, & Godfrey, 2010; Fraser et al.,
2010; Woo Baidal et al., 2016; Eisenman, Sarzynski, Tucker, & Heelan, 2010).
23 TABLE 2.2. Literature Review Table of Causes of Childhood Obesity
TYPE SUBTYPES EXAMPLES DESCRIPTION RESOURCE
A) DOWNSTREAM/ MICRO
Behavior
Energy imbalance between caloric intake and expenditure.
Healthy behavior is determined by a healthy diet and regular physical activity. Based on Dietary guidelines for Americans a healthy eating
includes: various vegetables of all subgroups, whole fruits, grains, fat free or low fat dairy, various protein foods including meats, poultry, eggs legumes, nuts, seeds and soy
products, and Oils.
On the other hand the physical Activity Guidelines for Americans
suggest a 1 hour or morel daily physical activity that includes: Aerobic activity, Muscle strengthening and Bone strengthening.
Aim for a healthy weight: Maintaining a Healthy Weight On the Go A Pocket Guide. (2014, August). Retrieved June 9, 2016, from
http://www.nhlbi.nih.gov/files/docs/public/heart/AIM_Po cket_Guide_tagged.pdf
World Health Organization (WHO). Obesity and overweight.
(2015, January). Retrieved April 03, 2016, from
http://www.who.int/mediacentre/factsheets/fs311/en/
Centers for Disease Control and Prevention (CDC).
Childhood Obesity Causes & Consequences. (2015, June 19). Retrieved June 09, 2016, from
http://www.cdc.gov/obesity/childhood/causes.html
U.S. Department of Health and Human Services and U.S. Department of Agriculture. 2015 – 2020 Dietary Guidelines for Americans. 8th Edition. December 2015. Available at http://health.gov/dietaryguidelines/2015/guidelines/. http://health.gov/paguidelines/guidelines/
Fat-energy-rich food intakes,
Decrease in physical activity due sedentary life styles, urbanization and shift in transportation modes.
Besides, medication use and others.
Metabolic
Factors Endocrine disorders
Cushing syndrome, hypothyroidism, Prader-Willi Syndrome, Congenital Leptin Deficiency, Frölich’s
Syndrome, hyperinsulinism
Chatterjea, M. N., & Shinde, R. (2012). Diet and
Nutrition/Obesity. In Textbook of medical biochemistry (8th ed., pp. 763-769). New Delhi: Jaypee Brothers Medical Publications (P).
Nutritional problems of children and adolescents. (2012). In J. Webster-Gandy, A. Madden, & M. Holdsworth (Eds.), Oxford handbook of nutrition and dietetics (p. 262). Oxford: Oxford University Press, USA.
Genetics
Developmental pathway
Paternal and maternal conditions
Genetic and epigenetic effects on sperm function, embryo development and damage to offspring health
subsequently
McPherson, N. O., Fullston, T., Aitken, R. J., & Lane, M. (2014). Paternal obesity, interventions, and mechanistic pathways to impaired health in offspring. Annals of Nutrition & Metabolism, 64(3-4), 231–238. http://doi.org/10.1159/000365026
24 B) MESO Fetal Programing
Barker Hypothesis, Thrifty Phenotype Hypothesis, Developmental origins hypothesis
“The hypothesis (proposed in 1990 by the British epidemiologist David Barker) proposing that an
undernourished baby becomes thrifty. It maintains high levels of sugar in the bloodstream to benefit the brain but less sugar in muscles. Muscle growth may be ‘‘traded off’’ to protect the brain. Once adopted, this thrifty behavior becomes permanent and, combined with adiposity in later life, leads to type 2 diabetes.” But this under nutrition graves for the other repercussions in middle ages and leads to programing ill health such as, cardiovascular diseases and type 2 diabetes.
25
TYPE SUBTYPES EXAMPLES DESCRIPTION RESOURCE
C) UPSTREAM/ MACRO Environment Education Food Promotion Variation in licensure regulations among child health care centers
More than half of US middle and high schools offer sugar drinks and less healthy foods as competitive foods.
High caloric diets enriched with high sugar, low healthy nutrients, and saturated fats are
predisposing the children and the adult for different diseases later on in life such as CVD and type 2 diabetes.
“More than 12 million American children regularly rely on child care to support their healthy development and school success.”
Most of the US states don’t enforce and regulate their childcare centers for Nutrition, physical activity and media use. Only 12 regulated food of low nutritional value, 36 promoted physical outdoor activities in CCCs and only 8 states regulated amount of time to be spent on screen per day in the week at Small family child care homes.
Only 27 states have street safety policies for everyone including pedestrians and bicyclists.
United States society has been the named the capital offast food or "fast food nation”2 that pioneers in “obesogenic” unhealthy food. The environments have less walkability, inaccessible, and thus making healthy choices difficult for children across Macro socio-ecological levels.
Johnson L, Mander AP, Jones LR, Emmett 28. PM, Jebb SA. A prospective analysis of dietary energy density at age 5 and 7 years and fatness at 9 years among UK children. Int J Obes (Lond) 2008;32(4):586—593.
Johnson L, Mander AP, Jones LR, Emmett 29. PM, Jebb SA. Energy-dense, low-fiber, high-fat dietary pattern is associated with increased fatness in childhood. Am J Clin Nutr 2008;87:846—854.
Reedy J, Krebs-Smith SM. Dietary sources of energy, solid fats, and added sugars among children and adolescents in the United States. J Am Diet Assoc 2010;110(10):1477—84.
Vartanian LR, Schwartz MB, Brownell KD. Effects of soft drink consumption on nutrition and health: a systematic review and meta-analysis. Am J Public Health
2007;97(4):667—675.
Wang YC, Bleich SN, Gortmaker SL. 5. Increasing caloric contribution from sugar-sweetened beverages and 100% fruit juices among US children and adolescents, 1988–2004. Pediatrics 2008;121(6):e1604—1614.
No Safe and
appealing place, in many communities, to play or to be active
Limited access to healthy affordable foods
Fisher JO, Rolls BJ, Birch LL. Children's bite size and intake of an entrée are greater with large portions than with age-appropriate or self-selected portions. Amer J Clin Nutr 2003;77(5):1164—1170.
McConahy KL, Smiciklas-Wright H, Mitchell DC, Picciano MF. Portion size of common foods predicts energy intake among preschool-aged children. J Amer Diet Assoc 2004;104(6):975—979.
Greater availability of high-energy-dense foods and sugar sweetened beverages.
Increasing portion sizes
Arenz S, Ruckerl R, Koletzko B, von Kries R. Breast-feeding and childhood obesity – a systematic review. Int J Obes Relat Metab Disord 2004; 28:1247—1256.
Owen CG, Martin RM, Whincup PH, et al. Effect of infant feeding on the risk of obesity across the life course: a quantitative review of published evidence. Pediatrics 2005; 115:1367—1377.
Lack of
breastfeeding support
26 2.1.3 Prognosis and Consequences
Childhood obesity has profound detrimental effects on children’s health not only
in short term but also in a long run (J. Webster-Gandy, A. Madden, & M. Holdsworth,
2012):
Immediate Effects on health:
o It leads to non-communicable mostly chronic consequences such as cardiomyopathy, pancreatitis, orthopedic disorders, upper airway
obstruction, or chest wall restriction.
Effects on well-being:
o Children who suffer from overweight and obesity face adverse repercussions, namely, physical, social (low self-esteem and social interaction), educational
(poorer academic achievements), and earlier puberty.
Long-term effect on health:
o If overweight and obesity are combined with a diet with low nutritional values that is high in saturated fat, low Calcium and coupled with sedentary
lifestyle-there is a higher risk of getting Diabetes Mellitus type 2, CVD,
osteoporosis, gallstones, cancers related to diet and suboptimal peak bone
mass compared to those with healthy weight. The risk is higher among
children who retain their obesity into their adulthood. However, all obese
27 Childhood overweight and obesity have been shown to lead to different adverse and
detrimental health aftermaths, in multiple systems of the body by different
pathophysiologic pathways(Daniels, 2006). The list of body organs and systems that
were considered to be mostly affected by childhood obesity included: cardiovascular,
endocrine, respiratory, gastrointestinal, skeletal, nervous and urogenital systems. The
author urges that obesity-related repercussions that were pertinent to adults are [now
threatening children’s health] not only in short term but also in a long run. In summary,
the children compared to their parents will have a shorter life span and possess less
healthy lifestyles.
Central obesity is frequent among men and is correlated with diabetes Mellitus
type 2, CVD and metabolic syndrome (B. R. Walker, N. R. Colledge, S. H. Ralston, & I. D.
Penman, 2014). The most noteworthy point between these two types (Central and
General Obesity) is there vasculature anatomy-intra abdominal fat is drained by portal
vein to liver and thus increasing the products and by products of adipocytes in the liver
(free fatty acids; ‘adipokines’ such as, tumor necrosis factor-α and adiponectins; steroid
hormone) and as a result give rise to metabolic syndromes.
Moreover, S. J. McPhee, M. A. Papadakis, & M. W. Rabow (2013) claims that upper
body obesity has severe consequences compared to lower body, and obese men and
women with a higher abdominal circumference (> 102 cm in men and 88 cm in women)
or increased waist–hip ratios (> 1.0 in men and > 0.85 in women), compared to
[equally] obese men and women with reduced rates, are at greater risk for
noncommunicable diseases (diabetes mellitus, stroke, coronary artery disease) and
28 On top of that, consequencesofchildhood obesity are diverse. It is a direct cause of
morbidities in childhood including gastrointestinal, musculoskeletal and orthopedic
complications, sleep apnea, and the accelerated onset of cardiovascular disease and
-type-2 diabetes, as well as the comorbidities of the latter two non communicable
diseases (Lobstein & Jackson-Leach, 2006).
Also, Obesity in childhood can contribute to behavioral and emotional
difficulties, such as depression, and can also lead to stigmatization and poor
socialization and reduce educational attainment (Pizzi & Vroman, 2013) (Miller, Lee, &
Lumeng, 2015).
Critically, childhood obesity is a strong predictor of adult obesity, which has
well-known health and economic consequences, both for the individual and society as a
whole (Litwin, 2014; Nader et al., 2006).
29 TABLE 2.3. Literature Review Table of Consequences of Childhood Obesity
TYPE SUBTYPES EXAMPLES DESCRIPTION RESOURCE
A) NOW
Cardiovascular System
High blood pressure and high cholesterol
Childhood Obesity affects multiples systems with different patho-physiologic pathways and at different time periods.
Children who are suffering from obesity are more likely to obese adults. Severity of the disease and its
consequences are worse.
Freedman DS, Mei Z, Srinivasan SR, Berenson GS, Dietz WH. Cardiovascular risk factors and excess adiposity among overweight children and adolescents: the Bogalusa Heart Study. J Pediatr. 2007;150(1):12—17.e2.
Gastro-
intestinal system
Impaired glucose intolerance, Insulin resistance, and type 2 diabetes Fatty liver disease
Gallstones
Gastro-esophageal reflux Colon cancer
Whitlock EP, Williams SB, Gold R, Smith PR, Shipman SA. Screening and interventions for childhood overweight: a summary of evidence for the US Preventive Services Task Force. Pediatrics.
2005;116(1):e125—144
Han JC, Lawlor DA, Kimm SY. Childhood obesity. Lancet. May 15 2010;375(9727):1737—1748.
Respiratory
System Apnea and Asthma
Han JC, Lawlor DA, Kimm SY. Childhood obesity. Lancet. May 15 2010;375(9727):1737—1748.
Sutherland ER. Obesity and asthma. Immunol Allergy Clin North Am. 2008;28(3):589—602, ix.
Genito-urinary System
Breast cancer
Infertility (men and women) Polycystic ovary syndrome
Nutritional problems of children and adolescents. (2012). In J. Webster-Gandy, A. Madden, & M. Holdsworth (Eds.), Oxford handbook of nutrition and dietetics (p. 409). Oxford: Oxford University Press, USA.
Musculoskeletal System
Joint problems and musculoskeletal discomfort
Osteoarthritis Chronic back pain
Han JC, Lawlor DA, Kimm SY. Childhood obesity. Lancet. May 15 2010;375(9727):1737—1748.
Taylor ED, Theim KR, Mirch MC, et al. Orthopedic complications of overweight in children and adolescents. Pediatrics. Jun
2006;117(6):2167—2174.
Nervous System/ Psychosocial
Depression
Behavioral problems Issues in School
Low self esteem and low self-reported quality of life Social isolation
Impaired relationships Poor employment
Morrison, Katherine M., et al. "Association of depression & health related quality of life with body composition in children and youth with obesity." Journal of affective disorders 172 (2015): 18-23.
Mustillo, Sarah, et al. "Obesity and psychiatric disorder: developmental trajectories." Pediatrics 111.4 (2003): 851-859.
30
TYPE SUBTYPES EXAMPLES DESCRIPTION RESOURCE
NOW
Childhood obesity impairs children’s physical, mental and social well-being.
Schwimmer, Jeffrey B., Tasha M. Burwinkle, and James W. Varni. "Health-related quality of life of severely obese children and adolescents." Jama 289.14 (2003): 1813-1819.
Taylor, Valerie H., et al. "The impact of obesity on quality of life." Best Practice & Research Clinical Endocrinology & Metabolism 27.2 (2013): 139-146.
Integumentary
System Skin Problems
Nutritional problems of children and adolescents. (2012). In J. Webster-Gandy, A. Madden, & M. Holdsworth (Eds.), Oxford handbook of nutrition and dietetics (p. 409). Oxford: Oxford University Press, USA.
Other
Impaired social, physical and emotional functioning
Mobility and accidents
Morrison, Katherine M., et al. "Association of depression & health related quality of life with body composition in children and youth with obesity." Journal of affective disorders 172 (2015): 18-23.
Freedman DS, Khan LK, Serdula MK, Dietz WH, Srinivasan SR, Berenson GS. The relation of childhood BMI to adult adiposity: the Bogalusa Heart Study. Pediatrics 2005;115:22-7.
Freedman DS, Dietz WH, Srinivasan SR, Berenson GS. Risk factors and adult body mass index among overweight children: the Bogalusa Heart Study. Pediatrics. 2009;123:750-57.
Biro FM, Wien M. Childhood obesity and adult morbidities. Am J Clin Nutr. May 2010;91(5):1499S—1505S.
Freedman DS, Khan LK, Serdula MK, Dietz WH, Srinivasan SR, Berenson GS. Racial differences in the tracking of childhood BMI to adulthood. Obes Res 2005;13:928-35.
Endocrine Disorders/Obesity. (2012). In K. M. Goel & D. K. Gupta (Eds.), Hutchison's paediatrics (2nd ed., pp. 438-439). New Delhi, India: Jaypee Brothers Medical.
B) LATER Physical
Adult obesity and its consequences
“Early puberty and tall stature, Gynaecomastia or adipomastia, Oligomenorrhoea and
31 2.2 THE CONTRIBUTION OF ADVERSE CHILDHOOD EXPERIENCES TO OBESITY
2.2.1 Origins of ACE Study:
ACE study traces its history to an obesity clinic of Kaiser Permanente in San
Diego, California. Dr. Vincent Felitti, “who was working Permanente’s revolutionary
Department of Preventive Medicine in San Diego, CA, [couldn’t figure out why, each year
for the last five years, more than half of the people in his obesity clinic dropped out].”
(Redding, 2003; Stevens, 2012).
Jane Ellen Stevens founder of “acestoohigh” further elaborates that clinic was
specially designed for those who were 60 to 100 pounds overweight. The preventative
medicine department was aiming to diagnose individuals’ diseases at an early stage
before they were symptomatic. Roughly 50,000 patients were being screened annually.
It was in 1980 that Dr.Vincent Felitti got puzzled finding that around 50% of the
participants dropped out of the obesity clinic, and quite astonishingly he found that
those who were losing weight were the ones who left the program initiated for
overweight and obesity management. It was the quest for the answer to this question
that ACE study made its hallmarking beginnings in the years to come (1995-1997). To
find an explanation for this issue the equation to ACE was formed-Dr. Felitti along with
17,000 members of Kaiser Permanente’s San Diego care program and Researchers from
CDC (Redding, 2003; Stevens, 2012).
But before the ACE study begun, he wanted to learn more about the
demographics and characteristics of dropouts. Quite contrary to customary beliefs, he
32 sexual attention, or as a form of physical, sexual and emotional protective factor, and
that many of them had been sexually and/or non-sexually abused as children.” (Felitti,
1991, 1993).
Moreover, Dr. Vincent Felitti discovers that all of the dropout had normal birth
weight and didn’t gain weight gradually over years (V. J. Felitti, 1991) and obesity
provided the patients [marital stability] by reducing spousal jealousy (V. J. Felitti, 1993).
It was also noticed that most of the obese patients had prior exposure to
precarious health behaviors such as smoking, alcohol, and injected drug use that
challenged the prevailing notion of addiction as a substance related phenomenon, but
forecasted it as [experience-dependent during childhood] (Vincent J. Felitti, 2003).
These findings were confirmed in the ACE study cohort of over 17,000 health
maintenance members (Felitti et al, 1998; R. F. Anda et al., 1999; Hillis, Anda, Felitti, &
Marchbanks, 2001; S. R. Dube et al., 2001; Robert F. Anda et al., 2002; Shanta R. Dube,
Anda, Felitti, Edwards, & Croft, 2002; Williamson, Thompson, Anda, Dietz, & Felitti,
2002; Shanta R. Dube et al., 2003; Shanta R. Dube et al., 2006; Edwards, Anda, Gu, Dube,
& Felitti, 2007; Ford et al., 2011)
2.2.2 Epidemiology/Burden
The ACE study is an ongoing study that was undertaken from 1995 to 1997 to
measure the association between childhood maltreatment and its health outcomes later
on among 17,000 study participants. It is an ongoing collaborative research between
Appraisal-33 Clinic in San Diego. This study was aimed to study the association between exposures of
different categories of adverse childhood experiences, viz. physical, social or emotional
-abuse or physical neglect, family dysfunctions and social problems, and different
outcomes simultaneously that are not only the leading causes of death but also
predictors of health-related behaviors and poor quality of life in the U.S.
Based on the 2014 Child Maltreatment report series of the U.S. Department of
Health and Human Services from the National Child Abuse and Neglect Data System
(NCANDS)-there were around 702,000 children who were victims of abuse in 2014,
namely, physical (17%), sexual (8.3%), neglect (75%) and psychological maltreatment
(6%): White children constituted the majority of the victims (44%) followed by
Hispanic (22.7%) and African American (21.4%) (USDHHS, 2016).
However, death rates were 88.4% among white children, 43% among African
American, and 15.1 % in Hispanic children. Approximately 1,580 lives were taken as a
result of abuse (2.13/100,000 nationally), of which Almost three out each four children
were younger than three years of age. Besides, boys had a higher fatality rate compared
to girls (2.48 vs. 1.82 per100, 000 in the population), but a lower victimization rate (9.0
vs. 9.8 per 1,000). In addition, among children who died around three-quarters of them
had suffered from neglect and 41.3% from physical abuse alone or in combination with
other types of maltreatment (USDHHS, 2016).
A cross-sectional study of the National Survey of Children’s Exposure to Violence
(NatSCEV2) among children aged 1 month to 17 years found that in general that the life
victimization of children by a caregiver is 25.6% in the US (Finkelhor, Turner, Shattuck,
-34 children had suffered from physical abuse, 2 % from sexual abuse, 6.5% from neglect
-and 8% from emotional abuse3. This prevalence study indicated that children who were
at the oldest subgroup (14-17 years) had highest rate of maltreatment (20.6%); this
findings is in opposition to HHS’ finding from The National Child Abuse and Neglect
Data System (NCANDS)-which indicated that children <1 years are the most vulnerable
(24.4%) (USDHHS, 2016).
2.2.3 Risk Factor and Etiology
These adverse Family Experiences that were included in our study to capture
psychosocial risk factors that affect children at the individual and familial level with
their respective measures were (NSCH, 2011-12):
(1)Socioeconomic hardship: How often has it been hard to get by on your family's
income - hard to cover basics like food or housing?
(2) Divorce/separation of parent:Child lived with a parent who got
divorced/separated after he/she was born?
(3) Death of parent:Child lived with a parent who died?
(4) Parent served time in jail:Child lived with parent who served time in jail after
he/she was born?
(5) Witness to domestic violence:Child saw parents hit, kick, slap, and punch or beat
each other up?
35 (6) Victim of neighborhood violence:Child was a victim of violence or witness
violence in his/her neighborhood?
(7) Lived with someone who was mentally ill or suicidal:Child lived with anyone
who was mentally ill or suicidal, or severity depressed for more than a couple
weeks?
(8) Lived with someone with alcohol/drug problem:Child lived with anyone who
had a problem with alcohol or drugs?
(9) Treated or judged unfairly due to race/ethnicity: Child was ever treated or
judged unfairly because of his/her race or ethnic group?
These ACEs were initially developed in the original ACE study (Felitti et al.,
1998) which includes ACE2, ACE4, ACE5, ACE7, and ACE8. Remarks from the Technical
Expert Panel (TEP)4, and of general population, led to the development of four new
items in the list of ACEs after review of life course stressors in children’s life, namely,
socioeconomic hardship [ACE1], bereavement [ACE2], witness/victim or neighborhood
violence [ACE 6] and racial discrimination [ACE9]).
2.2.4 Prognosis and Consequences
ACEs scoring system was developed to measure their prevalence before age 18
since researchers discovered participants’ exposure to multiple categories in their
childhood (Table 2.4). It was contended that increase in ACE scores increased the health
4 Representative group of experts in the field of survey methodology, children's health, community organizations, and