Efficient Lane Detection Algorithm using Different
Filtering Techniques
Sukriti
Srivastava Ritika Singal Manisha Lumb
Research Scholar, ECE Deptt Asstt Prof., ECE Deptt Asstt Prof., ECE Deptt LCET Katani Kalan, Punjab, India LCET Katani Kalan, Punjab, India LCET Katani Kalan, Punjab, India
ABSTRACT
Today, one of the largest areas of research and development in the automobile industry is road safety. Many deaths and injuries occur every year on public roads from accidents. However, the most dramatic fact is that, nearly all of the accidents are caused by driver mistakes. The main goal of the lane detection system is to reduce the number of these accidents. Remarkable amount of the current researches in this field focus on building autonomous driving systems. This research work presents an approach for improving the performance of lane detection algorithm by using different filtering techniques.
This paper deals with an efficient ways of noise reduction in the images by using different filtering techniques. The main objective is to design, develop, implement and subsequently simulate an efficient lane detection algorithm which will provide high quality results in the case when noise is present in the signal. The scope of the dissertation is to implement lane detection algorithm without using any filter, to implement lane detection algorithm using median, wiener, and hybrid median filters.And to compare the performance on the basis of accuracy, specificity, BER, PSNR, without and with filters (Median, Wiener, Hybrid median filters). By giving some selected road images, experiments will be taken, that will be useful for performance comparison. A variety of tests will be performed using improved algorithm to test various aspects of the road images. Comparisons will be drawn among proposes strategy with well-known existing algorithms.
Keywords
Image filtering, Lane detection, Hough transformation, canny edge detection
1.
INTRODUCTION
During long trips on monotonous roads, often the driver’s concentration may decrease. Many accidents are caused by cars that deviate from their lane. To find a solution to this problem, Volkswagen introduced new models in all their technology, “lane assist” or support system to keep the vehicle in his path, which helps to avoid this inconvenience.
A lane-detection system is an important component of many intelligent transportation systems. In intelligent transportation systems, intelligent vehicles cooperate with smart infrastructure to achieve a safer environment and better traffic conditions. Driver support system is one of the most important features of the modern vehicles to ensure driver safety and decrease vehicle accident on roads. Apparently, the road lane detection or road boundaries detection is the complex and most challenging tasks. It includes the localization of the road and the determination of the relative position between vehicle and road. Therefore, lane detection is a crucial element for developing intelligent vehicles. Lane detection based on machine vision is accomplished by taking images from
cameras mounted on the intelligent vehicles. There are many related research works on this issue in recent years. These works generally used different strategies aimed at certain kinds of surroundings and road conditions. The lanes are extracted using Hough transform. The proposed lane detection system can be applied on both curved as well as straight road in different weather conditions. The system was investigated under various situations of changing illumination, and shadows effects in various road types. The system has demonstrated a robust performance for detecting the road lanes under different conditions.
2.
ALGORITHM
Following steps are involved: Step 1: obtain input images.
Step 2: convert input images to grayscale images. Step 3: convert grayscale images to binary images. Step 4: obtain smoothed binary images.
Step 5: obtain canny edge detected images. Step 6: obtain smoothed binary images. Step 7: obtain output images.
2.1 Detail of the algorithm:
15 images are taken for the experimental test bed. Each image is tested one by one. Suppose image 1 is taken as input image. It is first converted to grayscale image. After that, filtering techniques will be applied one by one i.e. image is passed with median filter and then whole processing will be done i.e. filtered image will be converted to binary image. Then road background will be subtracted from the image and will get smoothed binary image. Then edge detection will be performed by using canny edge detector. Next step is to apply Hough transform to detect the lane markings and will get smoothed binary image. Hence lane will be detected and will get output image. The whole processing will be repeated by using wiener filter and hybrid median filter. Filtering is done to reduce the noise present in the images.
2.2 Filtering
In this thesis, noise reduction of the images is done at first. Considering salt and pepper noise in the images, noise will be reduced by using different filtering techniques i.e. median filter, wiener filter, and hybrid median filter. Comparison will be drawn among old technique (image without filter), median filter, wiener filter and hybrid median filter.
2.2.1 Median filter
2.2.2 Wiener filter
Wiener theory was given by Norbert Wiener in 1940. Wiener filters are a class of optimum linear filters which involve linear estimation of a desired signal sequence from another related sequence. The Wiener filter minimizes the mean square error between the estimated random process and the desired process. The goal of the Wiener filter is to filter out noise that has corrupted a signal. It is based on a statistical approach.
2.2.3 Hybrid median filter
Hybrid median filtering is a non-linear filtering technique. It is a three step ranking process that uses two subgroups of a 5*5 neighbourhood. In this filtering technique we calculate median of the got median. It is an edge preserving and noise reducing smoothing filter. It is a technique to smooth images while preserving edges i.e. it has better corner preserving characteristics. Hybrid median filter is a windowed filter and used to improve the result of lane detection algorithm by filtering noise present in the images.
2.3 Edge Detection
Edge detection is another useful image processing technique, used to distinguish the boundary between two dissimilar regions in an image. Edge detection refers to the process of identifying and locating sharp discontinuities in an image. The discontinuities are abrupt changes in pixel intensity which characterize boundaries of objects in a scene. Edge detection is relatively little computing power, and there are many various edge detection algorithms developed. Sobel, Robert, Prewitt and Canny are examples of these. Each is sensitive to different type of edges. The various methods can be separated into two main groups: Laplacian and gradient. The gradient method works by finding discontinuities in the image, i.e. the maximum and minimum of the first derivative of the image. For the Laplacian method, a search for zerocrossings is performed in the second derivative of the image. Canny, the method used in this thesis, works on this approach. Edges in images, by their nature are a large jump in intensity for one pixel to the next. Unfortunately, this is the same for noise in an image. Therefore, before edge detection in an image can take place, noise removal must be done. This can be done by “blurring” the image: averaging out the pixel intensities on a localised scale. This is what is implemented in the canny algorithm. Most edge detection is carried out on binary images or grayscale.
2.3.1 Canny edge detection
The Canny edge detector is an edge detection operator that uses a multi-stage algorithm to detect a wide range of edges in images. It was developed by John F. Canny in 1986. The Canny edge detector is widely used in computer vision to locate sharp intensity changes and to find object boundaries in an image. The Canny edge detector classifies a pixel as an edge if the gradient magnitude of the pixel is larger than those of pixels at both its sides in the direction of maximum intensity change [2]. The canny edge detector first smoothes the image to eliminate the noise. It then finds the image gradient to highlight regions with high spatial derivatives. The algorithm then tracks along these regions and suppresses any pixel that is not at the maximum (non maximum suppression). The gradient array is now further reduced by hysteresis. Hysteresis is used to track along the remaining pixels that have not been suppressed. Hysteresis uses two thresholds and if the magnitude is below the first threshold, it is set to zero
threshold, it is made an edge. And if the magnitude is between the 2 thresholds, then it is set to zero unless there is a path from this pixel to a pixel with a gradient above 2nd threshold.
2.4 The Hough Transform
The classical Hough transform was concerned with the identification of lines in the image, but later the Hough transform has been extended to identifying positions of arbitrary shapes, most commonly circles or ellipses. The Hough transform as it is universally used today was invented by Richard Duda and Peter Hart in 1972, who called it a "generalized Hough transform” after the related 1962 patent of Paul Hough. Hough transform is one of the powerful global methods for shape detection such as detecting lines, curves and ellipses. It is performed after Edge Detection. According to Hough Transform “Each pixel in image space corresponds to a line in a parameter space (Hough space)”.
The Hough transform is an image processing technique for feature extraction. It is more commonly used for detection of lines in an image, but can also be used to detect any arbitrary shapes, for example circles, ellipses, and so on. For this thesis, it is used for its more common purpose. The underlying principle of the Hough transform is that every point in the image has an infinite number of lines passing through it, each at a different angle. The purpose of the transform is to identify the lines that pass through the most points in the image, i.e. the lines that most closely match the features in the image. To do this, a representation of the line is needed that will allow meaningful comparison in this perspective. A second line is drawn from the origin to the nearest point on the line at right angles. The angle that this second line makes to the origin is recorded, as is the distance from the origin to the point where the two perpendicular lines meet. These values are known as “theta” (θ) and “rho” (ρ).
Fig.1 Hough transform for detecting straight lines
3. RESULT AND DISCUSSIONS
3.1 Experimental test bed
[image:2.595.309.549.667.760.2]This section contains different images which are tested on the designed algorithm.
Table 1: Input data set
Image Size in (KBs) Extension
Image 1 24 jpg
Image 2 1386 bmp
Image 3 2132 bmp
Image 4 842 bmp
Image 5 792 bmp
Image 8 727 bmp
Image 9 200 jpg
Image 10 167 jpg
Image 11 41 jpg
Image 12 26 jpg
Image 13 176 jpg
Image 14 35 jpg
Image 15 109 Jpg
Table 1 is showing the different images taken for experimental purpose. These images are tested on proposed and existing method. It is found that the proposed algorithm provide better results subjectively.
3.1.1 Experimental results and comparison
This section contains the results taken by implementing the proposed and existing algorithm. 15 images will be passed through the algorithm one by one and then the performance comparison of each will be shown.
3.1.2 Comparison among all the techniques
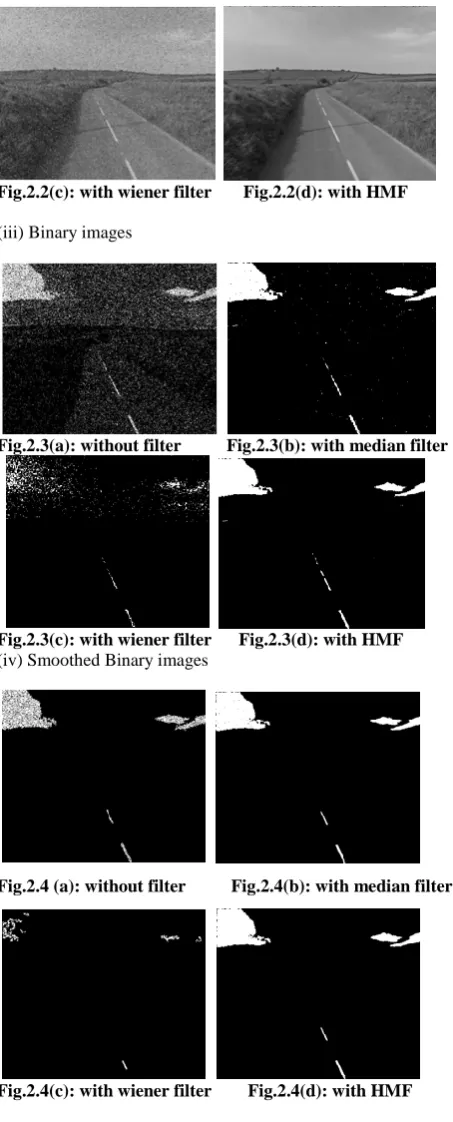
Figures below show the comparison of an image implemented on all the filtering techniques i.e. old method (image without filter), median filter, wiener filter and proposed method (hybrid median filter).
(i) Input images
Fig.2.1 (a): without filter Fig 2.1(b): with median filter
Fig.2.1(c): with wiener filter Fig.2.1(d): with HMF
(ii)Gray scale Images
Fig.2.2(a): without filter Fig.2.2(b): with median filter
Fig.2.2(c): with wiener filter Fig.2.2(d): with HMF
(iii) Binary images
Fig.2.3(a): without filter Fig.2.3(b): with median filter
Fig.2.3(c): with wiener filter Fig.2.3(d): with HMF (iv) Smoothed Binary images
Fig.2.4 (a): without filter Fig.2.4(b): with median filter
Fig.2.4(c): with wiener filter Fig.2.4(d): with HMF
(v) Canny Edge detected images
[image:3.595.317.544.69.631.2] [image:3.595.48.289.73.160.2] [image:3.595.56.276.367.694.2]Fig.2.5 (c) with wiener filter Fig.2.5 (d) with HMF
(vi) Smoothed Binary images
Fig.2.6(a): without filter Fig.2.6 (b): with median filter
Fig.2.6(c): with wiener filter Fig.2.6(d): with HMF
(vii) Output Images
Fig.2.7 (a) without filter Fig.2.7 (b) with median filter
Fig.2.7(c) with wiener filter Fig.2.7 (d) with HMF
3.2 Performance Analysis
This section contains the performance comparison of the proposed algorithm and existing algorithms by taking different performance parameters. The overall objective of this chapter is to prove that the proposed algorithms provide more accurate results than the existing algorithms.
3.2.1 Accuracy Analysis:
Accuracy is need to as much as possible. The accuracy of the
therefore the proposed algorithm is quite accurate than the others in most of the cases. While comparing with the base paper, the accuracy given there is almost 93% and hence the proposed algorithm is much better than that.
Table 2: Accuracy Analysis
Image Old Media
n filter
Wiener filter
Proposed (HMF)
1 94.59 99.89 99.77 99.94
2 95.02 99.92 99.33 99.97
3 96.93 99.73 99.82 99.80
4 95.39 99.90 99.94 99.95
5 95.23 99.87 99.63 99.92
6 95.52 99.88 99.94 99.93
7 96.07 99.81 99.77 99.84
8 95.17 99.87 99.93 99.93
9 96.08 99.82 99.90 99.90
10 95.65 99.73 98.90 99.80
11 95.94 99.73 99.48 99.84
12 98.01 99.82 99.88 99.86
13 96.63 99.81 99.85 99.87
14 96.58 99.93 99.96 99.96
[image:4.595.328.528.126.298.2]15 96.08 99.77 99.87 99.84
[image:4.595.53.279.169.645.2]Table 2 is showing the accuracy analysis of the proposed and existing technique. It is found that the accuracy of the proposed algorithm in case of the input images shown in table 1 has shown quite effective results than the existing method.
Figure 3: Accuracy Analysis
Figure 3 has shown the accuracy analysis of the proposed and existing techniques. Figure 3 has clearly shown that the accuracy in the proposed case is maximum than using the standard wiener and median filter. However for some specific images wiener and standard median filter has effective and almost equal result to the proposed algorithm but overall performance of the proposed algorithm i.e. hybrid median filter is quite better.
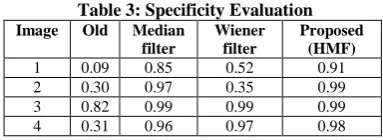
3.2.2 Specificity Evaluation:
As specificity needs to be maximized therefore it is proved that the Specificity of the proposed technique in case of the input images shown in table 1 has given objectively effective results than the surviving technique.
Table 3: Specificity Evaluation
Image Old Median
filter
Wiener filter
Proposed (HMF)
1 0.09 0.85 0.52 0.91
2 0.30 0.97 0.35 0.99
3 0.82 0.99 0.99 0.99
0 5 10 15
94 95 96 97 98 99 100
Input images
R
a
te
ACCURACY ANALYSIS Old technique
[image:4.595.327.525.355.524.2] [image:4.595.344.536.697.767.2]5 0.62 0.99 0.94 0.99
6 0.04 0.61 0.61 0.74
7 0.26 0.89 0.83 0.91
8 0.23 0.92 0.95 0.96
9 0.80 0.99 0.99 0.99
10 0.77 0.99 0.89 0.99
11 0.71 0.98 0.93 0.99
12 0.07 0.54 0.25 0.60
13 0.33 0.91 0.90 0.93
14 0.06 0.77 0.70 0.86
[image:5.595.85.275.71.180.2]15 0.05 0.57 0.58 0.65
Table 3 has shown the Specificity exploration of the proposed and available technique. It is clearly shown that the proposed algorithm is quite effective and giving accurate results.
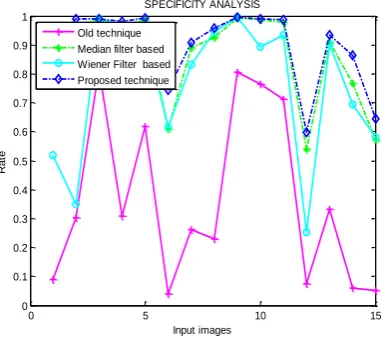
Figure 4: Specificity exploration analysis
Figure 4 has shown the Specificity exploration of the proposed and available filtering techniques. As specificity needs to be maximized therefore it is proved that the Specificity of the proposed technique in case of the input images shown in table 1 has given objectively effective results than the surviving technique. It is clearly shown that in many cases we have achieved specificity up to .99 which is almost equal to 1. Therefore we can justify in terms of specificity that the proposed algorithm is quite effective and giving accurate results.
3.2.3 Bit Error Rate (BER) Evaluation
:As required BER need to be reduced. It is clearly shown that BER is quite less in proposed algorithm reason behind this is the HMF.
Table 4 Bit Error Rate (BER) Evaluation
Image Old Median
filter
Wiener filter
Proposed (HMF)
1 45.48 7.56 24.10 4.66
2 34.82 1.48 32.50 0.47
3 9.12 0.70 0.58 0.53
4 34.62 1.89 1.54 0.98
5 19.05 0.67 2.88 0.40
6 48.08 19.48 19.28 12.76
7 36.86 5.55 8.39 4.66
8 38.57 3.76 2.72 2.18
9 9.78 0.43 0.28 0.24
10 11.72 0.70 5.31 0.52
11 14.35 1.06 3.24 0.63
12 46.30 23.02 37.34 20.06
13 33.47 4.47 4.86 3.23
14 47.00 11.63 15.27 6.73
[image:5.595.330.523.120.296.2]15 47.41 21.38 21.04 17.71
Table 4 has shown the BER investigation of the proposed and exiting procedure. It is found that the BER of the proposed procedure in case of the input images shown in table 1 has given fairly effective outcomes than the existing technique.
Figure 5: Bit Error Rate (BER) Analysis
Figure 5 has shown the Bit error rate analysis of the proposed and exiting techniques. Figure 5 has clearly shown that the BER in the proposed case is minimum than using the standard wiener and median filter. So it has shown that the proposed algorithm is quite effective and produces effective results than available techniques.
[image:5.595.69.260.226.395.2]3.2.4 PSNR Evaluation
:Table 5 has shown the PSNR examination of the planned and traditional method. It is proved that the PSNR of the proposed technique in case of the input images shown in table 1 has specified quantitatively improved consequences than the persisting technique.
Table 5: PSNR Evaluation
0 5 10 15
0 0.1 0.2 0.3 0.4 0.5 0.6 0.7 0.8 0.9 1
Input images
R
a
te
SPECIFICITY ANALYSIS
Old technique Median filter based Wiener Filter based Proposed technique
0 5 10 15
0 5 10 15 20 25 30 35 40 45 50
Input images
R
a
te
BER ANALYSIS
Old technique Median filter based Wiener Filter based Proposed technique
Image Old Median
filter
Wiener filter
Proposed (HMF)
1 9.93 26.72 23.45 29.40
2 10.41 28.10 18.79 33.20
3 13.28 24.14 25.73 25.35
4 10.72 27.40 29.30 30.33
5 11.01 26.59 21.79 28.81
6 10.68 26.25 29.08 28.91
7 11.33 24.27 23.42 25.19
8 10.48 26.07 28.42 28.58
9 12.39 25.97 28.28 28.46
10 11.83 24.05 17.35 25.40
11 11.85 23.64 20.46 25.96
12 14.11 24.45 26.33 25.70
13 12.00 24.41 25.47 25.93
14 11.81 28.31 31.43 31.15
[image:5.595.85.263.589.766.2]Figure 6: PSNR Comparison
Figure 6 has shown the PSNR examination of the planned and available filtering methods. It is proved that the PSNR of the proposed technique in case of the input images shown in table 1 has specified quantitatively improved consequences than the persisting techniques.
4. CONCLUSION AND FUTURE WORK
The lane detection is becoming popular in real time vehicular ad-hoc network. Intelligent transportation systems are now available for improving the security of the vehicles and prevent accident ratio. The methods developed so far are working efficiently and giving good results in case when noise is not presented in the images. But problem is that they fail or not give efficient results when there is any kind of noise in the road images. The noise can be anything like dust, shadows, puddles, oil stains, tire skid marks, etc. So in order to reduce these problems a new strategy is proposed which has integrated lane detection technique with many filters. The comparison among lane detection using different filters has shown quite effective results. The experimental results show the effectiveness of the proposed algorithm on both straight and slightly curved road scene images under different day light conditions and the presence of shadows on the roads. It is found that the proposed algorithm become even more powerful when noise is present in the input road images. In near future we will use the proposed algorithm in real time systems using the embedded systems. To improve the robustness of the algorithm, we can consider some other methods in the future, like: Lane detection can be implemented using guided image filtering technique, using Gabor filter. Fog removal algorithm is the next issue to be dealt with lane detection in the near future.5. ACKNOWLEDGMENT
We would like to express our deepest gratitude to Prof. R.K.Aggarwal Head of the ECE Department, LCET, Katani Kalan for his advice, motivation, guidance, moral support, efforts and attitude with which he solved all of our queries in making this research work possible.
We would like to thank all the faculty members of ECE department of our college specially Dr. Joginder Singh for their intellectual support and providing us with adequate infrastructure for carrying out our work.
6. REFERENCES
[1] Ballard D.H. 1981 “Generalizing the Hough Transform to Detect Arbitrary Shapes”, Computer Science Department, Vol.13, pp.111-122.
[2] Ding L., Goshtasby A. 2000. “On the Canny edge detector”, Department of Computer Science and Engineering, Wright State University, 303 Russ Engineering Center, Dayton, pp.721- 725.
[3] Yim Y.U. 2003. and Oh S.Y., “Three-Feature Based Automatic Lane Detection Algorithm (TFALDA) for Autonomous Driving”, IEEE Transactions on Intelligent Transportation Systems, vol.4, pp.219-225.
[4] McCall J.C, 2004. and Trivedi M.M., “An Integrated Robust Approach to Lane Marking Detection and Lane Tracking”, IEEE Intelligent Vehicles Symposium University of Parma, pp.533-537.
[5] Wanga Y., Teoh E.K., Shen D, 2004. “Lane detection and tracking using B-Snake”, Image and Vision Computing, pp.269-280.
[6] Xu S., Ying J., and Song Y, 2005. “Research on Road Detection Based on Blind Navigation Device”, IEEE, pp.69-71.
[7] Tseng C.C., Cheng H.Y., and Jeng B.S, 2005. “A Lane Detection Algorithm Using Geometry Information and Modified Hough Transform”, 18th IPPR Conference on Computer Vision, Graphics and Image Processing, pp.796-802.
[8] Lipski C., Scholz B., Berger K., Linz C., and Stich T, 2005. “A Fast and Robust Approach to Lane Marking Detection and Lane Tracking”, Computer Graphics Lab, pp.1-4.
[9] Kim Z.W, 2008. “Robust Lane Detection and Tracking in Challenging Scenarios”, IEEE Transactions on Intelligent Transportation Systems, vol.9, pp.16-26.
[10]Assidiq A.A.M., Khalifa O.O., Islam R., and Khan S. 2008, “Real Time Lane Detection for Autonomous Vehicles”, Proceedings of the International Conference on Computer and Communication Engineering, pp.82-88.
[11]Somasundaram G., Kavitha.,Ramachandran K.I. 2011, “lane change detection and tracking for a safe-lane approach in real time vision based navigation systems”, Department of Electrical and Electronics Engineering, CCSEA, pp.345-361.
[12] B.J.R. 2012., “A brawny multicolor lane detection method to Indian scenarios”, IJRET, Vol.1, pp.202 – 206. [13]Saha A., Roy D.D., Alam T., and Deb K. 2012,
“Automated Road Lane Detection for Intelligent Vehicles”, Global Journal of Computer Science and Technology Vol. 12, pp.1-5.
[14]Le M.C., Phung S.L., and Bouzerdoum A. 2012, “Pedestrian Lane Detection for Assistive Navigation of Blind People”, 21st International Conference on Pattern Recognition (ICPR), pp.2594- 2597.
[15]Zaidi S., Ali M.S., Nomani S., Khalid A.B., and Shamim F. 2012, “Automated lane detection for vehicular traffic”, NED University of Engineering and Technology. [16]Miao X., Li S., and Shen H. 2012, “On-Board Lane
Detection System for Intelligent Vehicle Based on Monocular Vision”, International journal on smart sensing and intelligent systems, vol. 5, pp.957- 972. [17]Zhao H., Teng Z., Kim H.H., and D.J. 2013, “Annealed
Particle Filter Algorithm Used for Lane Detection and Tracking”, Journal of Automation and Control Engineering, vol.1, pp.31-35.
0 5 10 15
5 10 15 20 25 30 35
Input images
R
a
te
PSNR ANALYSIS Old technique