How to cite this paper: Kazemzadeh, Y., Sourani, S., Reyhani, M., Shabani, A. and Maghami, E. (2014) Evaluation of Interfa-cial Tension by Image Processing of the Shape Drops. Open Access Library Journal, 1: e626.
http://dx.doi.org/10.4236/oalib.1100626
Evaluation of Interfacial Tension by Image
Processing of the Shape Drops
Yousef Kazemzadeh
1, Saeed Sourani
1, Mahshid Reyhani
1, Ali Shabani
2, Elahe Maghami
3 1Department of Petroleum Engineering, School of Chemical and Petroleum Engineering, Shiraz University,Shiraz, Iran
2Department of Petroleum Engineering, Lamerd High Education Center, Lamerd, Iran 3Department of Petroleum Engineering, Azad University of Lamerd, Lamerd, Iran Email: [email protected]
Received 14 April 2014; revised 20 May 2014; accepted 23 June 2014
Copyright © 2014 by authors and OALib.
This work is licensed under the Creative Commons Attribution International License (CC BY). http://creativecommons.org/licenses/by/4.0/
Abstract
An interface of fluid phases is created by unbalanced molecular attracting and repulsive force. Evaluating the gas-liquid interfacial tension is very important and major interest in injection processes. The interfacial tension between gas and liquid phases can be measured by different methods in the reservoir and surface condition. VIT (vanishing interfacial tension technique) is a laboratory method that calculates interfacial tension for mixture of oil-gas in the series of sure. Estimating the amount of the minimum miscibility pressure (MMP) is taken to be the pres-sure at which the interfacial tension tends to zero when plotted against prespres-sure. The surface ten-sion calculation is done by image processing of sessile and pendant drops of crude oil enclosed in a surrounding medium of the injection gas. In this paper use a computer program for processing and digestion the shape of a pendant drop has been brought.
Keywords
Interfacial Tension, Drop Shape Analysis, Minimum Miscibility Pressure, Vanishing Interfacial Tension Technique
Subject Areas: Chemical Engineering & Technology, Computer Engineering, Industrial Engineering, Software Engineering
1. Introduction
de-OALibJ | DOI:10.4236/oalib.1100626 2 June 2014 | Volume 1 | e626 termined as those at which the interfacial tension is zero [5]-[8]. However, it is impossible to measure interfacial tension when it becomes zero [9] [10]. So the VIT method relies on measuring gas-oil interfacial tension to as low value as experimental accuracy allows, and then extrapolation of data to zero interfacial tension (IFT condi-tion). Thus the VIT method requires accurate measurement of gas-oil interfacial tension at reservoir conditions, which is discussed below [3].
2. Interfacial Tension
If we want to store the energy, we should create surfaces. The work required to distort a liquid to increase its sur-face area by an amount of dA is proportional to the number of molecules that must be brought up to the sursur-face so:
W dA
δ = ⋅γ
where γ is the interfacial tension [11]. In the other word:
( )
γ is the energy that must be supplied to increase the surface area by one unit. Surface tension can also be defined as a force per length unit. Surface forces affect fluid phase equilibrium [11]. A tension always exists at the interface of fluid phases due to unbalanced molecular attractive and repulsive forces. Surface and interfacial tension of fluids are results of molecular properties occurring at the surface or interface. Surface tension may be defined as the contractile tendency of a liquid surface that exposed to the gases [12]. The interfacial tension is a similar tendency which exists when two immiscible liquids are in contact.3. Measurement of Interfacial Tension
Numerous methods and techniques exist for measuring interfacial tension. Some of these standard methods and techniques are:
1) Wilhelmy’s method, in which first dips a thin plate or a ring and then measures the capillary force acting on the plate.
2) The rise of a liquid in a small capillary tube.
3) The methods based on the shape of a drop, in which one characterizes the shape of drops in various confi-gurations (deposited, rotating, hanging).
4) Capillary waves: one excites capillary waves and one measures the relation between frequency and wave-length by monitoring the distortion of the surface by means of a laser beam [11].
4. Methods Based on the Shape of Static Drops
Small drops tend to be like a globular because surface forces depend on the area, which decreases as the square of the linear dimension, whereas distortion due to gravitational effects depends on the volume, which decreases as the cube of the linear dimension. Likewise, a drop of liquid in a second liquid of equal density will be spheri-cal. However, when gravitational force and surface tension effects are comparable, then one can determine in principle the surface tension from measurement of the shape of the drop [11].
The general procedure is forming a drop under condition such that it is not subject to disturbances and then measuring its dimensions or profile from a photograph or with digital image processing of video images. Re-cently the image analysis has been automated to improve accuracy over manual analysis. In an axisymmetric drop shape analysis of surface tension, the pendant drop geometry is preferable because large drops can be made axisymmetric easily. Sessile drop however, are useful for study of the contact angle. The greatest accuracy is achieved with fewer and very accurate points on the drop surface rather than a large number of less reliable points [13].
4.1. Pendant Drop Method
OALibJ | DOI:10.4236/oalib.1100626 3 June 2014 | Volume 1 | e626
(
)
2
l v e
gd l
σ = ρ −ρ
where, g is the acceleration due to gravity and ρl and ρv are the liquid and the vapor phase densities, respec-tively (l), the drop shape factor, is a function of R=ds de, where de is the equatorial diameter, or the maxi-mum horizontal diameter of the drop and ds is the diameter of the drop measured at the height de above the bottom of the drop.
4.2. Sessile Drop Method
Determining the liquid surface tension from observations made on a large (sessile) drop resting on a horizontal surface has the advantage that readings are taken only on the liquid surface and do not involve angles of liquid and solid contact When we want to use this method.
h measurement ,the vertical distance between the top of the drop and the horizontal plane of maximum section and the amount of the diameter (2r) which we insert it into the correction factor to be used in the well-known formula for a droplet with infinite diameter:
2
1
2 gh
γ = ρ
4.3. Spinning Drop Method
In this method a drop of fluid with low density is being injected into a container of the denser liquid and the whole system is rotated. As a result, in the centrifugal area, the drop lengthens along the axis of rotation and be-cause this action increase the area and interfacial tension is against the increasing the area [11]. So interfacial tension is against the elongation and a configuration which minimizes the system free energy is reached. The method is similar to that, for the pendant drop, the gravitational acceleration g replaced by the appropriate acce-leration term made from a centrifugal field [13].
If the fluid densities are ρA and ρB, and the angular velocity ω of rotation is known, then interfacial ten-sion can be calculated from the measured drop profile. When drop length is much greater than the radius rm, the following approximate expression holds:
(
)
2 34 B A rm
ρ ρ ω
σ = −
The spinning drop device has been widely used in recent years to measure very low interfacial tensions. Un-like the other methods, no contact between the fluid interface and a solid surface is required [14].
5. Vanishing Interfacial Tension
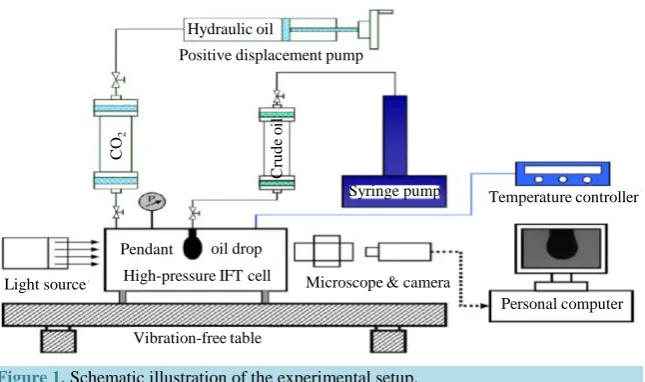
For the exact measurement of IFT between oil and gas it needs to density be measured in experiment’s pressure and temperature. For measurement of density in different pressure and temperature DMA HPM (Anton-Paar, Austria) densitometer is used. For the regulating of densitometer’s temperature, it connected to an oil (ghee) bath (haber) and then it regulated. (By using detent around DMA HPM, temperature regulating will be done quickly) [15]. After density determination, is the turn to IFT between oil and gas be measured. InFigure 1 IFT measurement is showed. Which includes one observable cell (case or chest) with high pressure. A high pressure emerald glass is in front of the cell. High pressure cell includes a capillary tube which is on the top of it that we inject the oil droplets to gas by this from above. This system includes a device for oil injection [15] [16].
A high pressure pomp and a pressure gauge for pressure measurement is in the system. All the system is in the heat cell that can be controlled. This picture tacked by a camera, there is a light source on the other side of the cell which provide the mentioned light. Camera is connected to a computer monitor equipped with a software named droplet’s shape analysis which is used for IFT calculation between oil and gas. A desire gas mixture in-jected to the observable high pressure cell that has the reservoir temperature, injection continues up to the se-lected pressure [15] [16].
OALibJ | DOI:10.4236/oalib.1100626 4 June 2014 | Volume 1 | e626
Figure 1. Schematic illustration of the experimental setup.
regulate the temperature of observable cell, total fluid storage tank and droplet. By fluid injection piston, consi-dered oil entered the droplet fluid injection cell and also consiconsi-dered gas entered to droplet fluid injection tank. Pressure producer is used for injecting gas to observable cell and considered gas injected to cell at desire pres-sure. Then it has enough time to reach complete equilibrium (pressure and temperature of observable cell to be constant ). The oil fluid which temperature achieved balance in tank, injected from above of cell as droplet with opening the valve slowly. Droplet shap analysis software calibrated by fluid injecting tube diameter and oil and gas densities in considered pressure entered. IFT measurement continued up to it gets constant (reaching ther-modynamic equilibrium). To achieve therther-modynamic equilbrium quickly, several oil droplets (10 - 20 droplets) injected to cell. In this experiment time equilibrium is considered that IFT not to be changed during time. Ac-cording to plant’s few mili newtonian oscillation, IFT changes v.s time traced at first then average of measured IFT in the last 100 second districted as IFT in that pressure and temperature.
6. Experimental Works
Input parameters program requires to analyze the image and measure interfacial tension are gas density, liquid (crude oil) density, needle size (to use as scale) and the address of the image.
In this method pendent drop equation is used for measuring the interfacial tension. (Most of available soft-ware’s use this equation to evaluate the interfacial tension) [17].
(
)
2
l v e
gd l
σ = ρ −ρ
Values of gas and oil densities are measured experimentally with Anton Paar density meter (A useful system for measuring densities of the fluid in high temperature and pressure condition with high accuracy).
The main part of this program according to the pendent drop equation is calculating the biggest horizontal diameter of the liquid drop named de in above equation. The small liquid drop is allowed to hang from the tip of a capillary tube in a high pressure visual cell filled with its equilibrated vapor.
de is the diameter of the drop measured in the altitude of de above the bottom of the drop and is another im-portant required parameter for input of program. It is also calculated by processing the image of the drop after recognizing de with this program. Finally the last required parameter is drop shape factor, determined by fraction of ds/de from the table of drop shape factor [18].
There are different methods for processing the image of drop. These methods are using the edge correlation of the drop or checking pixel by pixel.
In this work because the processing is done under the static condition for decreasing the error of measurement the method of checking pixel by pixel is used.
The purpose of producing this program is to correct the limitation and existence problems and omit them. Some of these restrictions and problems are:
Hydraulic oil
Positive displacement pump
CO
2
Temperature controller
Light source
C
ru
d
e o
il
Syringe pump
Personal computer
Vibration-free table Pendant oil drop
OALibJ | DOI:10.4236/oalib.1100626 5 June 2014 | Volume 1 | e626 1) Most of these softwares are monopoly so the processing of images of other systems and cameras, even the images of the same other system, cannot be done.
2) It is not feasible in some software to process the own system images, because their measured values are lost or not available for a second time.
3) Softwares are designed according to the camera of the system and the image resolution of that camera, and it is impossible that software had enough accuracy for processing images from different cameras because of dif-ferent resolutions.
So one of the important corrected of the problem in this program is to create a method for processing images from different camera with different resolutions.
7. Results and Discussion
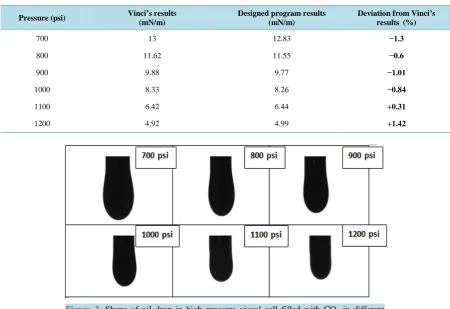
Interfacial tension between an oil sample with 28 degree of API and known composition has been measured. Values of interfacial tension measured by Vinci VIT apparatus and the recorded image was analyzed by our program that explained above. These values are compared with Vinci’s results and reported inTable 1. The fourth column of the table indicates the percent deviation from the results of Vinci’s VIT apparatus.
Figure 2 Shows oil drop shape in high pressure visual IFT cell filled with CO2 in sequence pressure and 50˚C.
Figure 3 shows IFT measured with Vinci VIT apparatus against pressure. Value of minimum miscibility pressure of the oil sample and CO2 evaluate 1502.99 if interfacial tension extrapolates to zero when plotted against pressure.
Figure 4shows IFT measured with IFT program image against pressure.
Value of minimum miscibility pressure of the oil sample and CO2 evaluate 1502.99 if interfacial tension extrapolates to zero when plotted against pressure.
Table 1. Comparison between IFT measured by Vinci’s VIT apparatus and our program in sequence pressure.
Deviation from Vinci’s results (%) Designed program results
(mN/m) Vinci’s results
(mN/m) Pressure (psi)
−1.3
12.83 13
700
−0.6
11.55 11.62
800
−1.01
9.77 9.88
900
−0.84
8.26 8.33
1000
+0.31
6.44 6.42
1100
+1.42
4.99 4.92
[image:5.595.87.538.396.705.2]1200
OALibJ | DOI:10.4236/oalib.1100626 6 June 2014 | Volume 1 | e626
Figure 3. Vinci’s interfacial tension results against pressure.
Figure 4. IFT program image processing interfacial tension result against pressure.
8. Conclusion
According to the results, IFT program image processing has measured the values of interfacial tension with an acceptable accuracy nearby the values measured with Vinci VIT apparatus. In other words, the deviation be-tween program results and Vinci VIT apparatus is rarely more than one percent. The value of minimum misci-bility pressure of this program has a deviation less than 9 Psi from VIT system results for this specific oil sample. This is the deviation which is less than 0.6 percent.
References
[1] Rao, D.N. (1997) A New Technique of Vanishing interfacial Tension for Miscibility Determination. Fluid Phase Equi- libria, 139, 311-324. http://dx.doi.org/10.1016/S0378-3812(97)00180-5
[2] Rao, D.N. and Lee, J.I. (2002) Application of the New Vanishing Interfacial Tension Technique to Evaluate Miscibility Conditions for the Terra Nova Offshore Project. Journal of Petroleum Science and Engineering, 35, 247-262. http://dx.doi.org/10.1016/S0920-4105(02)00246-2
[3] del Rio, O.I. and Neumann, A.W. (1997) Axisymmetry Drop Shape Analysis: Computational Methods for the Mea- surement of Interfacial Properties from the Shape and Dimensions of Pendant and Sessile Drops. Journal of Colloid and Interfacial Science, 196, 136-147.
[4] Rotenberg, Y., Boruvka, L. and Neumann, A.W. (1983) Determination of Surface Tension and Contact Angle from the Shapes of Axisymmetry Fluid Interfaces. Journal of Colloid and Interfacial Science, 93, 169-183.
[5] Lindeberg, B.G.E., Bjorkvik, J.A.B. and Strand, A.K. (1996) Interface Light Scattering Measurement of Low Interfa- cial Tension on a Gas Condensate System at High Pressure and Temperature. Paper SPE 35427, Prepared for Presen-tation at the1996 SPE/DOE Symposium on Improved Oil Recovery, Tulsa, 21-24.
[6] Dorshow, B.R. (1995) The Simultaneous Measurement of Interfacial Tension and Oilviscosity at Reservoir Conditions for Prudhoe Bay Fluids by Surface Laser Light Scattering Spectroscopy. Paper SPE 22633.
[7] Ayirala, S.C., Xu, W. and Rao, D.N. (2006) Interfacial Behavior of Complex Hydrocarbons at Elevated Pressures and
y = -0.0164x + 24.649 R² = 0.9985
0 2 4 6 8 10 12 14
400 600 800 1000 1200 1400
IF
T
(
mN
/m)
Pressure (psi)
y = -0.016x + 24.184 R² = 0.9983
0 2 4 6 8 10 12 14
400 600 800 1000 1200 1400
IF
T
(mN
/m)
[image:6.595.162.469.264.393.2]OALibJ | DOI:10.4236/oalib.1100626 7 June 2014 | Volume 1 | e626 Temperatures. The Canadian Journal of Chemical Engineering, 84, 82-91.
[8] Ayirala, S.C. (2005) Measurement and Modeling of Fluid-Fluid Miscibility in Multicomponent Hydrocarbon Systems. Doctor of Philosophy Dissertation, LSU Department of Petroleum Engineering.
[9] Wang, X., Zhang, S. and Gu, Y. (2010) Four Important Onset Pressures for Mutual Interactions between Each of Three Crude Oils and CO2. Journal of Chemical & Engineering Data, 59, 61-69.
[10] Nobakht, N., Moghadam, S. and Gu, Y. (2008) Mutual Interactions between Crude Oil and CO2 under Different Pres- sures. Fluid Phase Equilibria, 265, 94-103. http://dx.doi.org/10.1016/j.fluid.2007.12.009
[11] Adamson, A.W. and Gast, A.P. (1997) Physical Chemistry of Surfaces. John Wiley & Sons, Inc., New York.
[12] Harkins, W.D. and Brown, F.E. (1919) The Determination of Surface Tension (Free Surface Energy) and the Weight of Falling Drops: The Surface Tension of Water and Benzene by the Capillary Height Method. Journal of the American Chemical Society, 41, 499-525. http://dx.doi.org/10.1021/ja01461a003
[13] Richards, T.W. and Carver, E.K. (1921) A Critical Study of the Capillary Rise Method of Determining Surface Ten- sion, with Data for Water, Benzene, Toluene, Chloroform, Carbon Tetrachloride, Ether and Dimethyl Aniline. Journal of the American Chemical Society, 43, 827-847. http://dx.doi.org/10.1021/ja01437a012
[14] Yang, D., Tontiwachwuthikul, T. and Gu, Y. (2005) Interfacial Interactions between Reservoir Brine and CO2 at High Pressures and Elevated Temperatures. Energy & Fuels, 19, 216-223. http://dx.doi.org/10.1021/ef049792z
[15] Nino Amézquita, O.G., Enders, S., Jaeger, P.T. and Eggers, R. (2010) Interfacial Properties of Mixtures Containing Supercritical Gases. The Journal of Supercritical Fluids, 55, 724-734. http://dx.doi.org/10.1016/j.supflu.2010.09.040 [16] Rao, D.N. and Lee, J.I. (2003) Determination of Gas-Oil Miscibility Conditions by Interfacial Tension Measurements.
Journal of Colloid and Interface Science, 262, 474-482.
[17] Cheng, P., Li, D., Boruvka, L., Rotenberg, Y. and Neumann, A.W. (1990) Automation of Axisymmetric Drop Shape Analysis for Measurements of Interfacial Tensions and Contact Angles. Colloids and Surfaces, 43, 151-167.
http://dx.doi.org/10.1016/0166-6622(90)80286-D