http://dx.doi.org/10.4236/jssm.2015.83034
A Decision-Making Method for Improving
Logistics Services Quality by Integrating
Fuzzy Kano Model with
Importance-Performance Analysis
Qingliang Meng1,2, Xuan Jiang2, Lingling Bian21Business School, Hunan University, Changsha, China
2School of Management and Economics, Jiangsu University of Science and Technology, Zhenjiang, China
Email: [email protected], [email protected]
Received 2 May 2015; accepted 27 May 2015; published 1 June 2015
Copyright © 2015 by authors and Scientific Research Publishing Inc.
This work is licensed under the Creative Commons Attribution International License (CC BY).
http://creativecommons.org/licenses/by/4.0/
Abstract
In resources limited circumstances, seeking relationship between customer satisfaction and logis-tics service performance is meaningful for the development of logislogis-tics companies. Therefore, it is crucial for logistics companies to understand that logistics service quality attributes can increase satisfaction and their improvement priorities can help make better decisions. Thus, the identifica-tion of logistics service quality attributes importance and their contribuidentifica-tions on improving cus-tomer satisfaction have become more necessary to logistics companies success. Considering tradi-tional Kano model classification is subjective, the contribution of this study is, therefore, to inte-grate fuzzy Kano model with importance-performance analysis to address the shortcomings with using these two methods separately. What’s more, constructing a decision-making method can help logistics companies determine the priority of logistics service quality attributes. Finally, an empirical study on customer satisfaction was undertaken. The feasibility and effectiveness of this method had been verified.
Keywords
Fuzzy Kano Model, Importance-Performance Analysis, Logistics Service Quality, Decision-Making Method
1. Introduction
realize that if they do not satisfy the expectation of customers, their place will be taken by other companies whose activities will be more concentrated on customer expectations [1]. But Chinese local logistics companies are of small and medium size, and scattered distribution, the only way to improve customer satisfaction is to en-hance logistics services quality. Therefore, logistics services are gaining prominence in China as demonstrated through its essentiality and customer expectation [2]. In order to identify the priority of logistics services quality attributes, a decision-making method is constructed.
The Kano model of customer satisfaction proposes that the relationship between an attribute’s performance and satisfaction is non-linear. The purpose of customers’ satisfaction research is to reflect the real situation. However, researchers applied Kano’s model are always lack of considering the fuzzy and uncertainty of mental-ity and affection when devising questionnaire [3]. Brandt [4] firstly developed a dummy regression model to identify the non-linear and asymmetric impacts of attribute performance on overall customer satisfaction. Yang [5] recommended that the results of classification should be divided into eight categories, so as to improve the accuracy of the Kano model. Although these methods facilitate the analysis of customer requirements, it ignores the fact that quality attribute performance and importance can affect the results of classification. Therefore, this study aims at integrating fuzzy Kano model with IPA model to address the shortcomings with using these two methods separately.
The rest of this paper is structured as follows. First we introduce the proposed fuzzy Kano model. Then we construct a detection method by integrating fuzzy Kano model with IPA to identify the priority of logistics ser-vices quality attributes. Following that, the results of the empirical study are presented. Conclusions are finally drawn in the last section.
2. The Proposed Fuzzy Kano Model
To deal with fuzziness of human thought, Zadeh [6] first introduced the fuzzy set theory, which was directed to the rationality of uncertainty through fuzziness or unknown situations. A major contribution of fuzzy set theory is able to represent fuzzy data. A fuzzy set is a class of elements with a continuum or discreteness of degrees of membership. Such a set is characterized by a characteristic function, which assigns to each element a degree of membership ranging between zero and one [3].
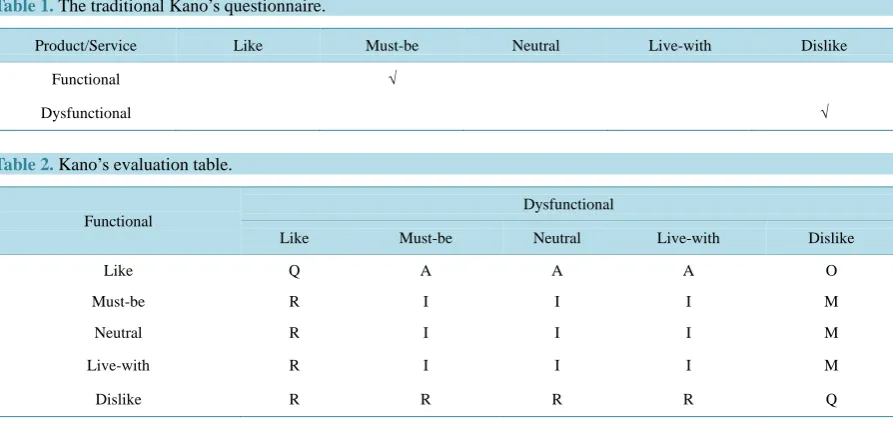
According to the traditional Kano’s questionnaire (Table 1) and Kano’s evaluation table (Table 2), attributes are classified into five classes with distinct impacts on consumer satisfaction: attractive, one-dimensional, must- be, indifferent, and reverse attributes.
[image:2.595.89.537.512.727.2]Traditional Kano’s questionnaire only set up singular answer or certain range of the answer, and customers can’t respond their multiple affections. If customers can select more than one answer to express the degree of their feelings, the answer presented will be closer to real thinking. Therefore, to meet the multiple affections of customers, a fuzzy Kano’s questionnaire based on the fuzzy logic is designed (Table 3).
Table 1. The traditional Kano’s questionnaire.
Product/Service Like Must-be Neutral Live-with Dislike
Functional √
Dysfunctional √
Table 2. Kano’s evaluation table.
Functional
Dysfunctional
Like Must-be Neutral Live-with Dislike
Like Q A A A O
Must-be R I I I M
Neutral R I I I M
Live-with R I I I M
[image:2.595.90.537.513.725.2]Table 3.The fuzzy Kano’s questionnaire.
Product/Service Like Must-be Neutral Live-with Dislike
Functional 0.2 0.7 0.1
Dysfunctional 0.2 0.8
Based on fuzzy Kano questionnaire, customers’ real feeling will be acquired. If we want to know ‘‘Whether or not to have a message to inform you?” to a customer belonging to which kind of quality attributes, its fuzzy idea result (Table 3) will be presented with combination of functional and dysfunctional.
A customer’s feeling is: F = [0.2 0.7 0.1 0 0] D = [0 0 0 0.2 0.8]
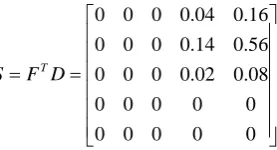
Use matrix multiplication, FT ⊗D will obtain a 5 × 5 Kano’s two-dimensional fuzzy relation combination S
as:
0 0 0 0.04 0.16
0 0 0 0.14 0.56
0 0 0 0.02 0.08
0 0 0 0 0
0 0 0 0 0
T
S F D
= =
After S being obtained, two-dimensional attribute classification will be acquired based on Matzler and Hin-terhuber’s [7] model as shown in Table 2.
Regarding to ‘‘Is there a message to inform me ?”, the customer has 0.64 feeling of this issue belonging to must-be quality attribute while 0.16 of one-dimensional quality attribute, 0.16 of indifferent quality attribute and 0.04 of attractive quality attribute .
, , , , ,
0.64 0.16 0.16 0.04 0 0
M O I A R Q
T =
In order to find a more accurate classification, the α-cut common consensus standard concept is used to get T. The threshold value of α≥ 0.4 as an example, when total quality attribute level is greater than α, “1” will be represented; while is less than α, “0” will be represented. And T = (1, 0, 0, 0, 0) means the quality attribute can be classified to must-be.
Finally, the largest identification frequency of quality attribute fuzzy Kano’s model is the result agreed by majority. If the identification frequency is equal, the results can be determined according to the prioritization of quality attribute category. The prioritization of quality attribute category as following: first is must-be, then one-dimensional, attractive, indifferent and reverse attributes.
3. The Constructed Detection Method
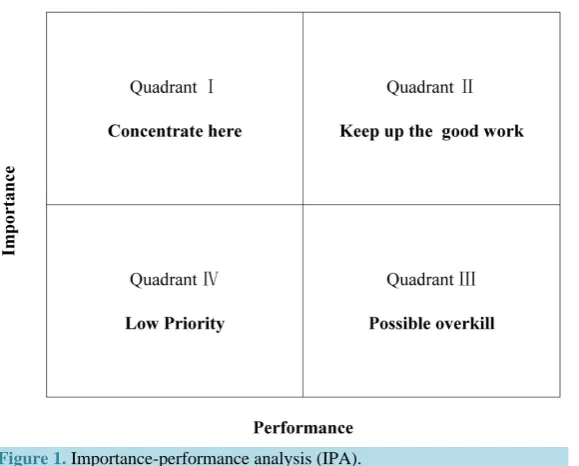
3.1. Importance-Performance AnalysisImportance-performance analysis, originally introduced by Martilla and James [8], is a technique for prioritizing attributes for improvement based on customers evaluation of the importance of each product or service attribute and provider performance in each attribute [9]. In general, data from satisfaction surveys are used to construct a two-dimensioned matrix, where importance is depicted along the x-axis and performance along the y-axis. The matrix is divided into four quadrants by different degree of importance and performance (see Figure 1).
Quadrant I means “Concentrate here”, products or service attributes are rated high in importance but low in performance. To improve performance, a company should concentrate on these attributes.
Quadrant II means “Keep up the good work”, products or service attributes are considered high in both im-portance and performance. The company should maintain competitive advantage.
Figure 1.Importance-performance analysis (IPA).
Quadrant IV means “Low Priority”, products or service attributes both low in importance and performance. Company should ignore these attributes.
3.2. The Integrated Fuzzy Kano and IPA Model
In order to calculate the satisfaction rating of each attribute, Kano [10] proposed contribution of satisfaction coefficient (CS coefficient). CS coefficient means the ability of a product or service attribute that can enhance satisfaction.
A O
i
A O M I
f f
CS
f f f f
+ =
+ + + (1)
For the purpose of estimating the importance of attributes, questions about products or service importance in the questionnaire should be designed. For the convenience of calculation, attributes importance rating is coded (Table 4). For example, “unimportant” is coded “1”.
Hence the CS coefficient and importance coefficient were both obtained. To construct the importance-per- formance matrix, the mean of the attribute’s CS coefficient was calculated. Also, the mean of the attribute’s im-portance coefficient was calculated.
What’s more, when attributes locate in the same quadrant, there are different priorities of these attributes. The prioritization of quality attribute category as following: first is must-be, then one-dimensional, attractive and in-different attributes. Therefore, the priority of service quality attributes was determined by integrating the fuzzy Kano model and IPA. And companies can enhance service quality by improving the attribute which is the top priority.
3.3. The Decision-Making Method for Improving Logistics Services Quality
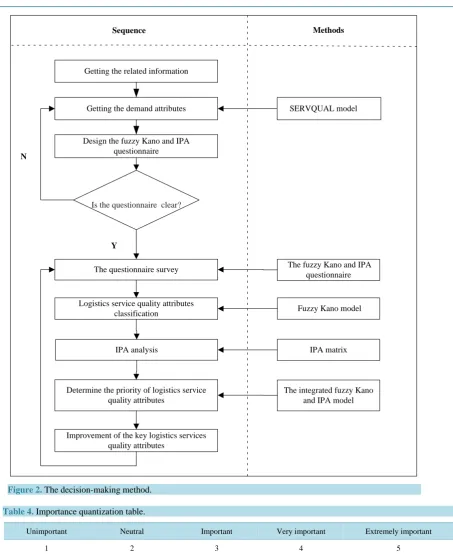
Figure 2 shows the constructed decision-making method. The method can help companies ascertain the logistics service quality attributes and determine the priority of logistics service quality attributes.
Figure 2. The decision-making method.
Table 4.Importance quantization table.
Unimportant Neutral Important Very important Extremely important
1 2 3 4 5
4. Data Analysis and Results
This section uses empirical data of the case study to show some of the problems of the logistics service in China. The main purpose is to make clear, for Chinese local logistics companies, the need for the improvement of the key logistics service quality attributes. The attributes of logistics quality were identified through the SERVQUAL model (Table 5).
The questionnaire comprised two parts. The first part aims to understand the basic personal data of customers, Getting the related information
Getting the demand attributes
Design the fuzzy Kano and IPA questionnaire
Is the questionnaire clear?
The questionnaire survey
Logistics service quality attributes classification
IPA analysis
Determine the priority of logistics service quality attributes
Improvement of the key logistics services quality attributes
The fuzzy Kano and IPA questionnaire
Fuzzy Kano model
IPA matrix
The integrated fuzzy Kano and IPA model Y
N
Sequence Methods
Table 5.Logistics service quality attributes table.
Attribute Dimension
f1 Goods delivered within the specified time Reliability
f2 SMS notification in advance Empathy
f3 The postman door-to-door pick up the goods Empathy
f4 Delivered goods intactly Reliability
f5 Customers can easily query Responsiveness
f6 Member discount service Empathy
f7 Timely processing of complaints and compensation Responsiveness
f8 Appropriate price Empathy
f9 High quality of service Assurance
f10 Undelivered goods free reservations seven days Empathy
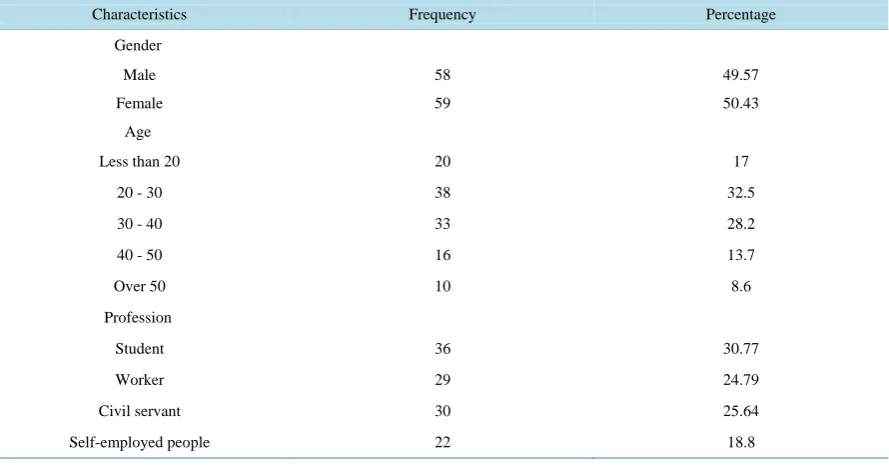
as well as their gender, age and profession. Table 6 provides the basic personal data of customers. Of the 117 total number of customers, 58 (49.57%) were male and 59 (50.43%) were female customers. This gender com-position is a reasonable representation of the customer in China. The majority of the customers were betweenthe ages of 20 and 40. Also, the majority (30.77%) of the customers were students, which we believe is the most important characteristic of the customer group who are most likely to use the logistics. The second part is the fuzzy Kano and IPA questionnaire which was designed according to the logistics service quality attributes table. By applying an approach of fuzzy Kano and IPA questionnaire to research the customers, the satisfaction and importance degree were both obtained. The survey was conducted with a random sample of customers. From April 20 through May 20, 2014, 150 copies have been issued and 117 copies of effective retrieved (78%).
Comparison of different threshold value of α, classification results of logistics service quality attributes were shown in Table 7. Through the Table 7, different threshold value of α obtained different classification results. For example, the logistics service quality attribute f3of α = 0.1 classification result is “indifferent”. However,
the logistics service quality attribute f3 of α = 0.3 classification result is “one-dimensional”. With different
thre-shold value of α, each of the logistics service quality attributes of frequency is different. The sum of the fre-quency of each service attribute under different confidence level was shown in Table 8.
On the one hand, α-cut is over small, lower sample subordination and over happy threshold will be formed. On the other hand, over large α-cut is easy to cause issue of fewer samples and decrease representation of infe-rence population. For example, when α = 0.1, the sum of the frequency of each service attribute is more than the number of effective questionnaire. There is a phenomenon of greater information crossover. When α = 0.7, the sum of the frequency of each service attribute is less than the number of effective questionnaire. There is a phe-nomenon of information distortion. Therefore, based on experience and references to set α = 0.4, it is able to ob-tain more accurate classification results. The final classification results of logistics service quality attributes are shown in Table 9.
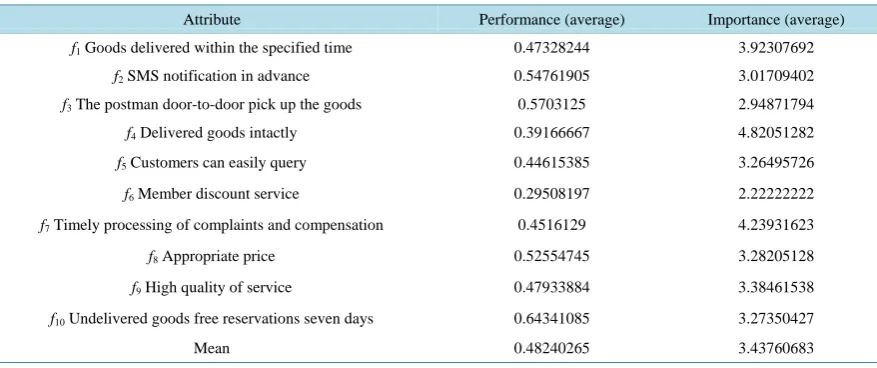
Table 10 shows the average satisfaction and importance degree of logistics service quality attributes. The av-erage importance of logistics service quality attributes is 3.43760683 andthe average perceived performance of logistics service quality attributes is 0.48240265. By utilizing the data in Table 10, the IPA matrix was con-structed (see Figure 3).
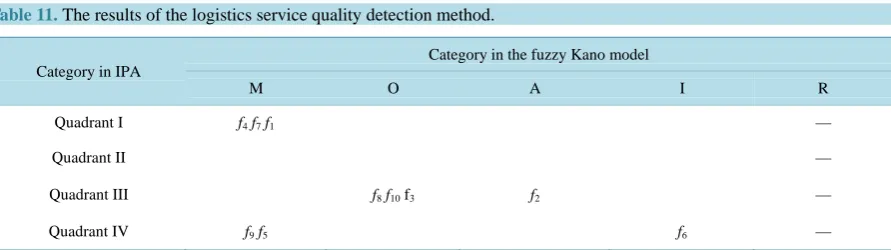
Through the analysis of Figure 3, the priority of logistics service quality attributes was determined. Table 11 shows the results of the logistics service quality detection method. According to Table 11, three attributes, f4, f7
and f1, are the most in need of improvement. These attributes are classified as must-be, which are rated high in
importance but low in performance. To improve logistics service quality, the companies should concentrate on these attributes. Under the framework of IPA, f8, f10, f3and f2 are placed in the area of “possible overkill”.
Ac-cording to IPA, a reduction of the resources allocated for these attributes can be considered. Finally, f9, f5and f6
are located in “low priority” of the IPA matrix, indicating no urgent need for improvement.
Figure 3. Importance-performance analysis.
Table 6. The basic personal data of customers.
Characteristics Frequency Percentage
Gender
Male 58 49.57
Female 59 50.43
Age
Less than 20 20 17
20 - 30 38 32.5
30 - 40 33 28.2
40 - 50 16 13.7
Over 50 10 8.6
Profession
Student 36 30.77
Worker 29 24.79
Civil servant 30 25.64
[image:7.595.89.538.605.720.2]Self-employed people 22 18.8
Table 7. Classification results of logistics service quality attributes under different confidence level.
Attribute α = 0.1 α = 0.3 α = 0.4 α = 0.5 α = 0.7
f1 M M M M M
f2 A A A A A
f3 I O O O O
f4 M M M M M
f5 M M M M M
f6 I I I I I
Continued
f8 A O O O A
f9 M M M M M
[image:8.595.86.536.96.148.2]f10 O O O O O
Table 8.The sum of the frequency of each service attribute under different confidence level.
Attribute α = 0.1 α = 0.3 α = 0.4 α = 0.5 α = 0.7
f1 167 138 131 126 92
f2 163 139 126 121 98
f3 174 135 128 115 96
f4 134 121 120 118 114
f5 174 136 130 124 98
f6 135 124 122 116 109
f7 153 130 124 120 106
f8 170 144 137 120 89
f9 149 124 121 120 106
f10 164 136 129 119 111
Table 9. The final classification results of logistics service quality attributes.
Attribute Classification results
f1 Goods delivered within the specified time M
f2 SMS notification in advance A
f3 The postman door-to-door pick up the goods O
f4 Delivered goods intactly M
f5 Customers can easily query M
f6 Member discount service I
f7 Timely processing of complaints and compensation M
f8 Appropriate price O
f9 High quality of service M
[image:8.595.88.538.172.332.2]f10 Undelivered goods free reservations seven days O
Table 10. The average satisfaction and importance degree of logistics service quality attributes.
Attribute Performance (average) Importance (average)
f1 Goods delivered within the specified time 0.47328244 3.92307692
f2 SMS notification in advance 0.54761905 3.01709402
f3 The postman door-to-door pick up the goods 0.5703125 2.94871794
f4 Delivered goods intactly 0.39166667 4.82051282
f5 Customers can easily query 0.44615385 3.26495726
f6 Member discount service 0.29508197 2.22222222
f7 Timely processing of complaints and compensation 0.4516129 4.23931623
f8 Appropriate price 0.52554745 3.28205128
f9 High quality of service 0.47933884 3.38461538
f10 Undelivered goods free reservations seven days 0.64341085 3.27350427
[image:8.595.95.534.541.725.2]Table 11.The results of the logistics service quality detection method.
Category in IPA
Category in the fuzzy Kano model
M O A I R
Quadrant I f4f7f1 —
Quadrant II —
Quadrant III f8f10 f3 f2 —
Quadrant IV f9f5 f6 —
customers, meaning when the resources are limited, companies should improve the key logistics services quality attributes and acquire a competitive advantage. For logistics companies, three attributes, f4“Delivered goods
in-tactly”, f7 “Timely processing of complaints and compensation” and f1“Goods delivered within the specified
time”, are the most in need of improvement. Furthermore, these attributes are effective to fulfilling improving overall satisfaction. But there are no attributes located in Quadrant II. It can be inferred that the attribute which considered high in both importance and performance is nonexistent. Therefore, logistics companies need to be aware that there are still a number of services should be improved.
5. Conclusions
In resources limited situation, seeking relationship between customer satisfaction and logistics service perfor-mance is meaningful for the development of logistics companies. Therefore, it is crucial for logistics companies to understand which logistics service quality attributes can increase satisfaction, and their improving priorities to help make better decisions. Thus, the identification of logistics service quality attributes importance and their contributions on improving customer satisfaction have become more necessary to logistics companies success.
Considering traditional Kano model classification is subjective, the contribution of this study is, therefore, to integrate fuzzy Kano model with IPA model to address the shortcomings with using these two methods sepa-rately. What’s more, constructing a decision-making method can help logistics companies determine the priority of logistics service quality attributes. Also, through the use of empirical data of the case study, this study obtains the key logistics services quality attributes which are the most in need of improvement.
In spite of the fuzzy Kano and IPA model proposed in this study has higher effectiveness in decision making, some limitations still exist. First, the sample data of this study is less. Thus, future studies should include more samples to make conclusions with higher reliability. Second, the fuzzy Kano and IPA model is extremely de-pendent on the customers’ perception in making decisions. Therefore, the logistics companies’ experiences and opinions should be taken into consideration.
Acknowledgements
The authors thank the editor and the referees for carefully reading the paper. The first author (Qingliang Meng) is supported by the National Social Science Fund of China under Grant 14CGL014, Social Science Fund of MOE under Grant 11YJA630078 and China Post-Doctoral Research Fund under Grant 2013M530353.
References
[1] Meidutė-Kavaliauskienėcor0005, I.,mailto:[email protected] Aranskis, A. and Litvinenko, M. (2014) Consum-er Satisfaction with the Quality of Logistics SConsum-ervices. Procedia-Social and Behavioral Sciences, 110, 330-340. http://dx.doi.org/10.1016/j.sbspro.2013.12.877
[2] Subramanian, N., Abdulrahman, M.D. and Zhou, X.L. (2015) Reprint of “Integration of Logistics and Cloud Compu-ting Service Providers: Cost and Green Benefits in the Chinese Context”. Transportation Research Part E: Logistics and Transportation Review, 74, 81-93. http://dx.doi.org/10.1016/j.tre.2014.12.006
[3] Lee, Y.-C. and Huang, S.-Y. (2009) A New Fuzzy Concept Approach for Kano’s Model. Expert Systems with Applica-tions, 36, 4479-4484. http://dx.doi.org/10.1016/j.eswa.2008.05.034
Marketing, 2, 35-41. http://dx.doi.org/10.1108/eb024732
[5] Yang, C.-C. (2005) The Refined Kano’s Model and Its Application. Total Quality Management & Business Excellence, 16, 1127-1137.http://dx.doi.org/10.1080/14783360500235850
[6] Zadeh, L.A. (1965) Fuzzy Sets. Information and Control, 8, 338-353. http://dx.doi.org/10.1016/S0019-9958(65)90241-X
[7] Matzler, K. and Hinterhuber, H.H. (1998) How to Make Product Development Projects More Successful by Integrating Kano’s Model of Customer Satisfaction into Quality Function Deployment. Technovation, 18, 25-38.
http://dx.doi.org/10.1016/S0166-4972(97)00072-2
[8] Martilla, J.A. and James, J.C. (1977) Importance-Performance Analysis. Journal of Marketing, 41, 77-79. http://dx.doi.org/10.2307/1250495
[9] Sampson, S.E. and Showalter, M.J. (1999) The Performance-Importance Response Function: Observations and Impli-cations. The Service Industries Journal, 19, 1-25. http://dx.doi.org/10.1080/02642069900000027