Application of Fuzzy Analytic Hierarchy Method in
Software Engineering Scenario
Hota H.S.
Assistant Professor, GGV,Bilaspur (C.G.), India
Sanjay Kumar Singhai,
PhD.Associate Professor Govt. Engineering College Bilaspur
(C.G.), India
Ragini Shukla
Assistant Professor, Dr. C.V. Raman University, Kargi RoadKota, Bilaspur (C.G.), India
ABSTRACT
In software engineering scenario, software effort estimation is very uncertain and depends on various external factors .For developing a particular type of software, selection of an optimal and experienced group of developer is essential for software development organization for organizational benefits and is necessary because success and failure of software is highly depends upon experienced team members, but it is not always possible to schedule a suitable team of developer for a specific type of software development from a group of developer ,hence there should be a technique to form a group of developer for specific type of software development for cost effective reason.
In this paper multi criteria decision making (MCDM) based fuzzy analytical hierarchy process is applied for formation or selection of software developer team. Fuzzy AHP is a ranking based optimization technique, which decides ranking among various alternatives based on conflict nature of criteria. Three different criteria from COCOMO effort estimation model are considered to decide ranking of three programmers. This technique can be applied for more number of criteria and alternative in real sense in software development scenario.
Keywords
Fuzzy analytic hierarchy process (FAHP), Analytic hierarchy process, Software Engineering, COCOMO model
1.
INTRODUCTION
Most of the software fails during the development and even after development and not delivered in stipulated time period, which may creates problem for software development organization in context of their reputation and reliability in IT industry. Selection of various resources required to develop software in optimal manner is very essential to avoid all these problems. Optimal resource allocation for a specific type of software project is a challenging task to minimize the software development cost and hence to deliver software product to the client well in advance. Many resources like technical resources: hardware, software and most essentially human resources are necessary to assign in optimal manner. These resource allocation may be based on expertise or heuristic manner, which sometimes fails due to uncertainty involved, hence multi criteria decision making(MCDM) based method: Fuzzy AHP can be used for human resource allocation for a particular type of software project.
Very few literatures are available on this topic Santanu ku. Mishra)[1] and et.al has applied fuzzy AHP and byasian technique for programmer selection. However other researchers have applied fuzzy AHP method and other
MCDM methods for selection purpose. Sumeet Kaur Mishra and et.al [2] has also used MCDM approach for selection of effort estimation model based on four criteria: reliability, MMRE, percentage prediction and uncertainty for various models suggest by various scientist as alternatives. Results has been compared with AHP and it was found that algorithmic model has highest weight value as compare to other models like expert judgment based model and non algorithmic model.
This paper extends and explores the work all ready done by santanu ku. Mishra [1] and et.al.in special reference to COCOMO’s effort multiplier as criteria of programmers to be selected for forming project team. COCOMO model is one of the very popular effort estimation model based on 17 effort multipliers. These multipliers are quantitative as well qualitative, some of the multiplier are related to technical while other are related to quality of software developer. Quantitative data can be represented well using fuzzy logic, hence fuzzy logic based MCDM method[14]: Fuzzy AHP is well suited for this, Fuzzy AHP method with three different criteria of COCOMO model is considered just for demonstration purpose to select developers from a group of programmer. Work can be extended in real sense in software engineering scenario with more number of alternative and criteria.
2.
MULTICRITERIA DECISION
MAKING (MCDM) METHOD
Multi criteria decision making is a method to deal with the process of making decision among number of alternatives with conflicting criteria on them . AHP is one of the very popular MCDM method and fuzzy AHP is an extension of original AHP method suggested by saaty[12] to deal with qualitative and quantitative data. We will explain AHP first then fuzzy AHP will be explained in section 2.1 and 2.2 respectively.
2.1
Analytic
Hierarchy Process (AHP)
One of the most popular analytical techniques for complex decision-making problem is the analytic hierarchy process(AHP).Analytic Hierarchy Process (AHP) proposed by Saaty(1980,2000)[16], is an approach for decision making that involves structuring multiple choice criteria into a hierarchy, assessing the relative importance of these criteria, comparing alternatives for each criterion, and determining an overall ranking of the alternatives.
So the AHP is most highly regarded and widely used decision making method. It can efficiently deal with tangible (i.e. objective) as well as non-tangible (i.e. subjective) attributes[7].
The main procedure of AHP using the radical root method (also called the geometric mean method)is as follows[7]:-
Step 1: Determine the objective and the evaluation attributes.
Step 2: Determine the relative importance of different attributes with respect to the goal or objective.
Construct a pair-wise comparison matrix using a scale of relative importance. The judgments are entered using the fundamental scale of the analytic hierarchy process. An attribute compared with itself is always assigned the value 1, so the main diagonal entries of the pair-wise comparison matrix are all 1 and the rating as based on Saaty’s nine point scale shown in table 1.
TABLE 1: SAATY’S NINE POINT SCALE Compared to 2nd alternative,
the 1st alternative is
Numerical rating
Extremely preferred 9
Very strongly preferred 7
Strongly preferred 5
Moderately preferred 3
Intermediate judgment between two
adjacent judgment 2, 4,6,8
Assuming M attributes, the pair–wise comparison of attribute i with attribute j yields a square matrix where
denotes the comparative importance of attribute i with respect to attribute j. In the matrix =1 when i=j and =
.
Find the relative normalized weight (wj) of each attribute by -
(i) Calculating the geo metric mean of the i-th row, and
(ii) Normalizing the geo metric means of rows in the comparison matrix. This can be represented as:-
Calculate matrices A3 and A4 such that
A3=A1 A2 eq (1)
and A4= A3/A2, eq (2)
where A2=[w1,w2,…….,wi] T
.
Determine the maximum Eigen value that is the average of matrix A4.
Calculate the consistency index CI= .
Obtain the random index (RI) for the number of attributes used in decision making.
Calculate the consistency ratio CR =CI/RI. Usually, a CR of 0.1 or less is considered as acceptable and is reflects an informed judgment attributable to the knowledge of the analyst regarding the problem understudy.
Step 3: The next step is to compare the alternatives pair-wise with respect to how much better they are in satisfying each of the attributes, i.e., to ascertain how well each alternative serves each attribute.
Step 4: The next step is to obtain the overall or composite performance scores for the alternatives by multiplying the relative normalized weight (wj) of each attribute (obtain in step two) with its corresponding normalized weight value for each alternative (obtain in step three) and summing over the attributes for each alternative.
2.2
Fuzzy Analytic Hierarchy Process
(FAHP) Method:
The FAHP[13] method is an advanced analytical method which is developed from the AHP. In spite of the popularity of AHP, this method is often criticized for its inability to adequately handle the inherent uncertainty and imprecision associated with the mapping of the decision-maker’s perception to exact numbers. In FAHP method, the fuzzy comparison ratios are used to be able to tolerate vagueness [3]. There is a problem with AHP that in some situations, Decision maker wants to use the uncertainty while performing the comparisons of the alternatives. For taking uncertainties into consider ration fuzzy numbers are used instead of crisp numbers [1].
The method proposed by Chen and Hwang (1992)[7] first converts linguistic terms into fuzzy numbers and then the fuzzy numbers into crisp scores. The method is described as below-
2.2.1 Converting Linguistic terms to fuzzy
numbers
:- This method systematically converts linguistic term into their corresponding fuzzy numbers. It contains eight conversion scales. The conversion scales were proposed by synthesizing and modifying the works of Wenstop(1976), Bass and Kwakernaak(1977),Efstathiou and Rajkovic (1979),Kerre (1982) and Chen (1988).2.2.2 Converting Fuzzy Numbers to Crisp Scores
:
-The method uses a fuzzy scoring approach that is a modification of the fuzzy ranking approaches proposed by Jain(1976) and Chen(1985).The crisp score of fuzzy number ‘M’ is obtained as follows:
The fuzzy max and fuzzy min of fuzzy numbers are defined in a manner such that absolute location of fuzzy numbers can be automatically incorporated in the comparison cases. The right score of each fuzzy number Mi is defined as:-
And the left score is-
2.2.3 Demonstration of the method
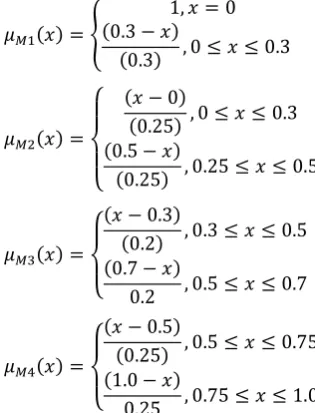
:- Now, the 5-point scale is considered to demonstrate the conversion of fuzzy number into crisp scores. To demonstrate the method, a 5-point scale having the linguistic terms like low, below average, average, above average and high as shown in figure 1 is considered.[image:3.595.39.299.167.319.2]
Figure 1:-Fuzzification of linguistic terms to fuzzy numbers conversion
TABLE 2: LINGUISTIC TERMS TO FUZZY NUMBERS CONVERSION
Linguistic Terms Fuzzy Number Low M1
Below average M2
Average M3
Above average M4
High M5
From figure 1,membership function of M1,M2,M3,M4 and M5 are written as:
The right, left and total scores are computed as follows for M1
,
Similarly, the right, left and total scores are computed for M2,M3, M4 and M5 and are tabulated in table 3 and table 4.
TABLE 3: MEMBERSHIP FUNCTION OF M1,M2,M3,M4,M5
I
1 0.23 1.0 0.115
2 0.39 0.8 0.295
3 0.58 0.59 0.495
4 0.79 0.4 0.695
5 1.0 0.23 0.895
[image:3.595.76.257.362.507.2]
TABLE 4: LINGUISTIC TERMS WITH THEIR CORRESPONDING CRISP SCORES Linguistic
Term
Fuzzy Number
Crisp Score
Low M1 0.115
Below average M2 0.295
Average M3 0.495
Above average M4 0.695
High M5 0.895
Instead of assigning arbitrary values for various attributes, this fuzzy method reflects the exact linguistic descriptions in terms of crisp scores. Hence, it gives better approximations that are widely used.
3.
SOFTWARE ENGINEERING
SCENARIO
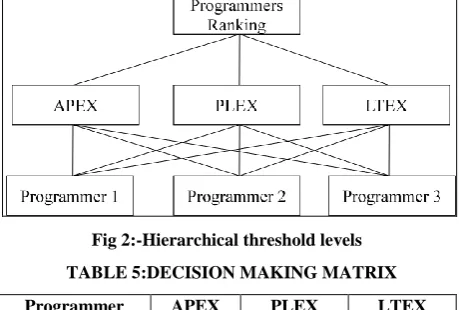
The Constructive Cost Model (COCOMO) [10] is a well known model in software engineering scenario. Which is developed by Barry W. Boehm. Effort multipliers for the COCOMO model are considered here for the selection of programmers for software development. Out of 17 multipliers 3 multipliers : APEX-Application Experience, PLEX- Platform Experience, LTEX-Language and tool experience are considered as criteria for the FAHP method[11].
Figure 2 shows hierarchy of programmer selection in which root of the hierarchy is the most general objective (Goal) of the problem such as the objective of making the best
0.3 0.5 0.7 1
0
Above average Average
Below average Low
1
[image:3.595.337.519.400.544.2] [image:3.595.52.210.553.760.2]decision or selecting the best alternative. Second level of the hierarchy consists: three effort multipliers of COCOMO model as quality of programmer while leaf level represents alternatives.
In order to apply FAHP method for programmer selection for specific software project let us follow the following steps:
[image:4.595.53.283.236.391.2]Step 1: A decision making matrix(DMM)[15] based on above criteria with three fuzzy linguistic terms as shown in fig.1 with three different alternatives is shown in table 5. Where P1,P2 and P3 represent programmer1,programmer2 programmer3 respectively.
Fig 2:-Hierarchical threshold levels
TABLE 5:DECISION MAKING MATRIX Programmer APEX PLEX LTEX
P1 High Average Average
P2 Average Low High
P3 Low High Average
Instead of 5-point scale as explained above we have considered here 3-point scale for conversion of fuzzy linguistic term into crisp scores.Here we have used only 3-point scale having the linguistic terms like low, average and high as shown in table 5.
[image:4.595.49.289.576.664.2]From the above described Chen and Hwang (1992) method :- (From table 4)
TABLE 6 : THE CONVERSION OF LINGUISTIC TERM IN TO CRISP SCORES(3 POINT SCALE):- Linguistic Term Fuzzy Number Crisp Score
Low M1 0.115
Average M3 0.495
High M5 0.895
Fuzzy linguistic term of table 5 in converted into crisp data using 3 point scale as shown in table 6 and depicted in table 7.
TABLE 7:CONVERSION OF FUZZY LINGUISTIC TERM INTO CRISP DATA
Programmers APEX PLEX LTEX P1 0.895 0.495 0.495
P2 0.495 0.115 0.895
P3 0.115 0.895 0.495
Step 2:- Now in this step we compare criteria with criteria by assigning comparative weights from Saaty’s[7] nine point scale as shown in table 1 by applying heuristic knowledge in these domain.
So the Relative Importance Matrix can be written as:-
Now calculating Geometric mean (GM) for ith row:- GM1=(1 5 3)1/3 = 2.4659 , GM2=(1/5 1 1/2)1/3 = 0.4641 and GM3=(1/3 2 1)1/3 = 0.873,
Total Geometric mean GM=3.79
Hence the Normalized weights are: W1 = 2.46/3.79 = 0.649,W2 = 0.46/3.79 = 0.121 and W3= 0.87/3.79 = 0.229
Now Consistency checking by using following equations below:
A3=A1 A2
So the A3=
=
And A4 = A3/A2
A4 =
=
And maximum value that is the average of matrix A4 will be
= 3.001
Then Consistency Index (CI) = = = 0.0005
And Consistency Ratio (CR) = = = 0.00096<0.1
Hence the weights are consistent.
Step 3:- Now alternatives will be compared with alternatives for all the three criteria known as pair-wise comparison matrix. Three pair-wise comparison matrices are shown below:-
(i) Pair wise comparison matrix for criteria APEX
Now calculating Geometric mean (GM) for ith row:- GM1=(1 0.495 0.895)1/3=0.7623
Total Geometric mean=3.05
Hence the Normalized weights are: W1 = 0.7623/3.05 =0.249, W2 = 1.2182/3.05 = 0.398 and W3= 1.0767/3.05 = 0.352
Now Consistency checking by using equations (1) and(2) as below:-
So the
A3 =
=
And A4 =
÷
=
And maximum value that is the average of matrix A4:-
= 3.044
Then CI = = = 0.022
And CR = = = 0.04<0.1
Hence the weights are consistent.
(ii)Pair wise comparison matrix for criteria PLEX
Now calculating Geometric mean (GM) for ith row:- GM1=(1 0.895 0.115)
1/3
=0.4686, GM2=(1/0.895 1 0.115)1/3=0.50464and GM3=(1/0.115 1/0.115 1)1/3 =4.2280,
Total Geometric mean=5.2012
Hence the Normalized weights are:W1 = 0.4686/5.2012=0.090, W2 = 0.50464/5.2012 = 0.0970 and W3= 4.2280/5.2012= 0.81288
Now Consistency checking by using equations (1) and (2) as below:-
So the
A3=
=
And A4 =
=
And maximum value that is the average of matrix A4 :-
= 3
Then CI = = = 0
And CR = = = 0<0.1
Hence the weights are consistent.
(iii)Pair wise comparison matrix for criteria LTEX
Now calculating Geometric mean (GM) for ith row:- GM1= (1 0.495 1)1/3=0.7910, GM2=(1/0.495 1 0.895)1/3=1.2182 and GM3=(1 1/0.895 1)1/3=1.0376,
Total Geometric mean=3.0468
Hence the Normalized weights are:-W1 = 0.7910/3.0468 = 0.2596, W2 = 1.2182/3.0468 = 0.3998 and W3= 1.0376/3.0468 = 0.3406
Now Consistency checking by using equations (1) and (2) as below:-
So the A3 =
=
And A4 =
=
And maximum value that is the average of matrix A4 :-
= 3.073
Then CI = = = 0.036
And CR = = = 0.070<0.1
Hence the weights are consistent.
Step 4:-A matrix is formed with the help of obtained weights in case of pair-wise comparison matrix for three different criteria as calculated in step 3 is :-
So the final rank can be obtain the overall or composite performance scores for the alternatives are:-
=
Deciding the rank according to the higher value of above matrix, hence ranking is P3, P2 and P1.
4.
CONCLUSION
criteria of developers .Experiment is done on sample data set with only three alternatives and three criteria and the ranking decided by FAHP method is P3,P2 and P1.In future FAHP and other fuzzy MCDM methods can be applied for all the multipliers of COCOMO model to stabilize a model for software developer selection in real sense of software engineering scenario.
5.
REFERENCES
[1] Santanu Kr.Mishra and Amitava Ray, “Software developer selection : a Holistic approach for an eclectic decision” International Journal of Computer Application, volume 47-No.1,June 2012.pp.12-18.
[2] Sumeet Kaur Sehra, Yadwinderom Singh Brar, Navdeep Kaur, “Multi Criteria Decision Making Approach for Selecting Effort Estimation Model”, International Journal of Computer Applications (0975 – 8887) Volume 39– No.1, February 2012,pp.10-17.
[3] F. Ozgur Catak, Servet Karabas,Serkan Yildirim, “Fuzzy Analytic Hierarchy Based DBMS Selection in Turkish National Identity Card management project”, IJIS vol.2,no.4,July 2012.
[4] Sanjay kumar Dubey and Prof. Ajay Rana, “Analytical Evaluation of Usability of Object Oriented Software system”,IJCA,Vol.49,No.21,July 2012,pp.7-13.
[5] Tuli Bakshi and Bijan Sarkar,”MCA Based Performance Evaluation of Project Selection”,IJSEA,Vol.2,No.2,April 2011,pp.14-22.
[6] Kevin K.F. Yuen and Henry C.W.Lau, “Software vendor selection using fuzzy analytic hierarchy process with ISO/IEC 9126”,IAENG International journal of computer science,advance online publication:21 august 2008.
[7] R.Venkata Rao, “Decision making in the manufacturing environment”, Springer-Verlag London Limited,2007.
[8] S.Mahmoodzadeh, J.Shahrabi, M.Pariazar and M.S.Zaeri, “Project Selection by Using Fuzzy AHP and TOPSIS Technique”, International journal of Human and Social Science 2:7 2007,pp.397-402.
[9] Pankaj Jalote,(2005), An Integrated Approach to Software Engineering, Narosa Publishing House.
[10]Roger S.Pressman,(2005),Software Engineering, McGraw Hill Higher Education.
[11]Darko Milicic, “Applying COCOMO II-A Case Study”, Master Thesis Software Engineering, Thesis no : MSE-2004-19,August 2004.
[12]Saaty, T. L., (2001), Decision Making with Dependence and Feedback: Analytic Network Process, RWS Publications, Pittsburgh.
[13]Zhu, K. J., Jing, Y., and Chang, D. Y., “A Discussion on Extent Analysis Method and Applications of Fuzzy-AHP”, European Journal of Operational Research, 116, 1999, pp. 450-456.
[14]Ribeiro,R.A.,(1996),”Fuzzy Multiple Criterion Decision Making: A Review and New Preference Elicitation Techniques”, Fuzzy Sets System,78,155-181.
[15]Saaty, T. L., (1994), “Fundamentals of Decision Making and Priority Theory with the Analytical Hierarchy Process”, RWS Publications, Pittsburgh