Technological University Dublin Technological University Dublin
ARROW@TU Dublin
ARROW@TU Dublin
Dissertations School of Computing
2018
Using Machine Learning Techniques to Predict a Risk Score for
Using Machine Learning Techniques to Predict a Risk Score for
New Members of a Chit Fund Group
New Members of a Chit Fund Group
Sinead AherneTechnological University Dublin
Follow this and additional works at: https://arrow.tudublin.ie/scschcomdis
Part of the Computer Sciences Commons Recommended Citation
Recommended Citation
Aherne, Sinead (2018). Using machine learning techniques to predict a risk score for new members of a chit fund group. Masters dissertation, DIT, 2018.
This Dissertation is brought to you for free and open access by the School of Computing at ARROW@TU Dublin. It has been accepted for inclusion in Dissertations by an authorized administrator of ARROW@TU Dublin. For more information, please contact
[email protected], [email protected], [email protected].
This work is licensed under a Creative Commons
Using Machine Learning Techniques to Predict a
Risk Score for New Members of a Chit Fund
Group
Sinead Aherne
A dissertation submitted in partial fulfilment of the requirements of Dublin
Institute of Technology for the degree of
M.Sc. in Computing (Data Analytics)
i
DECLARATION
I certify that this dissertation which I now submit for examination for the award of MSc in Computing (Data Analytics), is entirely my own work and has not been taken from the work of others save and to the extent that such work has been cited and acknowledged within the text of my work.
This dissertation was prepared according to the regulations for postgraduate study of the Dublin Institute of Technology and has not been submitted in whole or part for an award in any other Institute or University.
The work reported on in this dissertation conforms to the principles and requirements of the Institute’s guidelines for ethics in research.
Signed:
ii
ABSTRACT
Predicting the risk score of new and potential customers is used across the financial industry. By implementing the prediction of risk scores for their customers a chit fund company can improve the knowledge and customer understanding without relying on human knowledge. Data is collected on each customer before they have taken out credit and during the time they contribute to a chit fund. Having collected the necessary data, the company can then decide whether modelling customer risk would benefit them.
As the data is available historically, one aspect of risk score prediction will be the focus of this thesis, supervised machine learning. Supervised machine learning techniques use historic data to ‘learn a model of the relationship between a set of descriptive features and a target feature’ (Kelleher, Mac Namee, & D’Arcy, 2015). There are many supervised machine learning techniques; support vector machine (SVM), logistic regression and decision trees will be the focal point of this thesis.
The main objective of this project attempts to predict a risk score for new or potential subscribers of a chit fund company. The models generated would be suitable for use before a customer joins a chit fund group as well as while the customer is taking part in the group, measuring risk before becoming a subscriber and the behavioural risk while with the company. The objective is to extend research already carried out to predict a score from zero to one identifying the probability of default. Default, for the purpose of this project, is defined as being more than 90 days late with a payment. The data of real chit fund subscribers was used to train and test the models built for the project. A factor reduction technique was used to identify key variables, and multiple models were tested to determine which gives the best results.
The second objective of this project will look at the subscriber network. This section of the project will check for links between subscribers, and investigate a possible link between subscribers and their chance of default. Variables such as address and nominee will be the focus in this section.
iii
The most successful supervised machine learning model was the random forest model with precision of 59% and recall of 92%. Accuracy for this model was the highest of each of the models in the experiment at 85%. However, this is not the most trustworthy evaluation measure for this project as the dataset is unbalanced.
A combination of 300 decision trees were applied in this model. Using the classification method, the class that was predicted by the majority of trees was selected as the final prediction. This achieved high accuracy of the dataset from the chit fund company, Kyepot. Social network analysis found that there was no unusual relationship between subscribers that went into default with regards to the area in which they live or their nominees.
Supervised machine learning techniques have been shown to be a useful tool in the financial industry. This project suggests that these techniques may also be useful tools for chit fund companies. This project evaluates four different techniques suggesting the random forest technique is the most useful for this chit fund company.
Key words: Chit funds, credit risk, decision tree, random forest, logistic regression, support vector machines.
iv
ACKNOWLEDGMENTS
I would like to thank my supervisor Brian Leahy for the support, guidance and advice throughout this project.
Also, I would like to thank my family and friends for their support and encouragement, especially my parents John and Sadie, and my boyfriend Alan, for taking the time to proofread this project.
v
TABLE OF CONTENTS
DECLARATION ... i ABSTRACT ... ii ACKNOWLEDGMENTS ... iv TABLE OF CONTENTS ... vTABLE OF FIGURES ... viii
TABLE OF TABLES ... ix 1. INTRODUCTION ... 1 1.1 Background ... 1 1.2 Research Project ... 3 1.3 Research Objectives ... 4 1.4 Research Methodologies ... 5
1.5 Scope and Limitations ... 6
1.6 Document Outline ... 6
2. LITERATURE REVIEW AND RELATED WORK ... 8
2.1 Background ... 8
2.2 Chit Funds ... 8
2.3 Credit Risk ... 10
2.4 Data Exploration and Pre-processing ... 12
2.4.1 Class Imbalance Problem ... 13
2.4.2 Feature Reduction ... 14
2.5 Machine Learning Techniques ... 16
2.5.1 Support Vector Machines ... 17
2.5.2 Logistic Regression ... 19
2.5.3 Decision Trees ... 21
vi
2.7 Financial Sector ... 24
2.8 Conclusions ... 25
3. DESIGN AND METHODOLOGY... 27
3.1 Data ... 28 3.2 Data preprocessing ... 30 3.2.1 Dummy Variables ... 30 3.2.2 Feature Reduction ... 31 3.2.3 Sampling ... 31 3.3 Models ... 32 3.4 Evaluation ... 34
3.5 Social Network Analysis ... 35
3.6 Software ... 36
4. IMPLEMENTATION AND RESULTS ... 37
4.1 Data Understanding ... 37
4.2 Data Pre-processing ... 42
4.2.1 Feature Reduction ... 43
4.2.2 Sampling ... 45
4.3 Dataset Description ... 45
4.4 Machine Learning Models ... 46
4.4.1 Decision Tree ... 47
4.4.2 Random Forest ... 49
4.4.3 Logistic Regression ... 50
4.4.4 Support Vector Machine ... 51
4.5 Social Network Analysis ... 52
vii
5. ANALYSIS, EVALUATION AND DISCUSSION ... 55
5.1 Strengths and Limitations ... 59
6. CONCLUSION ... 61
6.1 Research Overview ... 61
6.2 Problem Definition ... 62
6.3 Design/Experimentation, Evaluation & Results ... 63
6.4 Contributions and Impact ... 64
6.5 Future Work and Recommendations... 65
7. BIBLIOGRAPHY ... 66
8. APPENDICES ... 73
viii
TABLE OF FIGURES
Figure 2.1 Phases of the CRISP-DM Process Model for Data Mining (Wirth & Hipp,
2000) ... 13
Figure 2.2 W is the hyper plane separating the two classes with maximum margin (Ye, Zhang, & Law, 2009)... 17
Figure 2.3 Logistic regression formula (Hamed, Li, Xiaoming, & Xu, 2013) ... 19
Figure 2.4 Decision Tree Diagram (Purdila & Pentiuc, 2014) ... 22
Figure 3.1 Outline of the research methodology ... 28
Figure 3.2 Dataset Overview ... 30
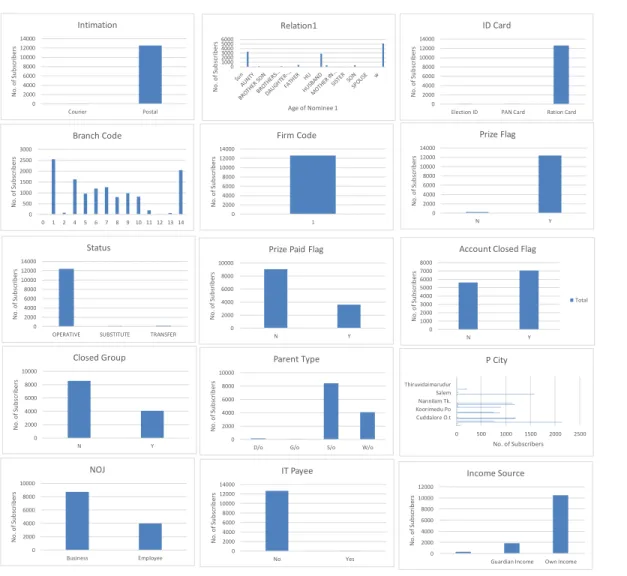
Figure 4.1 Categorical variables describing the subscribers ... 38
Figure 4.2 Numerical variables describing the subscribers ... 38
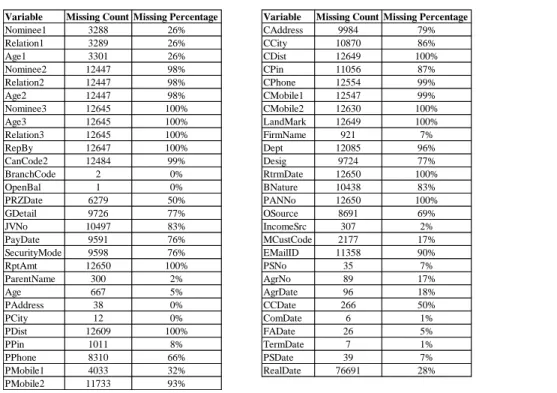
Figure 4.3 Details of Missing Values ... 40
Figure 4.4 Subscribers enrolling per year ... 40
Figure 4.5 Monthly instalment amounts paid by Subscribers ... 41
Figure 4.6 Average Annual Income... 41
Figure 4.7 Cross Validation Error ... 48
Figure 4.8 Pruned Decision Tree ... 49
Figure 4.9 Graph to select the optimal mtry value ... 50
Figure 4.10 Default Subscribers Grouped By Address ... 52
Figure 4.11 All Subscribers Grouped By Address ... 53
Figure 5.1 Receiver Operation Characteristic (ROC)... 57
Figure 5.2 Size of Decision Trees in Random Forest Model ... 57
ix
TABLE OF TABLES
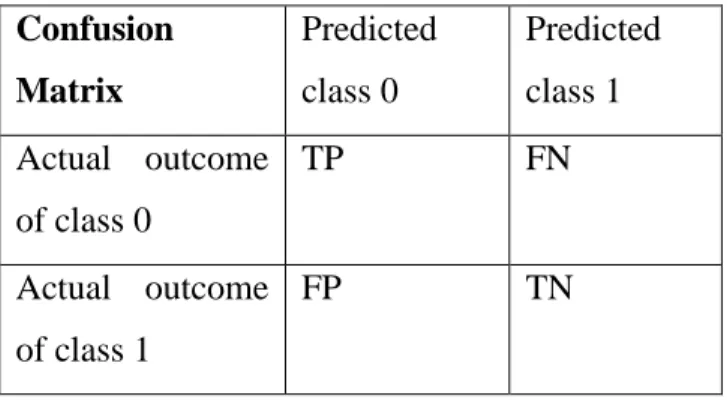
Table 3.1 Confusion Matrix ... 34
Table 4.1 Displays the number of subscribers who have ever had a payment over 90 days late... 42
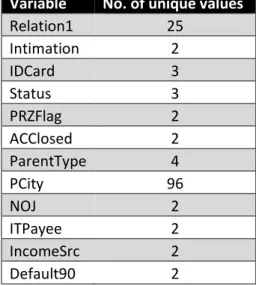
Table 4.2 Categorical Variables ... 44
Table 4.3 Final Dataset Description ... 46
Table 4.4 Decision Tree Evaluation Results... 47
Table 4.5 Pruned Decision Tree ... 48
Table 4.6 Evaluation of Tuned Random Forest Model ... 50
Table 4.7 Tuned Logistic Regression Results ... 51
Table 4.8 SVM Results ... 51
Table 4.9 Results of Supervised Machine Learning Models Built ... 53
Table 4.10 Results of Supervised Machine Learning Models Without Imputing Missing Values ... 54
Table A.1 Description of Subscriber Dataset ... 73
Table A.2 Description of Auction Dataset ... 74
Table A.3 Description of GroupDataset ... 75
Table A.4 Description of TransactionDataset ... 76
1
1.
INTRODUCTION
1.1Background
Before formal financial institutions were established in India, there was a great reliance on moneylenders to such an extent that it prompted a political commitment to introduce a structured financial industry (Tsai, 2004). The formal financial industry that was introduced in India, however, was limited to those with high incomes, and therefore those who were low risk (Tsai). This left little financial support for lower income members of the population. A recent study carried out by Mehta & Bhattacharya (2017) highlighted the fact that the support the Indian government has given to the financial sector in the country has not yet benefited the poor.
Although political moves have aimed to move towards formal finance, informal finance has not been eliminated completely. According to research carried out by Binswanger & Khandker (1995), formal finance in India expanded considerably in the 1970’s to the rural communities to provide a greater availability of credit to the poor, most of whom reside in rural India, and alleviate poverty and reduce reliance on informal finance such as moneylenders. Informal finance in India, however, comes in many forms. This thesis focuses on one type; chit funds. Chit funds are a saving and lending scheme exercised in India. An all India Credit Survey carried out in 2000 to 2001 however, has shown a rise in informal finance compared to a decline in the 1990’s (Jones, 2008). Both government supported financial solutions and non-governmental organisations such as chit funds have become more popular as a form of microfinance for the lower income community (Yusuf, 2014).
Banerjee, Ghosh, & Roy (2010) collected primary data from surveying two rural villages for their research. Socio-political and economic data was collected from each household surveyed. The research suggests that loans for non-production purposes are more difficult for villagers to obtain from formal financial institutions, therefore forcing them to fall back on informal finance solutions.
2
Chit fund organisations are currently assessing the credit risk of potential new group members manually through domain knowledge. This adds unnecessary risk to the company, as valuable employees who have developed significant knowledge and skills are liable to leave the organisation. This thesis will assess and compare the following machine learning techniques; decision trees, random forest, SVM and logistic regression. This will then lead to the identification of which technique provides the model with highest accuracy, precision, recall and specificity for the risk score prediction of a chit fund member. In turn this would alleviate the risk of employee churn, significantly damaging the domain knowledge held by the company.
The prediction of the credit risk of a potential customer has been implemented to a high standard in previous research using formal financial data. Both real world data and synthetic data have been used to build and evaluate machine learning techniques. Research by Avery, Brevoort, & Canner (2009) suggests credit scoring is widely used as a decision-making aid and has increased the availability of credit and benefits companies as they increase in efficiency.
As mentioned, credit risk scoring has been widely used in the financial industry, but risk scoring has also been used in other sectors. The health sector is one example of this. Mehran et al. (2010) used logistic regression in their research to predict the risk of major bleeding in patients with acute coronary syndromes. Another area of research using similar supervised machine learning models is that of customer churn prediction. Milošević, Živić, & Andjelković, (2017) used similar techniques such as logistic regression, random forest and decision trees also in their research to predict the customer churn.
Social network analysis will also be carried out on the chit fund data. The relationships between customers and their likelihood to go into default will be analysed. Using a bipartite network, the relationships between subscribers can be visualised. This will allow the credit risk score to be looked at by means of connections. A bipartite network contains two sets of vertices representing different features; there is no connection between vertices of the same type only between those of different type. Similar to research by Godlewski, Sanditov, &
3
Burger-Helmchen (2012) which focused on another bank loan network, the network would provide further insight into the subscribers of the chit fund company.
1.2Research Project
Supervised machine learning techniques have been used in many credit scoring problems in the past with SVM techniques seen to be one of the most common in credit risk prediction. Trustorff, Konrad, & Leker (2011) suggested that SVM outperforms logistic regression. While Chen, Härdle, & Moro (2011) also found that the SVM method is best for forecasting default probabilities, they also discovered that it does not offer much understanding or significant insight into the data. Other research suggests that both logistic regression and SVM perform better than other models such as neural networks and C.45 decision tree (Perols, 2011). Based on the previous literature in this area and for reasons mentioned further on in this section, four supervised machine learning techniques will be compared when aiming to predict credit risk, the four techniques are decision tree, random forest, logistic regression and SVM.
Currently a risk score for a chit fund member is assessed manually. To automate this process, four supervised machine learning techniques have been chosen to test their predictive power in relation to this credit risk problem. Decision tree was selected as a base line model. The decision tree can identify the importance of variables or how informative the variables are as predictors and clearly shows the process in how the prediction was made (Kelleher, Mac Namee, & D’Arcy, p. 122). Random forest was then chosen as a natural follower of the decision tree. It is assumed the random forest will generate a better result than that of the decision tree technique as many decision trees will be implemented in the random forest model. As seen in research by Sharma (2011) the random forest technique out performed logistic regression when predicting a credit risk score. Logistic regression has been shown to be powerful in previous research and still has a level of transparency (Peng, Wang, Kou, & Shi, 2011). SVM is commonly used and has been a successful model in previous studies (Chen, Härdle and Moro) (Boyacioglu, Kara and Baykan).
4
Social network analysis will be carried out to ascertain if there are any unseen connections between the subscribers of the chit fund company who have gone into default during the period of the chit fund. Subscribers will be grouped in terms of residential area, gender and chit amount.
The research question asks Which supervised machine learning technique; decision tree,
random forest, logistic regression or support vector machine; can best predict the risk score of a chit fund member with best accuracy, precision, recall and specificity?
1.3Research Objectives
The main objective of this project is to identify the model that best predicts the risk of potential chit fund members as they apply to become part of a chit fund. While carrying out this research, it is expected that further insight into the factors that affect the risk score of a customer will be gained. Eliminating the need for complete manual assessment of new chit fund members would prove beneficial for both customers and the company providing the data for this project. The process would become more efficient, providing an answer for the customer much sooner.
To complete this project, firstly a review of the research previously carried out in this area will be undertaken. Data exploration will then be carried out on the data received from the Indian chit fund company. This will involve joining the data, as it currently stands, it is in five separate tables with common identifiers, cleaning the data and implementing a feature reduction technique as there are over 100 attributes in the chit fund data. Each supervised machine learning model will be trained using 66% of the dataset. The models will be tested using the remaining 34% of the dataset. This same split has been used in previous research by Yang (2007), Kruppa, Schwarz, Arminger, & Ziegler (2013) and Boyacioglu, Kara, & Baykan.
Evaluation will be performed on each model calculating the accuracy, precision, recall and specificity rates. A Receiver Operating Characteristic (ROC) curve for each model will also be evaluated. Selecting the model with highest overall predictive power as the most
5
valuable, a conclusion will be made, and the hypothesis will be evaluated. Finally, the limitations and further areas of research will be identified and listed.
A second stream of analysis will be carried out to identify relationships between the subscribers of the chit fund. This will aim to further explain some of the reasons the subscribers may go into default. Some relationships among subscribers may not be visible from examining machine learning models. Social network analysis will aim to uncover relationships between the subscribers who have had a late or missing payment previously.
1.4Research Methodologies
The project aims to answer the research question listed in section 1.2.
Secondary research will be carried out using historic data from an Indian chit fund company. Quantitative methods, an experiment, will be designed and carried out and used to evaluate the hypothesis. The Cross-Industry Standard Process for Data Mining (CRISP-DM) process will be followed throughout the experiment. Machine learning algorithms will be used to build supervised machine learning models to predict a credit score for members of a chit fund group. The research carried out will be empirical research, involving testing the hypothesis with an experiment. The aim of the research is to carry out an experiment to identify the model that best predicts the risk score of chit fund members. Deductive reasoning will be used in this research.
The theory that SVM will have the highest accuracy rate has evolved from the literature review. The hypothesis is based on this theory. Each model will be created and evaluated by calculating four evaluation measures, accuracy, precision, recall and specificity. The ROC curve will also be used for the evaluation of the models. The results will be compared and the model with the highest predictive power will be selected as the ‘best’ model.
6 1.5Scope and Limitations
The scope of this research is machine learning techniques predicting a credit risk score for members of a chit fund in India. One limitation of the project is the data, which is provided from one chit fund company only, and contains a subset of their customer base. This may not be representative of other chit fund companies.
As the dataset is provided by one sole chit fund company, it is possible that other chit fund companies and other informal financial companies would have a very different customer base and therefore the research carried out on the data provided by this chit fund company would not be at all representative of other chit fund companies.
1.6Document Outline
This section outlines the thesis document.
Chapter Two discusses the literature related to predicting the risk score of customers. As supervised machine learning techniques have previously been used to predict this risk, chapter two reviews and compares previous work done in this area. It describes the use of SVM, logistic regression, decision tree and random forest in previous work, the advantages and disadvantages of each technique, and discusses what was suggested as the most valuable technique. Previous works are also compared against this project and the data available. It also looks at research carried out on the financial sector in India and the part chit funds have to play in it. This chapter also discusses the use of social network analysis research previously carried out on financial data.
Chapter Three describes how the dataset was prepared and cleaned and how the experiment was carried out and methodology used to evaluate the experiment. The software used throughout the experiment is listed and the evaluation techniques that were used are also discussed.
7
Chapter Four discusses the implementation and results of the experiment. The data pre-processing and exploration that was carried out along with the experiment is included. The hypothesis of the project is considered, and results of the experiment are compared to evaluate the hypothesis.
Chapter Five analyses the techniques used in the experiment and data pre-processing including the feature reduction technique. The variables used in each model are described and the results gathered from each model are evaluated and compared.
Chapter Six is the final chapter containing the conclusions of the thesis, a summary of the work undertaken and discussions of future work that may be carried out.
8
2.
LITERATURE REVIEW AND RELATED WORK
2.1Background
In the financial sector, understanding the potential risk of a possible new customer can be a powerful tool and can enable a company to make informed choices before funding a loan to a new customer. Many previous papers have highlighted advantages and disadvantages of different machine learning techniques which have been tested in relation to this potential risk. In work carried out by Crook, Edelman, & Thomas (2007), a review was executed on different credit scoring techniques. This paper noted that risk assessment is common for a financial institution before and during a loan. The paper concluded that the most frequent classifier used was logistic regression although many other techniques had been tested. However, in research carried out by Boyacioglu, Kara and Baykan, SVM outperformed other techniques evaluated and Twala (2010) found that decision trees and ensemble methods also provide a high accuracy measure.
2.2Chit Funds
Chit funds are Indian saving and lending companies. They offer a saving scheme where members of a group pay equal monthly instalments to a pool. Each month the pool of money is won by one group member. They are based in India and often provide finance to the rural communities in India. Chit funds for the purpose of this study are conducted by a company called Kyepot.
In research by Satish (2001) the main use of chit funds is described as providing subscribers benefits from a monthly pool of money. They are described as being flexible with the terms of each chit fund group; the amount of the monthly instalment varies with the affordability each member of the group has. It is also mentioned that the groups tend to have a large number of subscribers which would in turn provide a large lump sum each month, but again this is flexible. It has been noted that members of a chit fund group integrate more freely into the self-help groups set up by rural bank managers, as the act of monthly saving has already been established and become normal for the members.
9
Santhisree & Prasad (2014) suggests that there are approximately 30,000 registered chit fund companies throughout India. Their research suggests that chit funds typically provide credit for the middle-income demographic. However, recently this has changed, and the companies now cater for the lower-income demographic. Chit funds supply credit to members of the community who are unable to secure credit from banks. This research identifies a number of problems faced by chit fund companies. One such problem is the lack of regulation of business. There is a high proportion of chit fund companies that are unregistered, which creates unhealthy competition for the registered companies. Another issue identified in the research carried out by Santhisree & Prasad was that the unregistered companies can pay-out funds to subscribers much quicker than the registered companies (immediately, compared to 15 to 30 days for registered companies). This indicates a need for a quicker decision-making process in registered chit fund companies.
Tsai (2009) suggests in their research that informal finance has existed for many years and this may have been as a result of the lack of formal finance in some parts of India, especially rural India. The paper states that although good intentions of bringing formal finance to all of India was present in the 1950’s, this was not completely successful therefore leaving a gap for the informal financial industry such as chit funds to continue to operate. The formal financial institutions that did operate throughout India did not reach all rural areas. There are many types of informal finance mentioned in the research carried out by Tsai. In it, chit fund companies are described as ‘Rotating savings and credit organizations (ROSCAs)–– indigenously organized savings and credit groups’. Tsai concludes that informal finance does not necessarily out-do formal finance but for those out of reach of formal finance, it is an imperfect substitution.
In a study carried out by Yusuf, the use of rural finance to alleviate poverty is the focus. It is noted that the majority of the poor in India live in rural areas. It has been found that the agricultural sector in India is growing and keeping up with the increasing food demands. The access to finance for these small entrepreneurs is most efficient by way of microfinance services. Access to formal finance, as mentioned by Yusuf, is costly. The people from the rural areas of India are seeking alternative ways to invest and save. Chit funds is one of the solutions found. As mentioned by Tsai and again by Yusuf the inability of the banking
10
institutions to provide their service to the rural areas of India has increased the dependency on microfinance.
Research by Rao & Buteau (2018) suggests that the structure of chit fund groups is similar to that of formal banking, and that by using the service to save and access credit, the chit fund is carrying out the same purpose as formal financial institutions. Due to these similarities it was suggested that chit funds face a similar level of credit risk as modern banking. Rao & Buteau use the regression technique to predict chit fund subscribers behaviour and found that the model may assist manual decision-making. The research did not aim to create a model to eliminate the manual decision-making step in the process of accepting a new subscriber. The research highlighted the fact that the data required to build a predictive model must be of high quality, and this was not found to be the case for the dataset used in Rao & Buteau’s research.
2.3Credit Risk
Credit risk score is a powerful tool used by many financial institutions as an extra check of credit worthiness of a potential borrower and as a method of managing current customers (Avery, Brevoort, & Canner. Credit risk scoring is carried out using a statistical model that aims to predict the likelihood of an account going into default. It was also noted in research by Xanthopoulos & Nakas (2007) that credit scoring now not only covers a customer’s risk of default at application, but can be monitored throughout the loan duration. Credit risk can improve the decision-making process by enabling a faster turnover of decisions and reducing the risk of manual error (Dahiya, Handa, & Singh, 2015). As mentioned in research by Santhisree & Prasad, credit risk scoring may improve the turnaround time for a decision when applying for credit. They found that registered chit fund companies had been losing out on potential customers, due to the length of time it took the company to decide if the potential subscriber was credit worthy. Once again, the importance of credit scoring is mentioned in work by Sohn & Kim, (2012). Their research consisted of examining the use of decision trees for credit scoring, and found that the decision tree technique provided a
11
higher accuracy than that found in previous research on the same dataset using logistic regression.
Avery, Brevoort, & Canner examined the effect of demographic data on a borrower’s credit risk score and its influence on the borrower’s access to credit, suggesting that the demographic data had an effect on the overall credit score given to an individual. Age was one of the demographic variables seen to affect credit score; in particular a younger subscriber was seen to be given a lower credit risk score. It was suggested in this study that credit scoring increases a person’s access to credit. It also increases efficiency for the financial institution and reduces the likelihood of a staff member being biased towards a personal characteristic of the potential customer. This study found that the credit risk score was a good indication of whether a borrower would go into default during the loan term. As the credit risk score decreased the percentage of bad rate increased.
Dahiya, Handa, & Singh also used demographic data in their research when building classifiers to implement credit scoring. The research examined the use of ensemble classifiers in credit risk scoring. By using several classification techniques, it was found that the ensemble method outperformed the single use of each of the classification techniques tested. The research suggests using ensemble classifiers as the credit score model would be advantageous to a company, improving and reducing time on decision making.
Edelman (2008) noted in his study, similar to Avery, Brevoort, & Canner, that credit scoring is used worldwide. It is used both for potential new borrowers and in behavioural scoring to manage existing customers. In research by Edelman, it was suggested that credit scoring is used not only in the application for credit, but can also be used in marketing to understand
the likelihood of a response to different marketing campaigns.
Carling, Jacobson, Lindé, & Roszbach (2007) suggest in their research that macroeconomic variables have a strong predictive power when building a model to predict credit risk. Using credit application data from a Swedish bank and data from the credit bureau, it was found that the risk of default was considerably higher for a loan with a short term compared to a loan over a longer term. They suggested that taking macro conditions into account in the models built helps to better predict the risk of default of firms.
12
Research carried out by Yap, Ong, & Husain, (2011) focuses on the use of credit scoring models to improve credit assessment techniques. Their research notes the usefulness of credit scoring in the financial industry aiding the decision-making process. The data used in this research was not as highly unbalanced as seen in other research in this area, 35% of the dataset consisted of defaulters. After comparing regression and decision tree as two techniques for credit scoring it was found that there was no clear ‘best’ model. However, each had advantages and disadvantages. As the decision tree is easily understood, it was concluded that this technique would be chosen as the ‘best’ model. Also noted in this research was the data quality issues in the dataset, which may make the results of the supervised machine learning models build unreliable. Poor data quality is a common issue found in credit scoring research.
Many different credit risk models have been evaluated in previous research. Some of the machine learning techniques that have been used are described in more detail further in this chapter. In the previous research described, the advantages of credit risk scoring in formal financial institutions have been listed. Due to the similar structure of chit funds to formal finance, as mentioned in research by Rao & Buteau, it suggests that same advantages may be found if credit risk scoring was implemented in chit fund companies.
2.4Data Exploration and Pre-processing
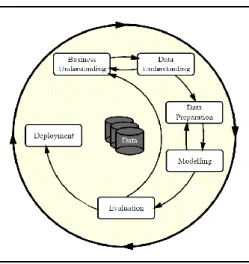
To gain further understanding of the business problem, data exploration is required. The CRISP-DM methodology has been widely accepted as a methodology that can be followed in machine learning and data mining research. The CRISP-DM methodology ‘provides an overview of the life cycle of a data mining project’ (Wirth & Hipp, 2000).
13
Wirth & Hipp go on to suggest that this model is a valuable tool in planning and documentation, following the model allowed for open communication and structured documentation of the work carried out. To enable the project to be repeated, the CRISP-DM model was deemed useful by Wirth & Hipp.
Data pre-processing, prior to fitting a machine learning model, is vital to improving the performance of the model. Pre-processing the data can improve the quality of the data, and therefore, the accuracy of the models will increase. Much of real world data collected will contain some inaccuracies or ‘bad’ data, so when relying on the quality of the data, this step proves very important.
2.4.1 Class Imbalance Problem
As seen in research by Maheshwari, Jain, & Jadon (2017) class imbalance within a dataset has become a challenge in data mining. This is a common problem within the risk score prediction area. As expected, a small number of cases in a financial institution default when compared to those who don’t, thus creating an unbalanced class.
One approach to deal with this is sampling the data. Under sampling and over sampling are two techniques analysed in the research undertaken by Maheshwari, Jain, & Jadon; under
14
sampling the dataset risks excluding valuable data from the dataset, while over-sampling carried the risk of overfitting the model. Another sampling method suggested by Farquad & Bose (2012) is Synthetic Minority Over-sampling Technique (SMOTE). After comparing under sampling, over sampling and SMOTE techniques, it was concluded that the SMOTE technique yielded the best results for SVM, logistic regression, multi-layer perception and random forest. SMOTE creates synthetic instances based on data provided to even up the class imbalance within the dataset, while other research suggests over-sampling is a valid and worthwhile method to significantly improve the performance of learning algorithms (Sáez, Krawczyk, & Woźniak, 2016).
Daskalaki, Kopanas, & Avouris (2006) focus their research on evaluating classifiers with an unbalanced class dataset. Their research found that an unbalanced class dataset when used with a classification algorithm may seem like the algorithm performed with a high accuracy, but at closer analysis it can be seen that all the minority class cases achieved zero accuracy. Maheshwari, Jain, & Jadon also found that accuracy is no longer the proper measure when an unbalanced dataset is in use. It is suggested that, rather than evaluating a model on accuracy alone to separately monitor true positive and true negative rates, the class distribution of the training dataset was said to influence the performance of a model (Daskalaki, Kopanas, & Avouris).
Brown & Mues (2012) carried out research to evaluate different classification algorithms when used on imbalanced datasets. Using real world datasets, ten classification techniques were compared. It was found that random forest outperformed the other techniques tested.
2.4.2 Feature Reduction
‘Feature selection is the most basic step in data processing’ (Van-Sang & Ha-Nam, 2016). It has been noted in previous research that feature selection can be a valuable step in credit risk prediction (Tsai). Feature selection helps to ‘reduce the number of descriptive features in a dataset to just the subset that is most useful’ (Kelleher, Mac Namee, & D’Arcy, p.230). Not all features within a dataset will contain any predictive power. Limiting the dataset to the most valuable and useful features can reduce the expense and computing time of an algorithm. There are many feature selection techniques, one such technique is to rank and
15
prune the features, which involves ranking each feature on their usefulness to predict the outcome variable and select the features with highest ranking.
Another feature selection method is Principal Component Analysis (PCA). This is an unsupervised feature selection technique. PCA reduces features, while retaining majority of value within the original dataset. This method has been shown to improve results of classification models (Doumpos & Zopounidis, 2007). Doumpos & Zopounidis carried out research on credit risk assessment with model combinations. One of the three datasets used in their experiment was unbalanced with 218 out of 1,193 firms classed as being in default. This is seen in many finance datasets. The unbalanced default class is expected. Using PCA in this experiment, it was noted that all variables with even a small predictive power should be kept in the dataset. Depending on the dataset, this result may not improve the feature selection problem in a project. PCA was also chosen as a pre-processing method in research by Boyacioglu, Kara, & Baykan. This work used machine learning techniques to predict bank financial failures. PCA was the tool used on the twenty financial ratios, and a threshold of 70% variance was set. The selected variables must explain at least 70% of the variance. Seven out of twenty factors were retained showing the feature reduction possibilities using PCA.
In a study by Huang et al. (2016), a number of data pre-processing methods such as feature selection and instance selection, with and without imputing missing values, were compared. From this analysis, it was concluded that for the datasets in the research, a classification model performs best when the data pre-processing using feature selection does not include imputing the missing values. Huang et al. granted a 10% or below missing value rate to allow a variable to be included in the experiment. However, in work carried out by Kelleher, Mac Namee, & D’Arcy (p. 73) a 60% missing value rate is noted. With real world data and the data quality issues throughout the data collection and storage process, the 60% rate seems more accessible than the significantly lower rate of 10% in this experiment. Instance selection was also tested during this experiment. Removing instances similar to under sampling would increase the risk of excluding valuable information from the models.
16
Van-Sang & Ha-Nam carry out both Wrapper methods and Filter methods on credit approval data from Germany and Australia. In Wrapper feature selection, each subset of features is evaluated, and the best subset of features is selected. Once the subset of features has been selected, then the classifier is tested on the test data. The Filter method selects features based on their ability to predict the target variable. The datasets used in the experiment were both relatively small in size containing just under 1,700 applications when combined. The research aimed to reduce the number of attributes used in the models, saving time and improving accuracy rates while maintaining the integrity of the data. Similarly, in research carried out by Feki, Ishak, & Feki (2012), the Wrapper method was analysed using both simulated and real-world data. Li & Sun (2011) also focus on the Wrapper technique in their research, specifically the forward feature selection method. This was carried out by ranking the data and using forward selection of features. This was found to be helpful in the research as the other option of using domain knowledge to select the best features for the model was too time consuming and expensive for the research.
Another feature selection technique that has been used in credit risk prediction is to examine the correlation between independent features in the dataset. This filter feature selection technique begins by selecting the threshold of correlation that will be allowed between features. This is mentioned in research carried out by Yu & Liu (2003), where they state that the ‘goodness’ measure must be defined. The correlation between pairs of features will be compared to the threshold to decide if a feature would be redundant in a model. This feature selection method, they found, is efficient and effective when dealing with a dataset with a large number of features.
2.5Machine Learning Techniques
A number of machine learning techniques have previously been used in similar credit risk prediction problems.
17 2.5.1 Support Vector Machines
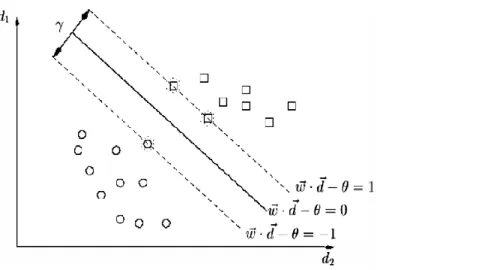
SVMs have been a common technique used in previous risk score research. The SVM technique is a supervised machine learning technique. ‘Support Vector Machines (SVMs) transform the input vectors nonlinearly into a high-dimensional feature space through a kernel function so that the data can be separated by linear models.’ (Ribeiro, Silva, Chen, Vieira, & Carvalho das Neves, 2012).
Figure 2.2 W is the hyper plane separating the two classes with maximum margin (Ye, Zhang, & Law, 2009)
It has been seen in previous research that SVMs tend to perform with the highest accuracy when compared with other models (Chen, Härdle and Moro) (Boyacioglu, Kara and Baykan).
Ribeiro, Silva, Chen, Vieira, & Carvalho das Neves focused on models which are large margin classifiers. The research focused on the SVM technique and compared four models all including an SVM technique. It was concluded that SVMs provide highly accurate results when used on financial datasets. This study could be enhanced by allowing the same dataset to be tested on other highly regarded machine learning techniques, such as logistic regression.
Chen, Härdle and Moro suggest in their research that SVMs provide high accuracy and low misclassification errors when predicting risk scores. Their research is based on real-world
18
data with a dataset containing 21,000 cases. Comparing SVM and logit models, the training data used was sampled from the data between 1997 and 1999, while the validation dataset was sampled from the 2000 to 2002 data. There is a risk that this training dataset may not be representative of the whole dataset. Financial datasets vary from year to year, going through highs and lows in the economic world. This may hinder the models’ ability to perform accurately on more recent data.
Similarly, Boyacioglu, Kara and Baykan found that SVMs outperformed other techniques such as neural networks. However, in this research the training and validation datasets are divided using stratified sampling from the entire dataset. This creates a higher chance of the sample being representative of the entire dataset. Comparing artificial neural networks, SVMs and statistical methods, it was found that SVMs and learning vector quantization (LVQ) provided satisfying prediction results. LVQ is a classification algorithm, that can be trained as supervised or unsupervised, supervised for obtaining classifiers and unsupervised to identify clusters (Nova & Estévez, 2014).
A paper by Trustorff, Konrad and Leker considered two techniques for predicting credit risk score, least-squares SVMs and logistic regression. Using the ROC curve, it was found that SVMs surpass logistic regression when the sample is small. The ROC curve plots the false positive rates versus true positive rates and provides a visual where comparing various machine learning models is quick and easy. The dataset consisted of 31,049 instances. This is a much larger sample than that used in the research by Boyacioglu, Kara and Baykan. Trustorff, Konrad and Leker found that logistic regression models performance was affected more than the performance of the SVM.
Ye, Zhang & Law used the SVM technique to classify the sentiments of online customer reviews, while comparing this technique to Naïve Bayes algorithms. It was concluded that the SVM technique outperformed Naïve Bayes. To evaluate the machine learning models the common measures of recall, precision and accuracy were calculated from the contingency table. The recall measure is calculated by taking the number of true positive cases divided by the total number of actual true cases. The number of true positive cases relates to the number of instances in the positive class the model predicted correctly. The
19
number of actual true cases relates to the number of instances in the class; this information in known from the dataset. Precision is calculated by dividing the number of true positive cases by the total number of positively predicted cases. Accuracy is calculated by dividing the number of correct predictions by the total number of predictions made. The ROC curve may aid the evaluation of some machine learning algorithms also. This tool was not used in this research.
2.5.2 Logistic Regression
Logistic regression has also been found to be a favourable technique in credit risk
prediction. The formula in figure 2.3 below represents logistic regression where 𝑝𝑖is the
probability and 𝑥𝑖is the independent variables which predict the outcome 𝑝𝑖.
Figure 2.3 Logistic regression formula (Hamed, Li, Xiaoming, & Xu, 2013)
In a study on classification algorithms for financial risk prediction, it was found that linear logistic regression was ranked in the top three classifiers of the machine learning models (Peng, Wang, Kou, & Shi). Using six real-world datasets from six countries, Peng, Wang, Kou, & Shi evaluated many machine learning techniques. It was found that linear logistic regression was among the top three classifiers. It is suggested in the research that evaluating a classification model based on one or two measures is not reliable. One measure may suggest a certain model is the most useful where another measure may select another model. The process model followed in the research is similar to the CRISP-DM cycle. However, it also follows some of the Knowledge Discovery in Database process.
Zaghdoudi (2013) aimed to predict bank failures using binary logistic regression. Data regarding fourteen Tunisian banks are used for this study. From the eighteen factors provided, seven were selected for use in the model. It was found that using stepwise regression with these seven factors provided satisfactory results.
20
Zekić-Sušac et al. (2016) evaluated both logistic regression and neural networks when predicting company growth. There was a large number of factors in the Croatian company dataset, so factor analysis was performed to remove the redundant factors. The dataset was split into two datasets; 87.13% training and 12.87% test datasets. Compared to work by Boyacioglu, Kara, & Baykan (2009) using 66% of the dataset as training and Smeureanu, Ruxanda, & Badea (2013) using 60% of the dataset as training with the neural network technique and 80% with SMV, including over 80% of the dataset in the training set is unusual. Some further analysis with different training to test splits may have been beneficial. In a study by Hamed, Li, Xiaoming & Xu, kernel logistic regression was used to classify videos, using this machine learning technique along with the feature reduction method of PCA to find the most valuable factors. Dealing with a large amount of data in visual data PCA was chosen as one of the reduction techniques in this research. The features were scaled to values from 0 to 1. This eliminates the risk of features with higher values dominating other features, and therefore creating bias within the model. A number of evaluation measures were used to evaluate the models. This is in line with what was suggested in research by Peng, Wang, Kou, & Shi, which allowed the models to be fairly evaluated on more than one measure. It concluded that the logistic regression technique resulted in adequate results and was easy to put in place.
Perols analysed the use of machine learning algorithms to detect fraud. This is another common problem in the financial industry and machine learning can be used in the same way as it is in credit risk prediction. Examining a number of features may help to detect fraud. Perols evaluated the performance of classification algorithms using 42 possible predicters. Ten-fold cross validation was used, ensuring data used in training was not used in testing. Ten-fold cross validation is a technique used to assess models. It was found in this research that logistic regression and SVM perform well in detecting fraud. Similar to Feki, Ishak, & Feki and Li & Sun, this research uses a wrapper method to select the features for each classifier.
Butera & Faff (2006) chose to evaluate the logistic model while developing a credit rating for private firms. As mentioned in the research, the logistic model does not require normality
21
of data. It was concluded that the bottom up approach to the probability of default (PD) rate was beneficial in gaining the historical PD rate. However the top down approach was valuable to obtain the credit risk assessment bases on the following year’s outlook.
Kruppa, Schwarz, Arminger, & Ziegler suggest that ‘Default probabilities provide more detailed information about the creditworthiness of consumers, and they are usually estimated by logistic regression’. The research carried out estimates a customers’ credit risk using machine learning methods with logistic regression. The data used was not from a financial company, instead it was from a retailer offering credit on their products. Due to an increasing amount of bad debt, the company had to review their processes. No credit scoring had been previously done on the data provided by the company, and all instances in the dataset had been accepted for instalment purchase. The dependant variable of default was derived from the dataset. Some of the data was qualitative, increasing the risk that the sentiment may not have been interpreted correctly. Evaluation of the learning algorithms was carried out by creating a confusion matrix from the results. The research found that random forest outperformed a tuned logistic regression model.
2.5.3 Decision Trees
Decision trees are a common supervised machine learning technique, often used, as it provides insight into how the model made the decision. In a tree like structure the model begins with a root node and answers a series of questions to flow down the tree to a decision (leaf node). Figure 2.4 below shows a decision tree where t represents the variable tested at that node, x represents one possible feature level the variable can take, and C represents the leaf nodes and therefore the decision.
22
Figure 2.4 Decision Tree Diagram (Purdila & Pentiuc, 2014)
Khandani, Kim and Lo (2010) used supervised machine learning to predict consumer credit risk. Using both account level transactional data, and data from the credit bureau, they aimed to reduce total default losses by 6 to 25%. It was suggested that integrating the credit bureau data with the transactional data for each customer provided more up to date details of the customers than the data that would have been sourced easily from the financial institution. As well as truncation and credit bureau data, the account balance was also integrated. A rich dataset was collected to carry out this research. Similar to Chen, Härdle and Moro, Khandani, Kim and Lo also split the training and test datasets by date. However, this approach was carried out ten times, and evaluation was then carried out on each of the ten training periods. Using generalized classification and regression trees, they found that they reached an accuracy of 85%.
Some research suggests that instance-based learning will achieve highest accuracy levels. Yang concludes that kernel learning provides better results in comparison with traditional credit scoring methods when there are many attributes and unbalanced class distributions in the data set. Yang notes that logistic regression, a traditional approach to credit scoring, needs to be built from scratch when a change is made to data or the population. With 102 factors in the dataset used for this experiment, there was no feature reduction applied. This technique will not favour the logistic regression technique.
23
However, in research carried out by Twala, it was suggested that the instance-based machine learning technique, k-nearest neighbour, was not achieving the highest accuracy. Instead, ensemble methods such as decision trees were found to have a high accuracy rate. Twala used four credit datasets; these datasets had much fewer features than that seen in the dataset used by Yang. Twala’s datasets had at most 20 features. Considering noise in the data, it was found that the decision tree model achieved the highest accuracy. The decision tree was also considered one of the most accurate techniques when evaluating ensemble models. Following on from the decision tree technique, it has been found in research by Sharma that the random forest technique has outperformed the logistic regression technique. Random Forest contains a group of decision trees. Combining decision trees, the random forest makes a classification prediction based on the majority vote. In a regression problem, the random forest prediction is the mean prediction of all decision trees in the model.
The random forest technique was also suggested to be the best performing model in research by Barboza, Kimura, & Altman (2017) when predicting bankruptcy. Their research used financial data and models that were built without normalising the data. It was found, similar to research by Sharma, that the random forest technique outperformed the logistic regression technique. Barboza, Kimura, & Altman used an unbalanced dataset in their research, and therefore the evaluation measures used were chosen to avoid bias in evaluation. Sensitivity and specificity were both used to evaluate the models. These measures were calculated from a confusion matrix.
The advantages of random forest listed in the research are plentiful. The model is unlikely to overfit the data, as each decision tree is built with samples of the data. The user is able to clearly see the importance and the use of the variables.
2.6 Social Network Analysis
Social network analysis evaluates and analyses the connections between certain features. It aims ‘to predict the structure of relationships among social entities’ (Butts, 2008). Nodes represent the social entities, and edges represent the relationships. Social network analysis is often carried out with regards to trust connections.
24
Godlewski, Sanditov, & Burger-Helmchen found, when analysing a bank loan network that syndicated bank loans have the ‘small world’ network properties with a short distance between them and high density in the network. The bipartite network consisted of banks that participated in syndicated loans and the events of a syndicated loan. A projection of the bipartite network was carried out to construct a network of lenders. The network was analysed as it changed over time, and it was noted that there were very few isolated nodes in each timeframe. It is suggested that small world networks improve efficiency, and betweenness centrality plays an important role for borrowing costs reductions.
Agarwal, Chomsisengphet, & Liu (2011) use social network analysis in their research on estimating the likelihood of borrowers going into default or becoming bankrupt. It was suggested that some characteristics found in a social network are related to borrower bankruptcy. It was found that a borrower is more likely to declare bankruptcy if they have moved out of the state where they were born.
2.7Financial Sector
The machine learning techniques mentioned in this thesis have also been used in other financial sector projects. Endeavouring to predict fraud is also a common task within the financial sector. Many papers also use the support vector machine and logistic regression technique to detect fraud in the financial sector. Similar to the techniques tested in this experiment, Perols used both logistic regression and support vector machines to detect fraud and found both techniques to perform adequately.
Similarly Whiting, Hansen, McDonald, Albrecht, & Albrecht, (2012) used machine learning techniques to detect management fraud, finding ensemble methods to be powerful predictors in this area. Random forest is one example of the ensemble method examined. It was found that the random forest technique was one of the techniques which provided the highest accuracy. As seen in many datasets in this area of research, the dataset used in this research contains highly unbalanced classes. The solution found was to undersample the majority class and oversample the minority class.
25
Butaru et al. (2016) carried out research on the risk management of the credit card industry, aiming to use machine learning techniques to predict delinquency. Using data from six banks, analysis was also carried out on the value of each model across all six banks, the research suggests that the models are most valuable when used on the data from the bank from which they were trained, suggesting that once a supervised machine learning model was built for one financial institution, it would not be acceptable to use the same learning model in another institution.
As mentioned, research has been carried out on credit risk prediction in previous papers. However, research with regards to the risk score of a member of an informal financial group has not been completed fully. Previous research papers have examined the use of chit funds in a rural community (Tsai) (Yusuf). However, research has not been carried out for the prediction of a risk score for the use of chit fund organisations.
2.8Conclusions
In this chapter data pre-processing methods have been defined and explained. The class imbalance problem has been evaluated, and many potential solutions have been identified (under sampling, over sampling and SMOTE). It was noted that feature reduction can be a vital step in machine learning projects. Many feature selection techniques were identified (PCA, wrapper, filter and correlation). Previous use of each of these methods was explained. It was found that for many machine learning algorithms, reducing the dimensionality of the dataset would prove beneficial to the performance of the model.
The chapter also focused on the previous machine learning models used to solve similar problems in the financial sector. Descriptions of the more popular methods were provided such as SVM, Logistic Regression and Decision Trees. The successes and failures of these techniques have been noted and discussed.
Social network analysis has also featured in this chapter as a potential method to predict customer credit score. It has been seen that this type of analysis can be beneficial in understanding the connections and similarities between customers.
26
Finally, the chapter finished with other financial sector problems that have used similar techniques to solve them. Fraud detection has also been seen to use SVM and Logistic Regression similar to the credit risk score papers.
27
3.
DESIGN AND METHODOLOGY
This chapter outlines the design and methodology of the experiment that will be carried out to answer the research question of this project. The design of this experiment follows the CRISP-DM process outlined in figure 2.1. It includes an introduction to the datasets sourced for the project, as well as details of the supervised machine learning model that will be built and evaluated.
The steps below will be carried out following the CRISP-DM process:
a. Business and data understanding will involve communication with the chit fund
company providing the data. Obtaining this understanding will allow the exploration of the datasets to be carried out.
b. Data pre-processing will involve cleaning and sampling the data and splitting the
dataset into training and test datasets.
c. Modelling, running the data through a number of supervised machine learning
models (support vector machine, logistic regression, random forest and decision tree).
d. Evaluating the models using various measures and comparing the results of each
model.
e. Using social network analysis to explore the connections between subscribers using
certain variables in the dataset.
f. Communicating the results of the thesis with the chit fund company.
The main focus of this study is to compare machine learning techniques when aiming to predict the risk score of a chit fund member.
Chit funds are informal financial institutions used by members of the population who cannot access formal finance. Each member of a chit fund group pays an agreed monthly contribution to the fund. Once the monthly subscription has been paid, it is auctioned to one of its subscribers. 70-95% of the monthly fund can be auctioned. The subscriber bidding for the lowest amount of the fund wins that amount. Each subscriber can only win the prize
28
once per chit fund group. The remaining balance in the pot is distributed to each subscriber. This repeats each month until all subscribers win the pot. The chit fund company charge a fixed rate each month. This information is available on the Kyepot website (https://www.kyepot.com/how-it-works).
Figure 3.1 Outline of the research methodology
The thesis of this research is to demonstrate that the H0 A support vector machine achieves a higher sensitivity and specificity than that of a logistic regression model, random forest and decision tree model, when used to predict the risk score of a chit fund member.
3.1Data
Five datasets were obtained for this study, they contained historic financial data which provided information on previous chit fund groups and the subscribers who took part in each chit fund group. ‘Historical data is a pre-requirement for any credit scoring model’ (Römer & Musshoff, 2017). The data was provided by an Indian Chit Fund company, Kyepot. The datasets provided insight into a portion of subscribers within the company, the subscribers performance of previous chit fund groups, and their lending habits. The datasets
Business and Data Understanding
•Communicate with the chit fund company.
•Carry out data exploration. Data Pre-porcessing •Clean: impute/re move missing values. •Feature reduction. Model Training •Train multiple models using different machine learning techniques. Evaluate and Model Tuning •Compare and tune each model where necessary. Social Network Analysis •Use networks to carry out analysis on the subscriber network. Communicate •Communicate findings to the chit fund comany and write thesis.
29
contained information on subscribers who enrolled in a chit fund group between 1970 and 2017. The five raw datasets received were as follows; Subscriber, Auction, Transaction, Tender and Group.
The dependant variable is derived from the data provided. Auction date (the date on which the monthly instalment was due), and the payment date were used to derive a new variable detailing the number of days in default. This new variable was then used to create a ‘Default’ flag. Default is defined for this study as a subscriber who was greater than 90 days late with a payment. The dependant variable, ‘Default’, can take the values of ‘0’ or ‘1’, ‘0’ meaning that the subscriber was never over 90 days late with a payment, and ‘1’ meaning that the subscriber was over 90 days late with a payment.
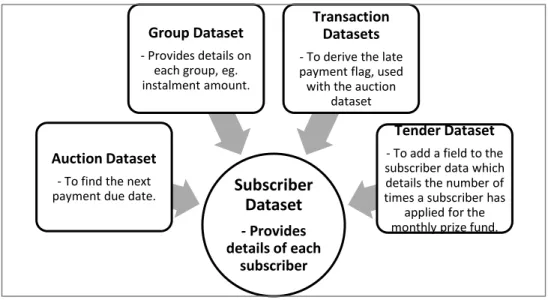
The data provided included information such as employment types, income, address, age and balance of the account. It also included all details about the chit fund groups, such as the chit fund amount, who won the monthly prize, and the date payments were received. Some sensitive data was also within the datasets. Descriptions of each variable within each of the datasets is provided in Appendix A. Figure 3.2 summarizes the valuable information contained within each of the five datasets.
During the data investigation stage of the project, a number of dataset characteristics will be explored. The volume of missing values will be considered, and statistical summaries of the variables will be carried out. Exploration of the trend of subscribers over time and identification of any outliers within the data will also be explained.
30
Figure 3.2 Dataset Overview
3.2Data preprocessing
The data pre-processing stage of the project will be used to clean and prepare the data for the experiment. Any assumptions made in the data will be noted at this stage.
The five datasets will be joined using the ‘sqldf’ package in R studio to create a master dataset to be used in the models. Any issues identified at the data investigation stage will be resolved. A number of common issues previously found in datasets will be identified, such as missing values, outliers, inconsistent or unreliable entries. To resolve any missing values issue, a threshold will be selected based on previous research to remove variables where the number of values missing is above the selected threshold. Of the remaining variables containing missing values, they will then be imputed based on the values that are present within the dataset. Identifying the inconsistent or unreliable entries may not be immediately obvious within the data. However, examining the distribution or mode of the variable will help to identify this issue.
3.2.1 Dummy Variables
As there are a mix of data types in each dataset, dummy variables will be introduced to enable a correlation test to be carried out on the variables. Each categorical variable will be
Subscriber Dataset - Provides details of each subscriber Auction Dataset
- To find the next payment due date.
Group Dataset - Provides details on
each group, eg. instalment amount.
Transaction Datasets - To derive the late payment flag, used with the auction
dataset
Tender Dataset - To add a field to the subscriber data which details the number of times a subscriber has
applied for the monthly prize fund.