Performance Improvement of MIMO-OFDM Wireless
Systems using PAPR Reduction Techniques
Gamal Mabrouk Abdel–
Hamid
Assoc. Prof. Dr, M.T.C, Cairo - Egypt
Sahar Abdel- Rahman
Lecturer, Banha University, 1st Cairo - Egypt
Hala Gaber Farrag
M.S.C. Student Cairo – Egypt
ABSTRACT
High Peak to Average Power Ratio (PAPR) for MIMO-OFDM system is still a demanding area and difficult issue. The radio transmitter stations for covering and getting enough transmitted power in their desired area has to use High Power Amplifier (HPA). On the other hand, in order the HPA to have the most output power efficiency must be designed to work close to the saturation region, therefore due to the high PAPR of input signals, a factor which is called memory-less nonlinear distortion will affect the communication channels. We know the MIMO-OFDM receiver’s efficiency is sensitive to the HPA. If the high power amplifier doesn’t work in linear region, it can cause the out-of-band power to be kept under the specified limits. This condition can cause inefficient amplification and expensive transmitters, thus it is necessary to investigate PAPR reduction techniques for MIMO-OFDM system. By now, for reducing PAPR, numerous techniques have been recommended. In this paper the performance and the efficiency of two types of them will be discussed and simulated and then we will propose our suggested method for a conventional OFDM system.
General Terms
Orthogonal Frequency Division Multiplexing (OFDM), Peak– to-Average Power Ratio (PAPR), High Power Amplifier (HPA), Transmit sequence (PTS), Probability Distribution Function (PDF), Mat lab program simulation.
Keywords
Orthogonal Frequency Division Multiplexing (OFDM), Peak– to-Average Power Ratio (PAPR), High Power Amplifier (HPA), selective mapping (SLM) Transmit sequence (PTS), Probability Distribution Function (PDF).
1.
INTRODUCTION
MIMO-OFDM is an attractive technique for high data rate wireless communication systems, but it exhibits a large peak-to-average power ratio (PAPR), due to the superposition of the individual nonlinear region of High Power Amplifier (HPA) [1-3], and the signal distortion induces the degradation of Bit Error Rate (BER). Therefore, RF power amplifiers should operate in a very large linear region to avoid the signal peaks from getting into the non-linear region of the power amplifier causing in-band distortion. i.e., inter modulation among the subcarriers and out of band radiation. To overcome this, the power amplifiers should be operated with a large power back-offs and this indirectly leads to very inefficient amplification and increases in transmitter power.
In MIMO-OFDM systems, several PAPR reduction schemes have been proposed to solve this problem [6&7]. One of the most widely used methods is Selective Mapping (SLM) and Partial Transmit sequence (PTS), using probabilistic methods [8]. The principle of probabilistic method depends on
OFDM symbols (multiple candidates) carrying the same information and selecting the one having the lowest PAPR [10]. The probabilistic method can also be classified into two strategies: sub block partitioning strategy and entire block strategy.
The sub block partitioning strategy, such as partial transmits sequence (PTS) [14-18], divides frequency domain signals into several sub blocks. On the other hand, the entire block strategy, such as selected mapping (SLM), [8–10] consider the entire block for generating multiple candidates. First, the entire block strategy of the probabilistic methods to generate multiple candidates is considered, then the probability Distribution Function (PDF) for the multiple candidate system is analyzed. When the candidate having the lowest PAPR is selected, the PDF of the amplitude of a selected OFDM symbol becomes a function of the number of candidates [10-11]. Throughout this paper we describe the basic principle of all these techniques. The selection of any of the PAPR reduction techniques may be at the cost of PAPR reduction capability, synchronization between the transmitter and the receiver. The absence of the PAPR reduction techniques will cause the increase in the transmit power, the in Bit error rate at the receiver, the data rate loss, and the computational complexity. Here we have studied through simulation results the performance of PTS and SLM based PAPR reduction techniques for these techniques based on various parameters [12].
2.
PRINCIPAL ALGORITHM FOR
REDUCING PAPR
PAPR is a historic issue in the development of the Wireless communication, the more PAPR of OFDM the more requirements and challenges for implementing the HPA. However the PAPR is calculated from the peak-amplitude of the waveform divided by the average value of the waveform as follows:
| |
| | (1)
The amplitude of has a Rayleigh distribution, while the power has a central chi-square distribution with two degrees of freedom. The distribution of PAPR states in the term of a Complementary Cumulative Distribution Function (CCDF) which can be given as following:
CCDF = Pr (PAPR<PAPR0 = A)
Assume A = PAPR0. (2)
| |
| |
The decibel form for Equation (4) is as following:
(5)
Although the probability of the largest PAPR to happen is not high, but for sending the high PAPR of OFDM signal without any distortion the probability increases. all the linearity in High Power Amplifier (HPA) and A/D converter should meet the requirements mentioned above [1-3]. Since the equipment that meets these necessities is very expensive, consequently, it is very demanding and important to reduce PAPR in OFDM system.
3.
PPAPR AND ITS REDUCTION IN
OFDM SYSTEMS
The complex discrete-time baseband equivalent time – domain OFDM signal can be expressed as:
√ ∑ 0 ≤ t ≤ nT (6)
Where transmit antennas that uses N subcarriers. With OFDM modulation, a block of n data symbols (one OFDM symbol), { , n = 0, 1… n-1} will be transmitted in parallel such that each symbol modulates a different subcarrier from a set { , N = 0, 1… N-1} . The N subcarriers are orthogonal, i.e. = N where = 1/nT and T is the symbol period. The above power characteristics can also be described in terms of their magnitudes (not power) by defining the crest factor (CF) as:
Pass Band Condition: √ (7)
In the PSK/OFDM system with N subcarriers, the maximum power occurs when all of the N subcarrier components happen to be added with identical phases. Assuming that | |
It results in PAPR = N, that is, the maximum power equivalent to N times the average power. We have noticed that more PAPR is resulted in case the M-QAM is greater than 4 times M-ray PSK. Meanwhile, the probability of the occurrence of the maximum power signal decreases as N increases . In equation (1) the real and imaginary components evaluate the expectation and variance of them and then after applying Central limit theorem for large N, the probability distribution of will follow the Gaussian distribution. The amplitude of OFDM signal has a Rayleigh distribution with zero mean and a variance of N times the variance of one complex sinusoid. Let {Zn} be the magnitudes of complex samples. Assuming that the average power of complex pass band OFDM signal is equal to one, the { } are the normalized Rayleigh random variables with its own average power, which has the probability density function [4-8] as shown below:
(8)
Where | | , Note that the maximum of is equivalent to the crest factor (CF) defined in Equation (8). Let denote the crest factor. Now, the cumulative distribution function (CDF) of is given as:
(9)
In order to find the probability that the crest factor (CF) exceeds z, we consider the following complementary CDF (CCDF) [8]:
̌
(10)
This is derived under the assumption that N samples are independent and N is sufficiently large, they do not withstand the band limited or oversampled signals. It is due to the fact that a sampled signal does not necessarily contain the maximum point of the original continuous-time signal. However, it is difficult to derive the exact CDF for the oversampled signals and therefore, the following simplified CDF will be used:
(11)
Where has to be determined by fitting the theoretical CDF into the actual one using simulation results, it has been shown that is appropriate for sufficiently large N.
4.
VARIOUS PAPR REDUCTION
TECHNIQUES
4.1
Partial Transmit Sequence
In PTS introduced in Fig.1 [14] (PAPR reduction scheme). In PTS, the frequency domain symbols , is partitioned into D disjoint blocks, that are zero-padded to be length N so that
∑
(12)
The end goal is to multiply each block by an optimized
sequence of phase constants such that the PAPR is reduced. It is assumed that the constants are drawn from a finite set A, where
| | . This can be done in the time domain because the IFFT is linear. That is, {∑ } ∑
(13)
Therefore, the PAPR can be checked without having to go back and forth between the time and frequency domains. Stated concisely, the goal of PTS is to
find according to
|∑ |
Fig.1 PTS Block Diagram
The weighting factors are assumed to be pure rotations. Without loss of generality, the first weighting factor can be set to unity. Therefore, the optimization problem is to find "D-I" phase values to minimize the PAPR. For instance, consider an OFDM system with 256 carriers, which is divided into 16 clusters. 15 optimal phase values are to be found for each input data vector. Even if the phase values are discredited to 0 and 180, phase combinations to be searched to find the optimum. Moreover, [15] shows that taking the peak amplitude of the N-point IFFT output will not give the true peak, and hence over sampling is necessary. Our key modification is as following. As before, the input complex data vector of N symbols is divided into D clusters; however,
only optimized phase values are required. Starting from the first cluster every alternate cluster is kept unchanged and phase values are optimized only for the rest of the blocks. For instance, in the above example, this would mean only 8 phase values to be optimized. If discretized (00–1800) phase values are used total phase combinations are . Corresponding system block diagram is shown in Figure.2. PTS can be quite effective at reducing the PAPR, however, the PAPR reduction capability depends on the size of D and P. effectively, there “ mappings” in a PTS scheme at the cost of D IFFT operations. But, as we will discuss below, the mappings are not even approximately independent, thus, the PAPR of one mapping is correlated with the PAPR of another mapping. In terms of PAPR reduction capability, this means that PTS falls well short of a scheme that tests independent signal mappings. Another difficulty for PTS is the side information that can distinguish different mappings must be transmitted, which can take up to D bits. There have been several proposed PTS side information schemes [15]. But there is still a sub-optimal Element to PTS where more mappings than necessary are being tried per PAPR reduction, which leads to more side information than necessary being transmitted per PAPR reduction. The PTS is one method that randomly searches the possible combinations, and there have been several attempts at more elegant solutions [16]. But all of these methods increase the complexity of the system by some unspecified amount making a PAPR-to-complexity tradeoff analysis difficult.
4.2
Selective Mapping Technique
In this method [6-7&12] as indicated in Fig. 2 the parallel input data vector is multiplied with V different phase sequences (each of length N) to create V modified data
blocks with different phases before the IFFT operation. Then after the IFFT operation, among the modified data blocks the block having minimum PAPR is selected for transmission. Information about the selected phase sequence should be transmitted to the receiver as side information and this is the reason for complexity. SLM can be used for any number of sub-carriers and for any signal constellation. It provides significant gain with moderate complexity. Channel coding is needed to protect the side information [6].
Fig.2 SLM Block Diagram
5.
SIMULATION RESULTS
5.1
Selective Mapping Technique
Simulation Result
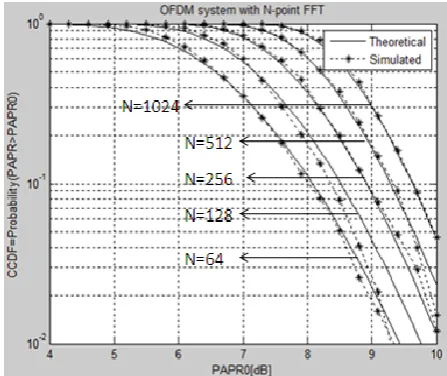
[image:3.595.314.538.475.663.2]In this part, an evaluation of factors which could influence the PAPR reduction performance is performed using Mat lab simulation. Based on the principles of SLM algorithm, it is apparent that the ability of PAPR reduction using SLM is affected by the route number M and subcarrier number N. Therefore, simulation with different values of M and N will be conducted, and the results exhibits some desired properties of signals representing the same information [6-9].
Fig.3 shows the theoretical and simulated CCDFs of OFDM signals with N =64, 128, 256, 512, 1024. Note that the simulation results deviate from the theoretical ones as N becomes small, which implies that Equation (11) is accurate only when N is sufficiently large.
[image:4.595.316.542.76.239.2]
Fig.6 PAPR characteristics of Chu sequence with & without oversampling.
[image:4.595.55.283.143.336.2]Fig. 6 shows that the values of PAPR without and with oversampling turn out to be 0dB and 4.27dB, respectively, which illustrates a rather significant difference in the PAPR by the sampling rate. The Fig. indicates that, higher over-sampling rate leads to higher PAPR value and good PAPR reduction performance. Generally, oversampling factor L = 4 is sufficient to catch the peaks
Fig. 4 Comparison of PAPR reduction performances with Different N values while M is fixed at8
Fig. 4 shows that the set number of OFDM signal frame M equals to 8, the number of sub-carrier N equals to 256, 128, and 64, respectively. In this Fig. the CCDF curve of original Sequence’s PAPR is given as the reference of comparison to the others with SLM method that has been used. It can be seen that when the number of sub-carrier increase the PAPR increase
5.2
Partial Transmit Sequence Simulation
Result
We realized from the above discussion that in PTS [13-16&17-18] approach, there are varying parameters that impact the PAPR reduction performance, these are:
1) The number of sub-blocks V, which influences the complexity strongly;
Fig.5 Comparison of PAPR reduction performance with different values of M while N is fixed at 128.
Fig. 5 shows that the Route numbers M=2, M=4, M=8, M=16 and M=32 are used, while N is fixed at 128. We have observed that the proposed SLM method displays a better PAPR reduction performance than the original OFDM signal
2) The number of possible phase value W, which impacts the complexity as well.
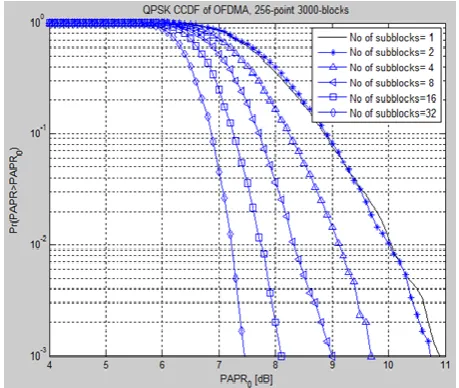
In our simulation, two parameters will be considered. They are sub-block sizes V and different sub-block partition proposals
[image:4.595.56.277.465.642.2] [image:4.595.314.544.517.711.2]Fig. 7 shows the CCDF of PAPR for a 16-QAM/OFDM system using PTS Technique as the number of sub-block varies. It is seen that the PAPR performance improves as the number of sub-blocks increases with V =
1, 2, 4, 8, and 16. So by increasing the number of sub-blocks, the improvement of PAPR reduction performance becomes better and better.
[image:5.595.54.271.154.324.2]
Fig. 8 PAPR performance of MIMO-FDM system with PTS technique with different number phase value
6. CONCLUSIONS
This paper investigates one of the bottleneck problems that exist in OFDM wireless communication system. High Peak-Average Power Ratio (PAPR of OFDM signal), and discusses how to reduce it by different effective system. High Peak-Average Power Ratio (PAPR of OFDM signal), and discusses how to reduce it by different effective algorithms. We are mainly focusing on the signal scrambling technology, and discuss it by observing the MATLAB simulation results. In the signal scrambling technology, we study the method of selected mapping and partial transmit sequence. A series of detailed simulations were conducted for comparison and results were obtained of the two schemes for PAPR reduction in a complex system. These methods have disadvantages, although they are used in optimizing the statistical characteristics of PAPR in MIMO-OFDM system. For the inherent defect of traditional PTS algorithm, complex computing, a very effective iterative method is introduced to determine sub-optimal weighting factor for each sub-block instead of conducting an ergodic searching so as to reduce the calculation complexity significantly. This sub-optimal algorithm gives a better approach to the real conditions in engineering practice by providing a compromise between the PAPR reduction performance and computational complexity
Fig. 8 shows the PAPR performance of MIMO-OFDM system with PTS technique with different number phases value W. We conclude that in a PTS-OFDM system, the larger W value takes, the better PAPR performance will be obtained when the number of sub-block V is fixed performance will be obtained when the number of sub-block V is fixed.
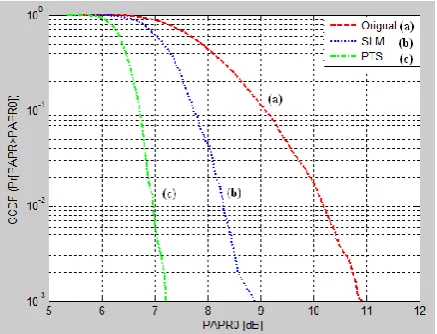
Fig. 9 Comparison of PAPR reduction performances between PTS algorithm and SLM algorithm For
MIMO-OFDM systems
Fig.9 shows a Comparison of PAPR reduction performances between PTS algorithm and SLM algorithm for MIMO-OFDM system. The PTS method should provide a superior performance on PAPR reduction. In fact this deduction is confirmed by simulation result.
6.
ACKNOWLEDGMENTS
In the Name of ALLAH, the Most Beneficent, the Most Merciful. All gratitude is due to ALLAH, who made this success possible and affordable. No words can ever express our thanks to every person who contributed to the fulfillment of this work. We have been honored to work under the supervision of Assoc. Prof. Dr. Gamal Mabrouk Abdel-Hamid. And Dr. Sahar Abdel- Rahman We would like to extend our deepest thanks and appreciation to them for the supervision, useful assistance, inspiration, constructive discussion and guidance throughout the course of this work
7.
REFERENCES
[1] A. Alabadelah, T. Fernandez, A. Media villa, B Nauwelaers, A. Santarelli,D. Schreurs, A. Tazn,P.A.Traverso. Nonlinear, “Models of Nonlinear Microwave Power Devices and Circuits", In 12th GAAS Symposium, Amsterdam, the Netherlands, 2004
[2] H. Saeedi, M. Sharif, and F. Marvasti, “Clipping noise cancellation in OFDM systems using oversampled signal reconstruction”, IEEE Communications Letters, vol. 6, no. 2, pp.73–75, 2002.
[3] H. Saeedi, M. Sharif, and F. Marvasti, “Clipping noise cancellation in OFDM systems using oversampled signal reconstruction”, IEEE Communications Letters, vol. 6, no. 2, pp.73–75, 2002.
[4] R.F.H. Fischer." Peak-to-Average Power Ratio Reduction in OFDM based on Lattice Decoding", In t Int. OFDM Workshop, Hamburg, Germany, August 2006.
[image:5.595.55.274.449.616.2][6] R. W. Bauml, R. F. H. Fischer, and J. B. Huber, “Reducing the peak-to-average power ratio of multicarrier modulation by selected mapping”, Electronics Letters, vol. 32, no. 22, pp. 2056–2057, 1996.
[7] B. K. Knoo, S. Y. Le Goff, C. C. Tsimenidis, and B. S. Sharif, “OFDM PAPR reduction using selected mapping without side information”, in Proceedings of the IEEE International Conference on Communications (ICC ’07), pp. 4341–4345, June2007
[8] N. Alon and J. H. Spencer. The probabilistic method. Wiley Inter-Science, 2nd edition, 2000.
[9] M. Breiling, S.H. M¨uller–Weinfurtner, J.B. Huber," SLM Peak-Power Reduction Without Explicit Side Information", IEEE Comm. Letters, pp. 239–241, June 2001.
[10] R.F.H. Fischer." Peak-to-Average Power Ratio (PAR) Reduction in OFDM based on Lattice Decoding", In h Int. OFDM Workshop, Hamburg, Germany, August 2006.
[11] S. H. Muller and J. B. Huber, “Comparison of peak power reduction schemes for OFDM”, in Proceedings of the IEEE Global Communications Conference (GLOBECOM ’97), pp. 1–5, November 1997.
[12] Y.-L. Lee, Y.-H. You, W.-G. Jeon, J.-H. Paik, H.-K. Song, "Peak to- Average Power Ratio in MIMO-OFDM Systems Using Selective Mapping". IEEE Comm. Letters, pp. 575–577, Dec. 2003.
[13] Cimini: “Peak-to-average power ratio reduction of an OFDM signal using partial transmit sequence”, IEEE Communication Letters, 4(3),86-88
[14] Y. Xiao, X. Lei, Q. Wen, and S. Li, “A class of low complexity PTS techniques for PAPR reduction in OFDM systems”, IEEE Signal Processing Letters, vol. 14, no. 10, pp. 680–683, 2007.
[15] B. K. Knoo, S. Y. Le Goff, C. C. Tsimenidis, and B. S. Sharif, “OFDM PAPR reduction using selected mapping without side information”, in Proceedings of the IEEE International Conference on Communications (ICC ’07), pp. 4341–4345, June2007
[16] C. Siegl and R. F. H. Fischer, “Partial transmits sequences for peak-to-average power ratio reduction in multiantenna OFDM”, EURASIP Journal on Wireless Communications and Networking, vol. 2008, Article ID 325829, 2008.
[17] A. Ghassemi, T.A.Gulliver, "A Low-Complexity PTS Based Radix FFT Method for PAPR Reduction in OFDM Systems," IEEE Trans. Signal Processing, vol.56, no.3, pp. 1161-1166, March 2008