Munich Personal RePEc Archive
Unit labour costs in Malta: Trends and
international comparisons
Grech, Aaron George
August 2004
Online at
https://mpra.ub.uni-muenchen.de/33666/
UNIT LABOUR COSTS IN MALTA:
TRENDS AND INTERNATIONAL COMPARISONS
Aaron George Grech
August 2004
Abstract
Appraisals of international competitiveness are increasingly focusing on unit labour costs. In this paper, a unit labour costs measure is derived for the Maltese economy for the last two decades. In order to take into account structural shifts, separate indices are also derived for the effective cost of labour in the private and Government sectors, and in manufacturing. These series indicate that unit labour costs in the overall economy rose by 2.3% per annum during the twenty years to 2003, and that the increases registered in the private sector and manufacturing were less pronounced. Malta‟s overall unit labour costs were estimated to stand at less than two-thirds of those in the EU-15 and the relativity between manufacturing labour costs in Malta and in Europe seems to have remained virtually stable over the last fifteen years. However since 2000, labour productivity has fallen in Malta, while compensation costs in some sectors have remained on the rise, leading to reduced competitiveness.
At the time of writing this paper, the author was a Research Officer in the Economic Analysis Office of the Economic Research Department of the Central Bank of Malta.
The views expressed in this paper are the author’s and do not necessarily reflect those
CONTENTS
Introduction ... 2
1. ULC in Malta ... 2
1.1 Overall economy ULC... 2
1.2 Private sector ULC ... 5
1.3 Manufacturing ... 7
2. International comparisons ... 9
2.1 Comparing overall economy ULC ... 12
2.2 Benchmarking labour costs in manufacturing ... 15
Conclusion ... 19
References ... 20
Introduction
The International Labour Organisation (ILO) defines unit labour costs (ULC) as ‘the
labour compensation per unit of gross value added produced‟ or else „nominal labour
compensation divided by real value added‟.1 More simply unit labour costs measure the nominal wage cost of producing one unit of output (defined in real terms).
Therefore, this measure involves the comparison of two indicators, namely labour
productivity and the average cost of labour used in generating output. When the cost
of labour grows at a faster pace than productivity, ULC rise and vice versa. Note that,
preferably, the measure of the cost of labour should not only reflect gross wages and
salaries but also other labour-related costs such as employers‟ contributions to social
security or health plans. Measured in this way, ULC can serve as a benchmark of the
cost competitiveness of utilising labour in a particular country rather than another.2 ULC also play a determining role in price dynamics, especially in non-tradable
sectors like personal services, Government and construction. A higher cost of labour,
in fact, leads to an inward shift in the aggregate supply curve and, with unchanged
demand, leads to a higher price level – a case of cost-push inflation.
This paper attempts to determine the trend followed by ULC in Malta during the
period 1984-2003 and analyse its main determinants. The estimates described in this
paper, presented fully in an appendix, are also used to assess the relative cost
competitiveness of the Maltese economy vis-à-vis a selected number of trading
partners.
1. ULC in Malta
1.1 Overall economy ULC
In line with the established ILO methodology, unit labour costs for Malta were
computed using employment income data taken from the National Accounts, as these
data include wages and other remuneration, together with the social security
1
See ILO (2001-2002). 2
contributions incurred by employers.3 However, this data category excludes the labour cost of self-employed persons, who constitute a significant part of the Maltese
labour market.4 Under the System of National Accounts 1953 methodology, the Maltese National Accounts included a category termed „Income from farming, fishing and private services‟. However, these data could not be used as a proxy for the
imputed labour cost of the self-employed since they inevitably include a profit
element. Thus, in order to derive correctly the average compensation per worker,
employment income was divided by the number of full-time equivalent employed,
excluding self-employed persons.5 Labour productivity was, in turn, computed as the real Gross Domestic Product (GDP) per full-time equivalent employed, including the
self-employed.6 ULC were then derived as the ratio between the average compensation per worker and labour productivity.7
Chart 1: Trend shown by ULC in the last two decades
95.0 105.0 115.0 125.0 135.0 145.0 155.0 165.0
1984 1985 1986 1987 1988 1989 1990 1991 1992 1993 1994 1995 1996 1997 1998 1999 2000 2001 2002 2003
In d e x ( 1 9 8 4 = 1 0 0 ) 3
See National Statistics Office (1999). Note that throughout this article pre-ESA 95 National Accounts data are utilised.
4
The ILO emphasises the importance of accounting for the employment cost of the self-employed. It suggests assuming that the self-employed earn the same compensation as the employed.
5
This series, and the methodology used in deriving it, are described in Grech (2003). 6
See Cobet & Wilson (2002) and Department of Labour (2003). The self-employed were included when calculating labour productivity as they help generate real output. By contrast since their imputed labour cost is not captured in employment income, they were excluded when estimating average wages. This measure of productivity is known technically as „apparent labour productivity‟.
7
Chart 1 illustrates the development of ULC in Malta for the two decades spanning
1984 to 2003. At the start of this period, it is estimated that, overall, operators needed
to spend 40 cents on labour compensation to produce Lm1 of real output. This cost
element rose to 61.8 cents for every Lm1 of production by 2003, an increase of
around 54%. Therefore, during this period, there was an average annual increase of 2.3% in Malta‟s ULC. However, as can be seen from Chart 1, growth in ULC was not consistent throughout these two decades. The development of this indicator can
be divided into four distinct periods. Up to 1989, ULC were relatively stable. This
reflected the fact that growth in employment income per worker and productivity
tended to cancel out (see Chart 2).
Chart 2: Growth in Labour Costs and Productivity
-4% -2% 0% 2% 4% 6% 8% 10% 12%
1985 1986 1987 1988 1989 1990 1991 1992 1993 1994 1995 1996 1997 1998 1999 2000 2001 2002 2003
Labour cost per worker Real output per employed
The first half of the 1990s, on the other hand, was characterised by labour costs
growing persistently at a higher rate than productivity. During this period labour
costs grew, on average, by 7.3% per annum, while the real output per person
employed expanded by just 3.8%. This was in part due to the fact that in the
immediate aftermath of the 1992 devaluation of the Maltese lira, wages had expanded
quite sharply, as workers sought to keep their purchasing power unchanged. Thus, in
1993 alone, unit labour costs rose by 6.4%. During the second half of the 1990s,
years it continued to outstrip the increase in productivity. ULC remained more or less
stable during this period, at around 53 cents for every Lm1 of real output. Then, in
the last three years under review, growth in ULC resumed, with an average annual
increase of 5%. In contrast to what had happened in the early 1990s, the acceleration
in ULC was brought about mainly by a decline in real output per worker. Growth in labour costs, with the exception of 2001, was, in fact, significantly below that which
had characterised previous years.
1.2 Private sector ULC
The spike seen in wage inflation in 2001 reflected the coming into force of a major
public sector collective agreement, which awarded a wage rise covering some five
years at one single go. In order to exclude the influence of developments in the
Government sector on overall ULC, an attempt was made to construct a separate ULC
measure for the private sector. The main problem involves coming up with a measure
of Government output in real terms. The only readily available proxy in the National Accounts is the „Government consumption of goods and services‟ category, which
captures the recurrent outlays of the civil service and related public entities, with the
main exception of transfer payments.8 This measure of output may, however, not adequately represent the effective contribution of Government employees to the
economy. In particular, under this approach when efforts at fiscal consolidation lower
the rate of increase in Government consumption, the output of Government is deemed
to have grown at a slower pace. At the same time, if Government spends more money
because of higher inefficiency, this approach concludes that output has risen. In both
cases, these conclusions may be wrong. Moreover under this kind of analysis, while
Government social welfare programmes are not included as output, the wages of
employees involved in them are, thus boosting the ULC of Government somewhat
arbitrarily.
The estimated ULC for the private sector shows a relatively slower increase over the
annum during the twenty-year period to 2003.9 Between 1984 and 1990, the private sector had to pay an average of 38 cents in labour costs for every Lm1 produced. By 1996, this proportion had risen to 48 cents. The private sector‟s ULC then remained stable until 2001, when it started to rise again to reach 56 cents by end 2003. While
the spike in ULC in the early 1990s was the consequence of a rapid rise in wages, the increase registered in recent years appears to be driven primarily by a significant drop
in productivity.10 Wage inflation, in fact, was below that registered in previous years, though labour costs were boosted by an increase in social security contribution rates.
Chart 3: The Influence of the Government Sector
95.0 105.0 115.0 125.0 135.0 145.0 155.0 165.0
1984 1985 1986 1987 1988 1989 1990 1991 1992 1993 1994 1995 1996 1997 1998 1999 2000 2001 2002 2003
In
d
e
x
(
1
9
8
4
=
1
0
0
)
ULC (Private sector) ULC (Overall economy)
By contrast, labour costs in the Government sector (comprising the civil service and
entities financed directly from the budget) appear to have accelerated gradually over
the years. In 1984, there was a positive gap of about 33% between average
employment income in the private and the Government sectors. This gap narrowed
progressively and after the 2001 collective agreement, mentioned earlier, the two
sectors operated on similar labour cost bases.
8
Capital expenditure was not considered as Government output because many projects are carried out by the private sector, and more importantly because this investment usually is not concerned with increasing Government‟s own output but rather constitutes an improvement in societal welfare.
9
The real output of the private sector was derived as the difference between real GDP and real Government consumption.
10
1.3 Manufacturing
The rise in private sector ULC, however, does not necessarily mean that Malta‟s
competitiveness, in terms of the cost of labour, deteriorated by this amount every
year. The rise in the ULC could, in fact, simply reflect structural changes in the
Maltese economy, which during these two decades progressively shifted from
capital-intensive sectors such as manufacturing to areas like tourism and financial services,
which are more labour-intensive. This process, known in academic literature as deindustrialisation, is „primarily a feature of successful economic development‟ and
several studies indicate that it is not a direct consequence of globalisation and the
associated increase in competition from low-wage countries.11 While the share in consumption of manufactured goods has tended to remain stable, or even drop in
some cases, in most developed economies the fast productivity growth that
characterises manufacturing has tended to reduce the labour input needed by this
industry.
Rowthorn and Ramaswamy (1997) report that „in the most advanced economies, employment in manufacturing declined from about 28% of the workforce in 1970 to
about 18% in 1994‟. Two-thirds of this drop was attributable to high productivity
growth in manufacturing, while the remaining third was on account of a faster
increase in the consumption of services. Services, in fact, seem to be quite income
elastic, so that the increased productivity (and hence income earned) in manufacturing
has ended up generating a higher demand for services, while leaving demand for
manufactured products relatively unchanged. Data for Malta covering the share of
manufacturing employment indicate a similar pattern as that found in middle- and
high-income countries. Manufacturing‟s share in Malta‟s gainfully occupied
population rose from around 17% in 1964 to 33% in 1981, and thereafter declined
gradually to 23% in 2003. However, nominal turnover per employed12 increased from around Lm1,250 in 1964 to Lm9,700 in 1981, and continued rising to over Lm49,500
in 2003.
11
Refer to Rowthorn & Ramaswamy (1997) and Rowthorn & Ramaswamy (1998) for extensive studies on this phenomenon common to most high- and middle-income countries.
12
These trends mirror those observed in other middle-income economies. While the
relative size of manufacturing industry has declined, its productivity seems to have
outstripped that of most other sectors. However, making accurate estimates of
productivity, and in turn ULC, in the Maltese manufacturing sector is complicated by
the fact that no industry-specific price index has ever been published. Data in nominal terms indicate that the wage share in the manufacturing sector has dropped
from 60.2% in 1984 to 55% in 2003. By contrast, the wage share in the rest of the
economy increased slightly. This does not necessarily mean that manufacturing‟s
ULC have declined over time, since the latter depend on real, and not nominal, output,
and price developments in manufacturing and the rest of the economy may have
diverged significantly.
Chart 4: ULC trends in manufacturing and the rest of the private sector
90.0 100.0 110.0 120.0 130.0 140.0 150.0 160.0 170.0
1984 1985 1986 1987 1988 1989 1990 1991 1992 1993 1994 1995 1996 1997 1998 1999 2000 2001 2002 2003
In
d
e
x
(
1
9
8
4
=
1
0
0
)
Rest of the private sector Manufacturing
Given that more than three-quarters of manufacturing sales are directed to the export
market and that these exports comprise around two-thirds of total exports of goods
and services, the deflator for the latter National Accounts category can serve as an
adequate proxy for price developments in this sector. The ULC indicator calculated
on the basis of this proxy suggests that the burden of labour costs rose more
moderately in manufacturing compared with the rest of the Maltese economy. The
twenty years, or by an average of 1.9% per annum, while in the rest of the private
sector13 the wage cost of production grew by 2.5% per annum. While manufacturing‟s ULC remained relatively stable after 1996, ULC in the other
privately owned sub-sectors continued to escalate (see Chart 4).
Manufacturing‟s increasing exposure to the rigours of international competition created pressures for wages and productivity growth to move in relative
synchronisation. On the other hand, in most non-tradable sectors the expansion of
labour costs was sustained by continued growth in consumption. The latter was at
first buoyed by a quick expansion in earnings and later on, when income growth
slackened, by a large drop in the household saving rate and an expanding fiscal
deficit.
2. International comparisons
The gradual removal of trade and foreign investment barriers, supplemented with
huge improvements in transport and communications networks, has led to a surge in
the international exchange of goods and services in recent decades.14 As a result, most industries are now operating in an environment characterised by increased
competition. Even in sectors previously considered to be non-tradable, for example
most personal services, developments such as the spread of the Internet are making
markets contestable. This has led to heightened interest in assessing the international
competitiveness of national economies or regional blocks. Given that input prices
tend to be relatively outside the control of most firms and small economies, appraisals
of international competitiveness have tended to focus on exchange rates,
Government-induced costs and, increasingly, unit labour costs.15
At the outset, it is important to point out the difficulties that beset these panel data
exercises. Obtaining reasonably comparable data for a large sample of countries is, as
13
Property income (after taking into account changes in the GDP deflator) was excluded from the output of the rest of the private sector.
14
International Monetary Fund (2004) indicates that during the two decades studied in this paper, the volume of world trade grew by an average of 6% per annum, exceeding by more than half the annual average growth in world output.
15 See Turner & Golub (1997), O‟ Mahony & van Ark (2003) and Commission of the European
yet, not possible, despite the progress made thanks to the efforts of agencies such as
the ILO, International Monetary Fund (IMF), Bureau of Labour Statistics (BLS) and
Eurostat and the research of academic institutions like the Groningen Growth and
Development Centre (GGDC).16 Most databases remain restricted in coverage to the main industrial countries, due to the complex statistical issues involved in constructing comparative ULC data.17 Employment, nominal output and labour cost data tend to be compiled using disparate methodologies. However, the main hurdle to
construct strictly comparable data lies in the compilation of measures of labour
productivity in real terms. This involves the use of purchasing power-adjusted
exchange rates – showing the amount of a country‟s currency that is required to
purchase a standard set of goods and services worth one unit of the currency of a base
country.18 While to a certain extent, this problem has been surmounted with respect to overall GDP, with organisations such as the World Bank, the Organisation for
Economic Co-operation and Development (OECD) and Eurostat, compiling measures
of overall output in purchasing power parity terms, comparable indicators for specific
sectors such as manufacturing are still relatively unavailable.
The use of ULC as measures of competitiveness has also been debated on theoretical grounds. The cost of labour represents „only a fraction of the total costs of a company, ignoring the influence of for instance, research and development expenditure, distribution costs and capital costs‟.19
While the cost of labour may be
lower in developing economies, leading to a lower ULC, the cost of capital tends to
be quite higher. In the case of durable consumer and investment goods, competitiveness may be determined by other factors, such as product quality,
customisation, warranties and after-sales service. Similarly, in sectors with rapid
technology improvements, and thus with the prospect of recurring high productivity
gains, labour costs may not exert a major influence on final product prices.
16
The GGDC is a research group of economists and economic historians at the Economics Department of the University of Groningen (Netherlands). It is at the forefront of comparative studies of productivity and ULCs, contributing directly to the databases of the ILO and the EU.
17
Examples of these databases are ILO (2000, 2001), IMF (2004) and Directorate Generale ECFIN(2004).
18
The statistical issues involved are described in Thomas & Vachris (1999) and in Monnikhof & van Ark (2000).
19
Movements in the ULC may also reflect factor substitution, without necessarily
implying more cost-efficient production and a consequent gain in international
competitiveness. Turner & Golub (1997) argue that in countries, or industries, where
firms retain workers during recessions,20 short-term movements in ULC may be difficult to interpret, due to changes in productivity induced by the business cycle. At the same time, the direction of causation between compensation costs and
productivity is unclear. For instance, a rise in wages unaccompanied by higher
productivity may induce investment and technological progress, and end up raising
productivity, so that that an increase in ULC may not necessarily have negative
economic effects in the long term.21 However, while the above considerations must be kept in mind when looking at developments in ULC, this indicator remains very
relevant as a measure of cost competitiveness, especially in those sectors of
labour-intensive and mass market manufacturing that are not characterised by rapid
technological changes.
In this light, an assessment of Malta‟s competitiveness can be made by looking at comparative trends in ULC. The first approach used is based on a simple comparison
of the growth in national ULC of the whole economy. This analysis is then enhanced
by computing and comparing ULC adjusted for differences in relative national prices.
Due to data unavailability, a similar assessment of international competitiveness in
manufacturing cannot be made. However, panel data on nominal wages in the sector
could be compared. Competitiveness was also assessed by looking at relative country
rankings of labour costs per employed and nominal gross value added per employed in industry. Given the lack of a comparative ULC indicator for manufacturing,
however, this analysis is not as theoretically rigorous as that done for the overall
economy.
20
This phenomenon, known as labour hoarding, arises, for instance, due to high hiring and firing costs, or is used to enhance the loyalty of workers, particularly those holding skills in short supply.
21
2.1 Comparing overall economy ULC
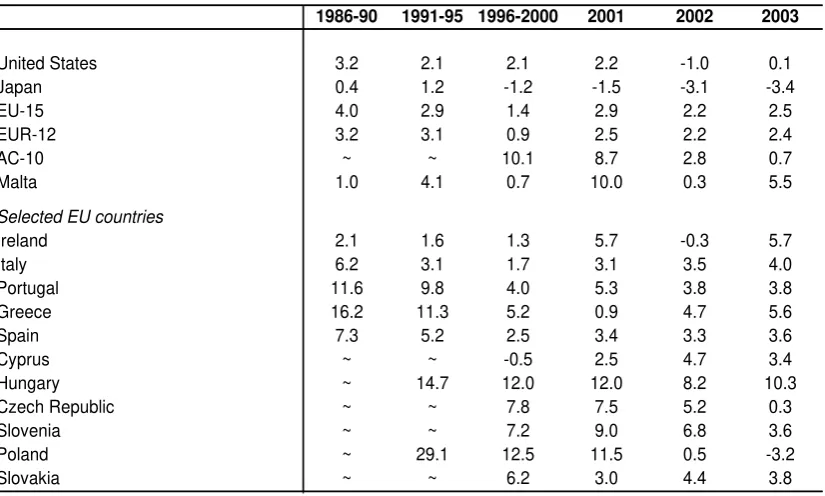
The European Commission‟s regular publication „European Economy‟ contains data on ULC for the EU Member States, Japan and the United States (see Table 1). These
data are, however, calculated using national currencies and output is not adjusted for
purchasing power parity. As a result, they are not strictly accurate as a measure of
competitiveness, because movements in the cost of labour due to changes in exchange
rates are ignored, as are shifts in relative national price levels. The latter omission
may hinder analysis considerably, as many of the countries are a different stage of
development and thus price dynamics may be quite divergent. Thus, for instance,
growth in ULC is strongest in lower-income economies, such as Poland and Hungary,
and that in countries like Portugal, Greece and Spain rises moderated gradually in line
with economic convergence.
1986-90 1991-95 1996-2000 2001 2002 2003
United States 3.2 2.1 2.1 2.2 -1.0 0.1
Japan 0.4 1.2 -1.2 -1.5 -3.1 -3.4
EU-15 4.0 2.9 1.4 2.9 2.2 2.5
EUR-12 3.2 3.1 0.9 2.5 2.2 2.4
AC-10 ~ ~ 10.1 8.7 2.8 0.7
Malta 1.0 4.1 0.7 10.0 0.3 5.5
Selected EU countries
Ireland 2.1 1.6 1.3 5.7 -0.3 5.7
Italy 6.2 3.1 1.7 3.1 3.5 4.0
Portugal 11.6 9.8 4.0 5.3 3.8 3.8
Greece 16.2 11.3 5.2 0.9 4.7 5.6
Spain 7.3 5.2 2.5 3.4 3.3 3.6
Cyprus ~ ~ -0.5 2.5 4.7 3.4
Hungary ~ 14.7 12.0 12.0 8.2 10.3
Czech Republic ~ ~ 7.8 7.5 5.2 0.3
Slovenia ~ ~ 7.2 9.0 6.8 3.6
Poland ~ 29.1 12.5 11.5 0.5 -3.2
Slovakia ~ ~ 6.2 3.0 4.4 3.8
%
[image:14.595.94.507.387.635.2]Source: Statistical Annex European Economy (2004), Data for Malta: Author's estimates
Table 1
ANNUAL CHANGE IN ULC: TOTAL ECONOMY
Despite the limited statistical comparability of these data, they indicate that Malta‟s ULC did not grow at an excessive rate during the last two decades. In fact, the
expansion was smaller than that registered in Greece, Portugal and Spain, countries at
a slightly higher stage of economic progress. Between 1986 and 1990 and, again, between 1996 and 2000, the average growth in Malta‟s ULC was even lower than that recorded in Ireland, the United States and the EU-15. This assessment is, however,
marred by the post-2000 performance, when Malta‟s ULC rose substantially on the
back of higher public sector pay and a slowdown in productivity.
1999 2000 2001 2002
EU-15 100.0 100.5 101.0 100.7
AC-10 ~ 44.7 49.2 49.2
Malta 61.3 62.4 64.5 63.8
Selected countries
Ireland 85.1 86.5 90.6 86.8
Italy 81.7 81.0 83.2 85.0
Cyprus 79.4 80.0 79.6 82.8
Spain 81.0 81.5 82.6 82.1
Slovenia 73.5 74.5 75.3 76.0
Greece 78.7 74.9 73.9 72.6
Poland 44.0 47.8 56.5 53.0
Hungary 37.0 38.9 42.3 47.3
Czech Republic ~ 36.9 40.0 46.5
Slovakia 29.6 31.1 31.1 31.6
Bulgaria 27.8 27.4 29.3 29.5
Turkey 34.1 35.6 29.1 28.8
EU-15 1999=100
[image:15.595.99.441.223.467.2]Source: NewCronos Database, Data for Malta: Author's estimates
COMPARATIVE ULC LEVELS: TOTAL ECONOMY Table 2
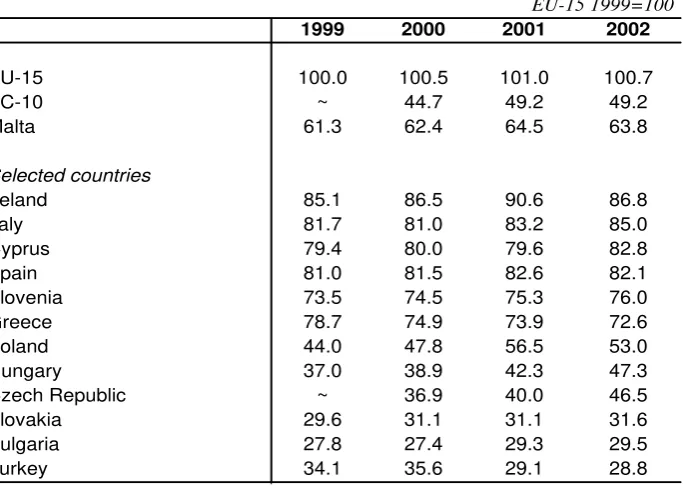
To arrive at a more precise judgement of the cost of labour in Malta, data from Eurostat‟s NewCronos database were utilised to construct comparative ULC levels on the basis of compensation per employee denominated in Euro and GDP in PPS per
employed person.22 While methodological issues still restrict the comparability of employment figures and national accounts compilation methods are as yet not fully
harmonised, these data (see Table 2) can be considered as fairly indicative.
Predictably, these data suggest that the cost of labour is higher in Malta than the
average of the other acceding countries, but lies quite below that present in the EU-15. Malta‟s estimated overall ULC are, however, significantly lower than those present in countries at a similar stage of development, such as Greece, Slovenia and Cyprus,
suggesting that given its relative productivity levels, Maltese labour is not excessively priced. The data indicate that Malta‟s ULC have converged by two percentage points
22
towards the EU-15 level during the period 1999 to 2002, the same pace as Slovakia
and Slovenia, but faster than Ireland and Spain (where, however, labour is relatively
more expensive). Transition economies such as Poland, Hungary and the Czech
Republic have experienced a much sharper rate of convergence, indicating that their
cost advantage is dissipating rapidly, while Malta has retained its competitive position with respect to Cyprus and Italy.
Chart 5: Compensation per Employee and Apparent Labour Productivity in 2002
0 20 40 60 80 100 120
0 20 40 60 80 100 120
Apparent Labour Productivity (EU-15=100)
C o m p e n s a ti o n p e r E m p lo y e e ( E U -1 5 =1 0 0 ) Ireland Malta Cyprus Slovak R. Slovenia Italy Spain Greece Turkey Bulgaria Hungary Poland Czech R.
Economic theory postulates that compensation per employee and labour productivity
follow each other closely. If this were not the case, firms would have to finance wage
rises by tapping into profits, or raising prices. In a competitive environment, if such a
situation persists firms would either close down or relocate to cheaper destinations. A
panel of 13 countries (six above and six below Malta‟s relative GDP per capita)
confirms the close link between labour costs and productivity (see Chart 5).23 Most countries‟ relative rankings in terms of compensation per employee and GDP per worker are similar, indicating that more productive countries tend to have higher
relationship between apparent labour productivity and labour costs, as GDP per
worker tends to exceed average compensation significantly. This is mainly due to the
fact that the measure of productivity utilised assumes that any increase in output is
solely due to labour, and thus ignores the return due to additional capital and
technology. Irrespective of these considerations, the cross plot of relative labour remuneration and productivity demonstrates that Maltese labour is definitely not
overpriced. Only Hungary and the Slovak Republic have an apparent advantage in
terms of a wider gap between productivity and labour costs.24
2.2 Benchmarking labour costs in manufacturing
As was argued in a previous section of this paper, a persistent rise in the ULC of the
total economy may not be caused by wage claims constantly outstripping productivity
growth, but rather reflect a structural transition towards the more labour intensive
services sector. Since most of the above-mentioned economies are passing through
this phase, it may be more appropriate to assess competitiveness by looking at
measures of the ULC for a specific sector, such as manufacturing. However, due to
data unavailability, it is virtually impossible to construct at present a panel of
sector-specific ULC, and competitiveness analysis must perforce focus on less accurate and
academically rigorous benchmarking exercises.
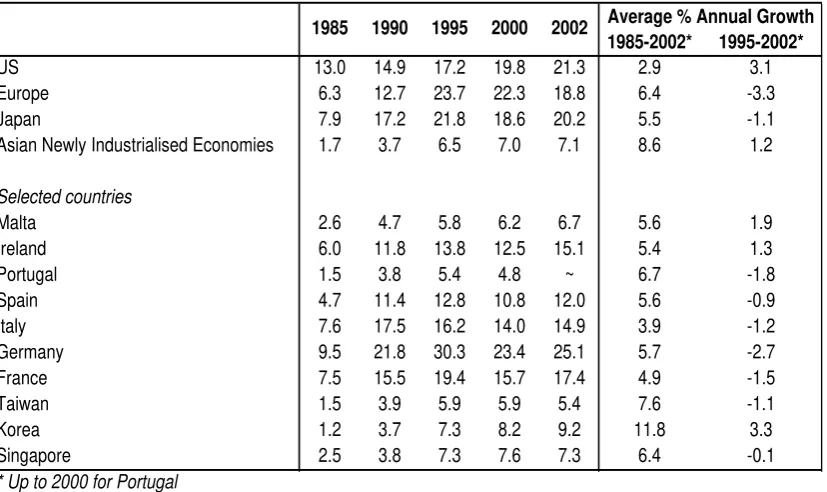
In the United States, the BLS regularly issues comparative data on hourly industrial
compensation costs.25 These data indicate that hourly compensation costs in US manufacturing rose from $13.01 in 1985 to $19.76 in 2000 (see Table 3). In Europe
the rise was quite larger, from $7.92 to $18.60, while hourly labour costs in the newly
industrialised Asian economies (Singapore, Korea, Taiwan and Hong Kong) increased
from $1.65 to $6.95 during the same period.
23
The correlation coefficient between the two sets of data (for 2002) was found to be 0.95. A similar correlation can be found between the relative ULC and GDP per capita levels, indicating that more-developed countries have a higher cost of labour.
24
The latter means that profit shares are relatively higher, a factor that may attract firms to operate in these countries. However it could simply be due to a different composition of output or competition. 25
1985-2002* 1995-2002*
US 13.0 14.9 17.2 19.8 21.3 2.9 3.1
Europe 6.3 12.7 23.7 22.3 18.8 6.4 -3.3
Japan 7.9 17.2 21.8 18.6 20.2 5.5 -1.1
Asian Newly Industrialised Economies 1.7 3.7 6.5 7.0 7.1 8.6 1.2
Selected countries
Malta 2.6 4.7 5.8 6.2 6.7 5.6 1.9
Ireland 6.0 11.8 13.8 12.5 15.1 5.4 1.3
Portugal 1.5 3.8 5.4 4.8 ~ 6.7 -1.8
Spain 4.7 11.4 12.8 10.8 12.0 5.6 -0.9
Italy 7.6 17.5 16.2 14.0 14.9 3.9 -1.2
Germany 9.5 21.8 30.3 23.4 25.1 5.7 -2.7
France 7.5 15.5 19.4 15.7 17.4 4.9 -1.5
Taiwan 1.5 3.9 5.9 5.9 5.4 7.6 -1.1
Korea 1.2 3.7 7.3 8.2 9.2 11.8 3.3
[image:18.595.94.508.116.362.2]Singapore 2.5 3.8 7.3 7.6 7.3 6.4 -0.1
Table 3
Average % Annual Growth 1985 1990 1995 2000 2002
US $
HOURLY COMPENSATION COSTS IN MANUFACTURING
Source: Bureau of Labour Statistics (US), Data for Malta: Author's estimates
* Up to 2000 for Portugal
Data on hours worked by employees in manufacturing do not exist for Malta.
Assuming that workers had worked a standard 40-hour week throughout,
compensation costs are estimated to have risen from $2.59 in 1985 to $6.22 in 2000.
According to these estimates, therefore, the relativity between labour costs in
European and Maltese manufacturing remained stable at about 3 during the fifteen
years to 2000, while costs in the Asian economies converged to those in Malta. The BLS‟ data for 2002 show that costs had risen by 7.4% to $21.33 in the US, by 9.7% to $20.26 in Europe and by 4.3% to $7.08 in the newly industrialised Asian economies.
Estimates for Malta indicate an increase of 6.9% to $6.65 per hour. By 2003
personnel costs had, however, risen to $8.38 in Malta, boosted upwards by a 15%
appreciation of the Maltese lira against the US dollar.
Quite interestingly, the BLS data point out that labour costs slowed down
significantly across the globe during the second half of the 1990s and the first years of
the 2000s, with the exception of the US. They actually dropped in nominal terms in
continental Europe, Japan and some Asian economies. Wages continued to rise,
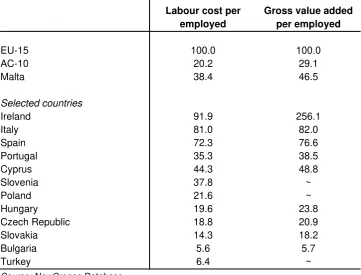
In its NewCronos database, Eurostat provides a comprehensive set of manufacturing
performance indicators. While these data suffer from a limited time frame (covering
only 1995 to 2001) and country coverage (extended to EU Member States and
candidate countries), the underlying compilation methods and definitions are more
consistent. They present a very similar picture to that given by the BLS data. Malta‟s labour cost per employed is, in fact, reported at just over a third of the European
average. Manufacturing firms in Malta face lower labour costs than those in
European Mediterranean countries, but higher than in Portugal and Slovenia, two
countries at a similar level of economic development (see Table 4). Costs in Malta
are also higher than in most other new Member States, but this is offset by the fact
that gross value added per employed in Maltese manufacturing is significantly larger.
There is, in fact, a positive gap between the relative levels of value added and costs in
Maltese manufacturing that is larger than that of most other Member States.
Labour cost per employed
Gross value added per employed
EU-15 100.0 100.0
AC-10 20.2 29.1
Malta 38.4 46.5
Selected countries
Ireland 91.9 256.1
Italy 81.0 82.0
Spain 72.3 76.6
Portugal 35.3 38.5
Cyprus 44.3 48.8
Slovenia 37.8 ~
Poland 21.6 ~
Hungary 19.6 23.8
Czech Republic 18.8 20.9
Slovakia 14.3 18.2
Bulgaria 5.6 5.7
Turkey 6.4 ~
COMPARATIVE INDICATORS: MANUFACTURING (2001)
[image:19.595.92.454.400.675.2]Source: NewCronos Database
Table 4
radio, t.v. & communications.26 Here gross operating profit rates stand at around 50% and 40% respectively, by far higher than those in the same sectors in other countries,
and in other sectors of Irish manufacturing, and could possibly reflect transfer pricing
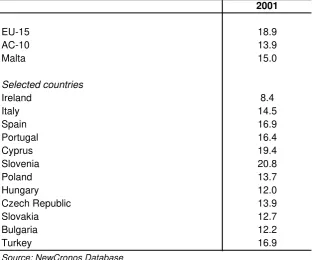
on the part of multinationals rather than actual output.27 Eurostat data, in fact, indicate that labour costs constitute just 8.4% of the Irish manufacturing‟s total production value, compared with the European average of 18.9% (see Table 5). In
Malta, the incidence of labour costs relative to vale added is only marginally larger
than that in the other new Member States, and significantly smaller than that in the
EU-15.
2001
EU-15 18.9
AC-10 13.9
Malta 15.0
Selected countries
Ireland 8.4
Italy 14.5
Spain 16.9
Portugal 16.4
Cyprus 19.4
Slovenia 20.8
Poland 13.7
Hungary 12.0
Czech Republic 13.9
Slovakia 12.7
Bulgaria 12.2
Turkey 16.9
%
[image:20.595.91.405.338.598.2]Source: NewCronos Database
Table 5
LABOUR COSTS AS A % OF TOTAL PRODUCTION VALUE: MANUFACTURING (2001)
It should be noted, however, that while gross earnings for Maltese manufacturing
workers are much smaller than those in Europe, the relativity in terms of net earnings
is substantially better. Paternoster (2004) reports that „all acceding countries have
lower levels of net earnings than the Member States except for Malta, where the net
26
Refer to Eurostat (2002).
27Gropp & Kostial (2000), in fact, conclude that „the low tax rate in Ireland appears to have greatly
earnings are above those of Greece and Portugal, and Cyprus, where the net earnings are above those of Spain”. Social security contributions in Malta are, in fact, on the low side of the European spectrum.
Conclusion
The effective cost of labour faced, on average, by operators in the Maltese economy has increased by 2.3% per annum over the last twenty years.28 This development, however, should not be misconstrued as evidence that Malta‟s competitiveness has been declining significantly over time, as the country‟s overall ULC remain at less than two-thirds of those found in the EU-15, and in most of the period under study
they grew less than in the more-developed European countries. The increase in Malta‟s ULC was also partly on account of a shift towards more labour-intensive industries such as services, and was also buoyed in recent years by the convergence of
salaries in the Government sector to those in private industry. In manufacturing, the
annual average growth in ULC appears to have been more moderate so that the
relativity between labour costs in Malta and in Europe remained virtually stable over
the last fifteen years.
Even for the overall economy, Malta‟s ULC do not appear to be out of line with the country‟s relative productivity ranking, and, in fact, the positive gap between labour productivity and compensation is higher than that in most EU Member States. However, since 2000 Malta‟s labour productivity has fallen significantly, reversing in part the catching up that had characterised previous decades, while compensation
REFERENCES
Bercuson, Kenneth (1995). “Singapore: A Case Study in Rapid Development”, Occasional Paper 119. United States: International Monetary Fund.
Bikoi, Theo, Lisa Moglia & Chris Sparks (2002). “A Perspective on U.S. and Foreign Compensation Costs in Manufacturing”, Monthly Labour Review: June, pp. 36-50. United States: Bureau of Labour Statistics.
Chao, Elaine L. (2003). A Chartbook of International Labour Comparisons: United States,
Europe and Asia. United States: Department of Labour.
Cobet, Aaron E. & Gregory A. Wilson (2002). “Comparing 50 Years of Labour Productivity in U.S. and Foreign Manufacturing”, Monthly Labour Review: June, pp. 51-65. United States: Bureau of Labour Statistics.
Commission of the European Communities (2003). “European Competitiveness Report 2003”, Commission Staff Working Document SEC(2003) 1299. Belgium: European Commission.
Dean, Edward R. & Mark K. Sherwood (1994). “Manufacturing Costs, Productivity and
Competitiveness, 1979-93”, Monthly Labour Review: October, pp. 3-16. United States:
Bureau of Labour Statistics.
Delia, Emanuel P. (2004). “Malta‟s SMEs in the EU: New Realities and Old Structures”,
Occasional Paper 3. Malta: APS Bank.
Department of Labour (2003). “International Comparisons of Manufacturing Productivity and Unit Labour Cost Trends, 2002”, News Release 03-469. United States: Bureau of Labour Statistics.
Department of Labour (2003). Comparative Real Gross Domestic Product per Capita and
Per Employed Person, Fourteen Countries, 1960-2002. United States: Bureau of Labour
Statistics.
28
Department of Labour (2003). “International Comparisons of Hourly Compensation Costs for Production Workers in Manufacturing, 2002”, News Release 03-507. United States:
Bureau of Labour Statistics.
Directorate Generale ECFIN (2004). “Statistical Annex of European Economy”, European Economy. Belgium: European Commission.
European Central Bank (2003). “Developments in the Euro Area‟s International Cost and Price Competitiveness”, Monthly Bulletin August, pg. 67-74. Germany: European Central Bank.
Eurostat (2002). Economic Portrait of the European Union 2002. Luxembourg: Eurostat.
Grech, Aaron G. (2003). “Assessing Employment in Malta”, Central Bank of Malta Working
Paper No.1, www.centralbankmalta.com. Malta: Central Bank of Malta.
Grech, Aaron G. (2003). “Employment and Labour Input in the Maltese Economy”, Central Bank of Malta Quarterly Review, 36:3, pp. 47-52. Malta: Central Bank of Malta.
Gropp, Reint & Kristina Kostial (2000). “The Disappearing Tax Base: Is Foreign Direct Investment Eroding Corporate Income Taxes?”, European Central Bank Working Paper No.31. Germany: European Central Bank.
International Labour Organisation (2001, 2002). Key Indicators of the Labour Market.
Switzerland: International Labour Organisation.
International Monetary Fund (2004). World Economic Outlook Database,
www.imf.org/external/pubs/ft/weo/2004/01/data/index.htm. United States: International Monetary Fund.
Kmitch, Janet, Pedro Laboy & Sarah van Damme (1995). “International Comparisons of Manufacturing Compensation”, Monthly Labour Review: October, pp. 3-9. United States: Bureau of Labour Statistics.
National Statistics Office (1999). National Accounts of the Maltese Islands: Sources and
Methods. Malta: National Statistics Office.
O‟Mahony, Mary & Bart van Ark (2003). “EU Productivity and Competitiveness: An Industry Perspective – Can Europe resume the catching-up process”, Enterprise Publications.
Belgium: European Commission.
Paternoster, Anne (2004). “Annual Net Earnings in Manufacturing 1996-2002”, Statistics in Focus, Theme 3 – 4/2004. Luxembourg: Eurostat.
Rowthorn, Robert & Ramana Ramaswamy (1997). “Deindustrialisation: Causes and Implications”, Working Paper WP/97/42. United States: International Monetary Fund.
Rowthorn, Robert & Ramana Ramaswamy (1998). “Growth, Trade and Deindustrialisation”,
Working Paper WP/98/60. United States: International Monetary Fund.
Sparks, Christopher & Mary Greiner (1997). “U.S. and Foreign Productivity and Unit Labour Costs”, Monthly Labour Review: February, pp. 26-35. United States: Bureau of Labour Statistics.
Thomas, James & Michelle A. Vachris (1999). International Price Comparisons based on
Purchasing Power Parity, Monthly Labour Review: October, pp. 3-12. United States: Bureau
of Labour Statistics.
Appendix: Estimated ULC series for Malta
Overall Economy Government Sector Private Sector
1984 40.07 53.56 38.26
1985 39.95 52.89 38.08
1986 39.87 53.95 37.62
1987 41.77 54.63 39.66
1988 40.51 55.64 37.93
1989 40.15 54.94 37.42
1990 41.95 58.22 38.95
1991 43.89 58.99 40.92
1992 45.29 60.84 42.05
1993 48.19 66.26 44.41
1994 49.94 68.26 45.72
1995 51.26 69.93 46.85
1996 53.12 71.57 48.35
1997 52.34 72.06 47.75
1998 53.28 76.94 48.25
1999 54.22 79.29 49.04
2000 53.11 78.82 47.79
2001 58.41 87.28 51.93
2002 58.58 87.40 51.98
2003 61.80 86.04 55.60
The above data show how many cents were spent in labour costs in each sector for every Lm1
worth of real output.
ULC indices (1984=100)
Manufacturing Rest of Private Sector
1984 100.00 100.00
1985 100.58 98.06
1986 96.60 99.25
1987 101.88 107.28
1988 94.40 108.56
1989 95.27 103.42
1990 99.51 107.65
1991 103.64 114.17
1992 106.29 121.22
1993 110.54 133.84
1994 120.25 130.59
1995 124.29 136.35
1996 132.08 140.36
1997 132.91 140.40
1998 135.93 141.55
1999 141.05 140.18
2000 136.20 137.82
2001 149.36 146.81
2002 148.63 145.58
2003 161.64 144.93
The above indices are less accurate than the other ULC series, as manufacturing value added
was not deflated with an industry-specific index, but with the export deflator (which also