Script Enhanced Unit Cell Approach for the Simulation
of Compressive Behavior in Fiber Reinforced Cement
Composites
Sunir Hassan
Dept. of Applied Mechanics Indian Institute of TechnologyMadras
Lakshmana C Rao, D Sc.
Dept. of Applied Mechanics Indian Institute of TechnologyMadras
Ganesh Babu K,
Ph. DDept. of Ocean Engineering Indian Institute of Technology
Madras
ABSTRACT
Finite Element Analysis is a well known computing technique to numerically solve a range of problems in the day to day life especially in the area of solid or fluid mechanics. Virtual parametric study of mechanical properties of most of the engineering materials can be done in an efficient way if a suitable numerical model representing the material can be incorporated into an FEA package. Fiber reinforced cement composite being a particulate composite of quasi brittle nature, a meso level numerical model may essentially consist of a mortar phase and an aggregate phase. This two phase model may be considered to be the smallest repeating volume of the material and is referred to as the unit cell under consideration. A simulation of compressive loading on this unit cell model is expected to capture the properties of the material as a whole within acceptable limits. In the current paper, a unit cell with a square aggregate volume fraction is considered and the adaptability of the unit cell for a range of aggregate volume fractions is enhanced by using a python script in a semi automatic manner. This script enhanced unit cell can be easily redesigned and may be used for any size and shape of the aggregate volume fraction as required.
General Terms
Finite Element Analysis, Unit cell approach, Representative Volume Element, Fiber Reinforced Cement Composites, Python Scripting
Keywords
Cement composites, quasi brittle failure, Unit Cells, Simulation, Compression loading, RVE, FEA, mesoscale models, constitutive behaviour
1.
INTRODUCTION
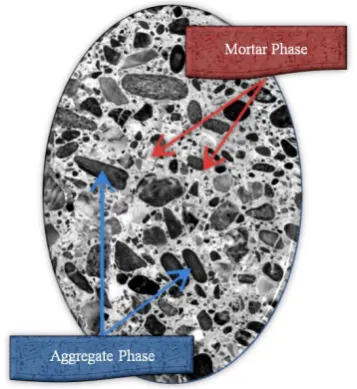
Unit Cell approach is a novel method for simulating the behaviour of engineering materials by making use of the capabilities of a finite element software package. It is necessary to identify various basic characteristics of the material under consideration before attempting the simulation process of the behaviour of that material. An investigation in this regard reveals that most of the engineering materials are heterogeneous in nature in smaller length scales, even though they are considered otherwise traditionally for analytical studies. Examples of materials exhibiting heterogeneity at smaller length scales are polymer based composites, metal matrix composites, cement composites (Figure 1), ceramics etc. This heterogeneity can be attributed to the presence of dispersed particulates in a matrix and the mechanical
[image:1.595.339.518.283.478.2]behaviour of these composites largely depends on the size, shape and properties of these particulates.
Figure 1: Normal cement composite showing a heterogeneous mesostructure
Conducting a large number of experiments in an effort to determine the macroscopic response of these materials, on a number of material samples, for various phase properties, volume fraction and loading conditions are difficult and expensive. Therefore analytical and numerical approaches coupled with high performance computing capabilities are required to explicitly model the material with multi phases at lower length scales. The length scale where a clear distinction of various phases is possible is referred to as mesoscale. To model the material at mesoscale, a representative volume element (RVE) of the material is to be identified. The RVE is defined as the minimum volume of laboratory scale specimen such that the results obtained from this specimen can still be regarded as from a representative of the continuum. A mesoscale model when analyzed numerically by taking an RVE of the material and by applying necessary boundary conditions such as periodic boundary conditions on the volume element, the approach may be called as unit cell approach. Unit cell approach is employed in predicting the effective mechanical properties and capturing the nonlinear behaviour of many of the composite materials (Kouznetsova [1], Gitman et al. [2]).
Element Analysis software package, to study the constitutive behaviour of normal low strength concrete was reported by Ghouse et.al. [3] Two different shapes of the aggregate volume fractions were considered here and the results from a unit cell with uniformly distributed aggregate volume fraction were comparable with that of non uniform distribution. Sunir et.al [4] could perform a similar investigation on fiber reinforced high strength cement composites, the matrix of which was initially considered to be reinforced with glass fibers and then with poly propylene fibers and the unit cell was designed with a round shaped aggregate volume fraction. Both [3] and [4] adopted a manual method of interaction with the unit cell for applying the necessary periodic boundary conditions and other displacement boundary conditions for displacement controlled loading simulation. Whenever there was a change in the volume fraction value, it was necessary to redesign the unit cell and apply the boundary conditions manually. When there were a large number of boundary conditions to be applied based on the density of mesh, it became a tedious and impractical process to identify specific nodes and assign rules as per the requirement. Rashed et.al [5] developed a python script for non-unit cell based numerical model of normal concrete to simulate the behaviour of the material under tensile type of loading. The script enhanced unit cell model discussed in this paper focuses on essential aspects behind the automation process of unit cell approach using python codes. Shape of the aggregate volume fraction considered in this work is a square one oriented at three different inclination angles when measured between the horizontal edges of the matrix and the aggregate.
2.
UNIT CELL APPROACH
A unit cell is an idealized representative volume of a material that repeats periodically to form the macroscopic structure of the material. It should also contain enough information about the mesostructure of the material and should be suitably downsized in comparison with the macroscopic structural dimensions. Hill [6] and Hashin [7] played an important role in introducing and developing this approach that takes mechanical properties like elastic modulus, Poisson’s ratio, mass density etc of the individual phases to predict the macroscopic properties of the heterogeneous material.
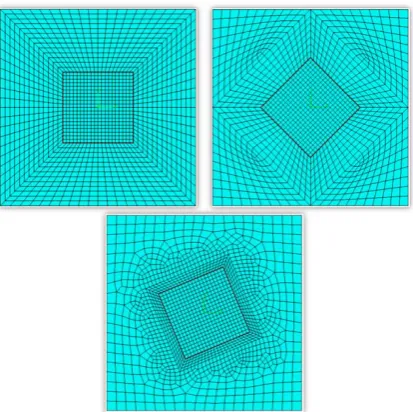
[image:2.595.326.533.73.279.2]Foremost step in the process of modelling a unit cell is to identify an appropriate RVE or a unit cell for any given material, as the shape, size and orientation of different phases of the unit cell differ for different materials. As suggested by Lemaitre [8] dimensions of an RVE for metallic materials may be roughly taken as 0.1 mm, 1 mm for polymers and 100 mm for cement composites. As reported by Kouznetsova [1], a regular arrangement of voids in a unit cell predicted results with 2% variation for elastic zone and 10% variation for plastic zone when compared with non-uniformly arranged voids and available experimental results. In the current work, an RVE of polypropylene reinforced cement composite (PFRCC) is idealized as a unit cell and it consists of a square shaped aggregate volume fraction surrounded by a matrix of polypropylene fiber reinforced mortar. This idealization of uniform aggregate distribution helps in reducing the required computational effort and assists in studying the shape and size effects of the aggregate volume fraction on the macroscopic properties of the material. The idealized unit cell model with probable orientations of the aggregate volume fraction is shown in Figure 2.
Figure 2: Probable orientations of the square shaped aggregate volume fraction in the meshed unit cell model The unit cell with a single aggregate indicates that the aggregate distribution is considered regular within the mortar matrix that is reinforced with particulate polymer fibers. Conceptually, current unit cell is a representation of the volume fractions of various constituents of the material meso structure and the shape of the volume fraction has only global effects on the material properties. This unit cell is designed primarily for the purpose of capturing the varying compressive strength of the PFRCC with increasing aggregate volume fraction.
Next step essential in the unit cell approach is the formulation of appropriate boundary conditions that would ensure periodicity of the unit cell. Since the current unit cell being a two dimensional model surrounded by similar unit cells on either sides, deformation of current unit cell should be compatible with that of the adjoining unit cells. In order to ensure this displacement compatibility, periodic boundary conditions are applied as discussed by Van der Sluis [9]. Periodic boundary conditions applied on unit cell are given in Equation (1).
, ,
1, 2,....
l r a b
i j
u
u
u
u
i j
n
(1)where
u
ilandu
rjare respectively the displacements of nodes iand j located on the left and right edges of the finite element mesh of the unit cell. Relative displacement of nodes on either edges of the mesh are equated to the relative displacements of master nodes denoted by a and b.
3.
SCRIPT ENHANCED UNIT CELL
Having defined various aspects behind the procedures in unit cell approach, now it is possible to identify the elements that can be programmed to accept inputs progressively without any manual intervention. This optimization is based on the fact that almost all independent software packages require inputs for its functioning and the time taken for manual inputs are much higher compared to the automated inputs. It is always possible to program a computer to iterate a number of steps based on the status of a logical condition.
Automation scripts may be developed to create the geometric model of the unit cell, to assign various material properties for different phases of the unit cell, to create a decently sized mesh on the geometry of the unit cell satisfying a mesh convergence criteria, to assign different displacement and loading conditions on the unit cell, to create and submit a job specifying the resource allocation criteria, and to extract the required outputs from the available results. However there are a set of procedures in unit cell approach that are primarily repetitive in nature and at the same time almost impossible to perform manually. In such a situation, a script comes handy for an engineer in saving an enormous amount of time that is unnecessarily consumed otherwise. The term Script Enhanced Unit Cell does not refer to the automation of usual procedures in a pre or post processing package.
A python script developed for applying periodic boundary conditions to a set of nodes in the finite element mesh of the unit cell model is focused here. This script can identify all the four edges of the matrix phase of the unit cell and store the Cartesian coordinates of the nodes of required edges into a named array. It can classify different nodes where boundary conditions and constraints need to be applied and assign them to various sets in a dynamic manner. Once the nodal coordinates of the right and left edges of the unit cell are assigned with an array variable, it is required to sort them in an ascending or descending order, based on its position on the unit cell. There may be a provision in the coding algorithm to verify this before applying any specific conditions or rules on the nodes. The type of the order of the coordinates is decided based on the node numbering algorithm followed by the finite element meshing software. A typical sorting algorithm is given by the following python script
for i in range(nodes): for j in range(i+1,nodes):
if NodeLabelCoord[i,1]<NodeLabelCoord[j,1]: LabelBuffer=NodeLabelCoord[i,0]
NodeLabelCoord[i,0]=NodeLabelCoord[j,0] NodeLabelCoord[j,0]=LabelBuffer
After sorting the nodes, there is a set generation process that helps the script at a later stage to identify the node sequence as well as whether each node belongs to the right edge or the left edge. As an illustration, the following script can assign a set name to the third left edge node.
mdb.models['M'].parts['m'].Set(nodes=mdb.m['M'].parts['m'].n odes[2:3], name='L3')
Periodic Boundary Condition requires that the vertical and parallel edges on either sides of the unit cell remain parallel even after the deformation. This is achieved by assigning displacement rules to the nodes on either side using an equation constraint. A PBC as defined by the equation (1) can be represented by the following python script.
mdb.models['M'].Equation(name='PBC'), terms=((1.0, 'm.R1', 1), (-1.0, 'm.L1', 1), (-1.0, 'm.R', 1), (1, 'm.L', 1))
When compared to the usual method of creating an equation constraint with the help of a graphical user interface that consumes a minimum of 15 to 20 seconds, the script can do the job in a matter of a few milliseconds depending on the computing capabilities of the processing unit. When there are hundreds of such equation constraints to be applied repeatedly on a large number of nodes, the script can save an enormous amount of time.
Further to this, a script that focuses on creating job steps for simulating displacement controlled loading of the specimen is also essential. When there are only one or two steps required for the analysis, the GUI method may be very much acceptable. But when it is required to capture the material behaviour for a number of very small incremental displacement steps with varying time intervals, the script will help to save an enormous amount of preprocessing time.
4.
PFRCC MODELLING
Polymer Fiber Reinforced Cement Composite being a particulate composite with coarse aggregate and cement mortar as major constituents, it can be modeled using unit cell approach with a minimum of two different phases. One can be the aggregate phase with higher elastic modulus and Poisson’s ratio. The second phase can be the phase that represents the combined properties of plain mortar and polymer fiber reinforcement. It was concluded that the fibers need not be included as a third phase considering the dimensional similarity with other constituents in the matrix phase and the mortar matrix as a whole may be considered as a homogeneous material. Properties of fiber reinforced mortar matrix were taken from the results of an experimental investigation that was conducted as part of a research program by Pavan Kumar [10] and those adopted mechanical properties are as shown in Table 1.
Table 1: Material properties used in the simulation using unit cell approach
PFR mortar matrix
Aggregate Fiber
E (GPa) 33.50 87.0 003.5
Poisson’s ratio 00.27 00.3 -
Fracture Energy (Nm/m2)
00.20 - -
Tensile Strength (MPa)
06.00 - 550.0
[image:3.595.338.525.589.717.2]Mix proportions of the mortar phase are given in the pie diagram shown in Figure 3.
Figure 3: Mix proportions adopted for the modelling of Fiber Reinforced mortar matrix phase
Pavan Kumar [10]. Other ingredients of the matrix are similar to that considered for a normal cement composite mortar.
4.1
Aggregate modelling
Approximately 40% volume fraction of the composite material can be accounted by the presence of coarse aggregates where majority of the contribution is made by gravel aggregates followed by crushed stones. Shape of the aggregate particles depends on the type of aggregate wherein gravel aggregates are observed to be without sharp corners and round in shape while crushed stone aggregates are angular in shape with a number of edges and corners. In the current work a gravel aggregate volume fraction is considered and is modeled as a circular inclusion in the unit cell with linear isotropic behaviour.
4.2
Fiber reinforced matrix modelling
Fiber reinforced mortar matrix shows clear softening behaviour once it gets loaded above its peak strength and the same may be captured in a numerical model by making use of its stress separation curve. Formation of a fracture process zone due to the progressive initiation and propagation of microcracks within the mortar material may be the reason for this behaviour. This softening behaviour is assumed to be localized in a fictitious crack where stress transfer may still exist in a direction normal to the direction of propagation of crack. The stress transfer capacity as a function of the crack opening displacement is as shown in Figure 4. In order to calculate the fracture energy of the matrix material, it is only required to measure the area under this curve. In the current work, Gf is calculated from the experimental results of Pavan
[image:4.595.336.522.98.274.2]Kumar [10].
Figure 4: Stress relaxation curve for the PFRC matrix The constitutive behaviour of the matrix material is formulated as a brittle cracking one based on Hillerborg’s [11] fictitious crack model. This model depends on a smeared crack approach to represent the discontinuous brittle behaviour of the mortar matrix. Stress-separation relation as shown in Figure 4 was calculated from CEB-FIP model code 1990 which recommends a bilinear stress-crack opening relationship given in Equation (2).
1
1
1
1 0.085 for 0.15
0.15
for 0 0.15 (2)
2
0.15 and
ct ctm ctm ct ctm
ctm
ct c ct ctm
c
f f
c c f
ctm ctm
w
f f f
w
f
w w f
w w
G G
where w w w
f f
where
f
ctm is direct tensile strength of the matrix in MPa,ct
is cracked tensile stress in MPa, w1 is crack opening,c
w
is crack opening for
ct= 0 andβ
f is a coefficient thatdepends on maximum aggregate size whose value is 8, as recommended by CEB-FIP model code 1990.
Figure 5: The stress envelop suggested by Rankine criteria A simple Rankine criterion represented by the stress envelope as shown in Figure 5 was used to detect crack initiation. This criterion suggests that the maximum principal tensile stress when exceeds on any region under the matrix domain over and above the tensile strength of the material under consideration, a crack has to be initiated. Thus it suggests a Mode I fracture for crack initiation whereas postcracked behaviour includes Mode II as well as Mode I. The Mode II shear behaviour depends on the extent to which the crack has been opened and this general observation can be represented according to Equation (3).
(3) where post crack shear modulusuncracked shear modulus crack opening strain shear retention factor
ck
c nn
c
ck nn
G e G G G e
5.
RESULTS
5.1
Compression response of the unit cell
Focus of this paper is to numerically simulate and predict the compression failure using unit cell approach in an FEA solver software package. The unit cell model used for this purpose is a representation of the aggregate volume fraction in a square shape and is surrounded by that of polypropylene fiber reinforced mortar matrix. For the FEA solver, the unit cell consists of two separately created and meshed parts with two different materials assigned to each of them. The outer nodes of the aggregate part and the corresponding inner nodes of the matrix part are constrained together in such a way that there won’t be any slip between these nodes. After applying Periodic Boundary Conditions on the vertical edges of the unit cell, central node of the bottom edge of the unit cell is hinged while all other bottom edge nodes are arrested in vertical direction, so that only horizontal displacements are permitted for these nodes. Similarly, the central node of the top edge of the unit cell is also to be arrested in the horizontal direction to ensure symmetrical deformation on either side of the unit cell. Displacement controlled compressive loading is applied on the top edge of the matrix by applying displacement boundary conditions in an incremental manner.
Table 2 shows peak compressive strength predicted by the computer simulation. GFRCC results are taken from [12] and normal concrete results are taken from [3].
0 1 2 3 4 5 6 7
0 0.1 0.2 0.3
S
tr
ess,
M
P
a
[image:4.595.60.265.412.510.2]Table 2: Values of compressive strength in MPa predicted by the unit cell simulation [3][12]
VF (%)
GFRCC, Round Aggregate
PFRCC, Square Aggregate Normal Concrete 0
degree 22.5 degree
45 degree
2 - - - - 20.7
5 118 - - - 19.5
13 95 69 81 93 18.3
28 85 56 58 57 -
45 - 64 56 50 -
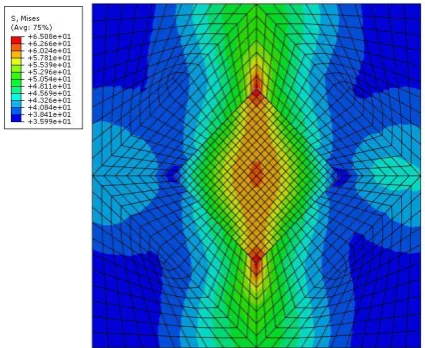
[image:5.595.323.537.104.222.2]Maximum principal stress contour plot obtained from the numerical simulations is presented in the Figure 6. Since the unit cell with soft matrix and stiff aggregate is subjected to compressive load, matrix around the aggregate tends to flow around the aggregate. Because of the mismatch in Poison’s ratio and Young’s modulus, the matrix above and below the aggregate is confined and a state of compression is developed above and below the aggregate. Due to flow of matrix around the aggregate splitting force pulls the matrix away from the aggregate. Due to this splitting force, tensile zone is developed where maximum principal stress reaches the tensile strength of the matrix.
Figure 6: Stress Contour Plot predicted by the unit cell simulation
Red zone in Figure 6 indicates the tensile zone where stress is higher and this tends to split the matrix and blue region above and below corresponds to the zone where stress is comparatively lower. The highest stress shown is being shared by a major portion of the aggregate volume fraction and by a minor portion of the matrix volume fraction. Since the matrix material is weaker in its mechanical characteristics, failure will occur in the matrix region nearer to the highly tensed aggregate region. Failure in the matrix occurs when the maximum principal stress in the elements falling under tensile zone attains the tensile strength of the matrix. Therefore it is clear that failure of heterogeneous materials like concrete is essentially due to tensile failure at the microstructural level of the material. This has been confirmed by Ghouse et al. [13] in his analysis of low strength normal concrete under tension using a similarly idealized unit cell.
Figures 7-9 shows the stress strain diagram of the numerically modeled specimen as predicted by unit cell approach for three different aggregate volume fractions (VF) in ascending order. The compressive strength of the specimen may be observed to
be dependent on its aggregate volume fraction while simulating its compressive behaviour.
[image:5.595.326.535.262.383.2]Figure 7: Stress Strain diagram for 0 degree orientation of the square shaped aggregate volume fraction
Figure 8: Stress Strain diagram for 22.5 degree orientation of the square shaped aggregate volume
[image:5.595.321.537.262.549.2]fraction
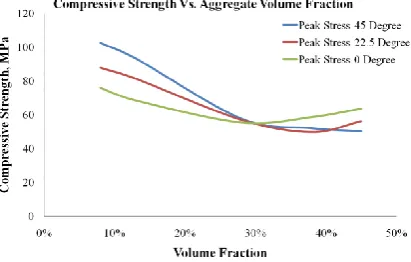
[image:5.595.59.272.344.518.2]an aggregate volume fraction of 13%, the peak stress predicted is approximately 93MPa and when the aggregate volume fraction is gradually increased to 28%, the peak stress shows a gradual decrease till 57MPa. When the volume fraction is further increased to 45%, the peak stress predicted seems to have a slight decrease to a value of 50MPa.
Figure 10: Variation of Peak Compressive Stress as predicted by the computer simulation using unit cell
approach
Another interesting trend predicted by the simulation is the dependency of the stiffness of the material with its aggregate volume fraction. From Figures 7 to 9, it is observed that there is a continuously increasing trend in the slope of the stress strain curve as the volume fraction increases from 13% to 45%. This phenomenon can be explained by considering the increasing contribution of the aggregate material in the overall macroscopic properties of the cement composite.
Finally the objective of this analysis is to predict the variation of compressive strength of the cement composite with respect to varying aggregate volume fractions as shown in Figures 7-10.
6.
CONCLUSION
A regular Unit cell approach was sufficient for predicting the behaviour of a single unit cell with a coarser mesh using a finite element solver. However when a parametric study was to be conducted by varying the size and orientation of the aggregate volume fraction, the procedures for redesigning the unit cell and reassigning displacement constraints to each and every required node became extremely time consuming. This has led to the development of a python script to automate some of the repetitive tasks in the procedure and significantly reduce the pre processing time. The analysis could predict the decreasing trend of compressive strength of the specimen and increasing trend of the stiffness of the material with respect to the increasing aggregate volume fraction. The accuracy of prediction may possibly be improved by redesigning the unit cell and considering the possibilities of fiber as a separate phase in the unit cell.
7.
REFERENCES
[1] Kouznetsova, V., W. A. M. Brekelmans, and F. P. T Baaijen, 2001, “An approach to micro-macro modelling of heterogeneous materials”, Computational Mechanics, 27, 37-48
[2] Gitman, I. M., H. Askes and L. J. Sluys, 2008, “Coupled-volume multi-scale modelling of quasi-brittle material”,
European Journal of Mechanics A/Solids, 27, 302-327 [3] Ghouse, M. D., Lakshmana Rao, C. and Rao, B. N.,
2010, “Numerical Simulation of Fracture Process in Cement Concrete Using Unit Cell Approach”, International Journal of Mechanics of Advanced Materials and Structures, 17(7), pp.481-487
[4] Sunir Hassan, Lakshmana Rao, C. and Ganesh Babu, K., 2011, “Unit Cell Approach as a Multi Scale Modelling Technique for Predicting the Behaviour Of Fiber Reinforced High Strength Concrete Under Compression”, Proc. ASME International Mechanical Engineering Congress and Exposition – 2011, Denver, Colorado, USA.
[5] Md. Golam Rashed, Raquib Ahsan and Sharmin Reza Chowdhury. Article: Numerical Modelling of Concrete Tensile Strength Test by Wrapping Scripting Language with Compiled Library. International Journal of Computer Applications 40(14):34-38, February 2012. Published by Foundation of Computer Science, New York, USA
[6] Hill, R., 1963, “Elastic Properties of Reinforced Solids: Some Theoretical Principles”, Engineering Journal of the Mechanics and Physics of Solids, Pergamon Press Ltd. Great Britain, 11, pp. 357-372.
[7] Hashin, Z., 1983, “Analysis of composite materials, A survey”, Journal of Applied Mechanics, 50, pp. 481-505
[8] Lemaitre, J, 1987, “Continuum Damage Mechanics Theory and Applications”, Springer, Wien-New York [9] Van der Sluis, O., P. J. G. Schreurs, W. A. M.
Brekelmans and H. E. H. Meijer, 2000, “Overall behaviour of heterogeneous elastoviscoplastic materials: effect of microstructural modelling”, Mechanics of Materials, 32, 449-462
[10]Pavan Kumar D., 2005, “Development of behavioural characteristics of high strength high performance mixed fiber reinforced cementitious composites”, Ph.D Thesis, Indian Institute of Technology Madras
[11]Hillerborg, A., M. Modeer and P. E. Petersson, 1976, “Analysis of crack formation and crack growth in concrete by means of fracture mechanics and finite elements”, Cement and Concrete Research, 6, 773-782
[12]Sunir Hassan, Lakshmana Rao, C. and Ganesh Babu K., 2011, “C040 - Mesoscale Modelling of Glass Fiber Reinforced High Strength Cement Composite under Compression (Unit Cell Approach)”, Proc. The International Conference on Composites for the 21st Century: Current & Future Trends, IISc Banglore, India. [13]Ghouse M. D., Lakshmana Rao C., and Rao B. N., 2011,
“Numerical modelling of failure of cement concrete using a unit cell approach”, Sadhana, Indian Academy of Sciences, 36/1, 35-51
8.
AUTHOR’S PROFILE
Sunir Hassan is a Ph. D research scholar at Indian Institute of Technology Madras and a Student Member of the American Society of Mechanical Engineers. He was awarded a Masters Degree in Aerospace Engineering (2008) from IIT Madras and a Bachelors Degree in Mechanical Engineering (2003) from Mahatma Gandhi University, India

![Table 2 shows peak compressive strength predicted by the computer simulation. GFRCC results are taken from [12] and normal concrete results are taken from [3]](https://thumb-us.123doks.com/thumbv2/123dok_us/8118361.793355/4.595.336.522.98.274/compressive-strength-predicted-computer-simulation-results-concrete-results.webp)