http://dx.doi.org/10.4236/jhrss.2014.23013
Verification of Hypothesis of “Six Patterns of
Paid Vacation Use”: An Exploration of Six
Patterns of Paid Vacation Usage and Number
of Days Taken
Go Igusa
J.F. Oberlin University, Tokyo, Japan Email: [email protected]
Received 20 June 2014; revised 27 July 2014; accepted 11 August 2014 Copyright © 2014 by author and Scientific Research Publishing Inc.
This work is licensed under the Creative Commons Attribution International License (CC BY).
http://creativecommons.org/licenses/by/4.0/
Abstract
In this study a survey using questionnaires was conducted to understand the actual condition of the relationship between methods for taking paid vacation and its usage rate, to focus on verifying the relationship quantitatively by empirical analysis, and to present a plan to promote paid vaca-tion usage. The simple tabulavaca-tion did not reveal a distinct difference in the number of days taken as paid vacation among the usage methods; however, by making the other conditions constant, the number of days taken as paid vacation by those adopting a share method was significantly high. In other words, by recommending the share method at a workplace, it is possible that the paid vaca-tion usage condivaca-tion improves considerably. In order for this method to operate effectively, the paper proposed that “efforts to utilize human resources” is necessary so that personnel who can replace the work of employees taking paid vacation are prepared.
Keywords
Paid Vacation, Share Method, Progressive Method, Regressive Method, Self-Pay Method
1. Introduction
1.1. Awareness of Issues
vacation was considered a serious commitment of a worker to a company, and was recognized by researchers as an “unwritten rule” in the society.
In Japan, there have been various labor issues such as an increase of part-time workers and NEET, diversifi-cation of employment patterns, rationalization derived from globalization and corporate downsizing. The paid vacation issue is not only one of serious labor issues, but it is closely related to many other labor issues. Fur-thermore, in recent years, commitment to a company by Japanese workers has changed: The awareness has been changing from “do not take paid vacation” to “cannot take paid vacation”. It is suggested that research or a study that can contribute to the promotion of paid vacation usage is necessary.
1.2. Study Subjects
This paper aims to present a plan for promoting paid vacation usage. For this purpose, the “replacement problem” or “management of paid vacation”, the biggest inhibiting factor for paid vacation usage, was clarified using a qualitative analysis method generated from outstanding research on paid vacations in the past, the actual rela-tionship between methods of usage and paid vacation usage rates was confirmed and this paper considered what kind of operation management would be applicable to paid vacation in order to improve paid vacation usage rates.
2. Preceding Studies
Preceding studies considered to be significant are organized in chronological order in reference to the paper’s interest in capturing and interpreting “administration of paid vacation” from multiple aspects. Specifically, re-search with paid vacation usage as a main subject and peripheral rere-search related to paid vacation (childcare leave, etc.) were discussed and study subjects were presented.
Matsuzaki [2] presented a calculation method that takes into account non-work days as well as vacation days within manufacturing industries that require an advanced division of labor and cooperation. According to this method the number of replacement workers is defined by the number of factory operation days and vacation days, as shown in the following formula:
vacation days
Non-work day addition rate 100
annual factory operation days vacation days
= ×
−
In this formula, if the annual factory operation days are defined as 365 days, a workplace with continuous op-eration will require the following non-work days to be added depending on vacation days:
<When the number of annual vacation days is 68>
68
Addition rate 100 23%
365 68
= ×
−
In other words, if the number of annual vacation days is 68, the net personnel will increase by 23%. When considering paid vacation usage, the addition rate increases as the vacation days in this formula increase. If con-tinuous operation has to stop due to lack of personnel caused by employees taking vacation, the company will lose profits; in order to avoid such a large risk, a personnel plan that takes vacation such as paid vacation into an account is prepared. However, although a calculation formula for obtaining the number of replacement workers for paid vacation is indicated, the relevant research does not include a method for how to rotate personnel.
Wakisaka [3] “Conditions and Issues for Utilizing Childcare Leave System at a Workplace” clarifies that two methods, a “share” method and a “progressive” method, are used for administering childcare operation at a workplace. The “share” method is to divide a task and add a portion for colleagues. The “progressive” method pushes employees in a chain-reaction waywhen one of them takes vacation. The research concludes “the former can increase productivity in the short term but the latter has more advantages in the long term”. However, paid vacation is different from childcare leave in that the vacation time is short and it is often taken in segments. Therefore, its rotation method and selection criteria are also different from that of childcare leave.
beha-vioral types.
Specifically, using opportunistic sampling, Igusa [4] conducted semi-structured interviews with 49 workers who are full-time employees or staff members. By utilizing a qualitative and descriptive research method, the study defines “six patterns of paid vacation use” (share, progressive, regressive, self-pay in advance, self-pay in arrears and self-pay by working at home) as follows:
1) Share method: The task of an employee taking paid vacation is divided into small portions to be shared by his/her colleagues. This method was observed relatively more in a workplace where many employees are en-gaged in the same tasks. The number of employees taking paid vacation who used this method was the highest, and the paid vacation usage rate was also high. Therefore, one may infer that it is easier to take paid vacation using this method over others.
2) Progressive method: The task of an employee taking paid vacation is performed by another employee whose task is one-rank easier. This method was mainly used by workers with advanced careers. Even if there are many employees in the entire workplace, the number of workers engaged in the same task becomes less as the career advances. Therefore in this case, the share method does not function effectively, so workers with ad-vanced careers take paid vacation using the progressive method.
3) Regressive method: The task of an employee taking paid vacation is covered by his/her superior within the same group, team or section. This method was observed in a workplace with a small number of employees, thus a small number of workers could manage the same task. This method requires that the superior acknowledges some understanding for paid vacation usage.
4) Self-pay method (advance, arrears, work at home): The task on the paid vacation day is managed by the employee taking paid vacation rather than by another employee. The paid vacation usage rate of workers utiliz-ing this method was relatively low. This method was more significant in cases where the amount of work is al-ways big, and particularly when a manager or a superior does not support paid vacation.
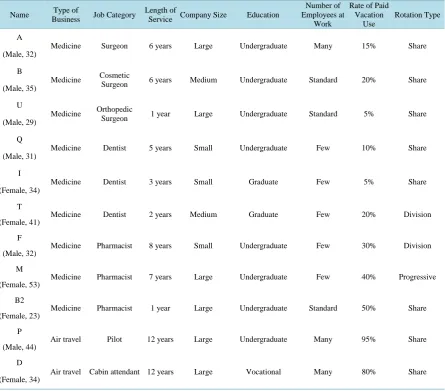
The research then examined the relationship between the paid vacation usage rate and the usage methods us-ingTable 1, which reorganizes the attributes of interview subjects into: Types of business → job categories → length of service. The research further pointed out the importance of various efforts for workload management, utilization of personnel and diverse creative efforts at a workplace. However, in order to discuss the relationship between the paid vacation usage rate and the usage methods, it is not sufficient to simply reorder the variables. It is important to measure results by making other conditions constant.
Upon reviewing the preceding studies regarding the “management of paid vacation” and the peripheral studies, it can be noted that, for understanding quantitatively the relationship between the paid vacation usage rate and the usage methods, there is a limit derived from research methods. This is observed in Igusa [4], which referred to 1) Matsuzaki [2] (1982) and 2) Wakisaka [3] and conducted interviews with employees at a workplace and clarified the difference in the characteristics of rotation patterns for taking paid vacation. In other words, since the research adopted only the case study method based on intensive observation through interviews, the nature and tendency of the subject group was not accurately captured. The number of samples in this research was ex-tremely small compared to larger surveys and its representativeness was not ensured by random sampling or other sampling techniques. Enhancing random sampling, representativeness and comparability is important for conducting scientific research. Therefore, this study aims to find clues for promoting paid vacation usage by understanding the actual situation of the relationship between the paid vacation usage rates and the usage me-thod based on questionnaires, followed by empirical analysis to confirm the results quantitatively.
3. Outline of Questionnaires and the Summary of Count Results
The survey was conducted by reviewing questions in reference to the research outcomes concerning the man-agement of paid vacation (described in Chapter 2), targeting full-time employees, 20 - 59 years old, among the monitors across Japan retained by a private research company (Gain, Inc.) and using the Internet (the range of subject age was based on the latest “Survey on Paid Vacation Use”). Regarding sampling, random sampling was chosen. The period that the survey was conducted was four days, from May 1 to May 4, 2013. The number of questionnaires distributed was 535, the number of recovered questionnaires was 423 (recovery rate 79.1%). As a result of removing invalid questionnaires and processing abnormal values of valid questionnaires, the sample size for the analysis became 201.
Table 1.Individual and workplace attributes of interview subjects and rotation types.
Name Type of
Business Job Category
Length of
Service Company Size Education
Number of Employees at
Work
Rate of Paid Vacation
Use
Rotation Type
A
Medicine Surgeon 6 years Large Undergraduate Many 15% Share
(Male, 32)
B
Medicine Cosmetic
Surgeon 6 years Medium Undergraduate Standard 20% Share
(Male, 35)
U
Medicine Orthopedic
Surgeon 1 year Large Undergraduate Standard 5% Share
(Male, 29)
Q
Medicine Dentist 5 years Small Undergraduate Few 10% Share
(Male, 31)
I
Medicine Dentist 3 years Small Graduate Few 5% Share
(Female, 34)
T
Medicine Dentist 2 years Medium Graduate Few 20% Division
(Female, 41)
F
Medicine Pharmacist 8 years Small Undergraduate Few 30% Division
(Male, 32)
M
Medicine Pharmacist 7 years Large Undergraduate Few 40% Progressive
(Female, 53)
B2
Medicine Pharmacist 1 year Large Undergraduate Standard 50% Share
(Female, 23)
P
Air travel Pilot 12 years Large Undergraduate Many 95% Share
(Male, 44)
D
Air travel Cabin attendant 12 years Large Vocational Many 80% Share
(Female, 34)
Note 1: Interview subjects E and others are omitted. Source: Igusa [4] “Six Patterns of Paid Vacation Use: A Study Concerning the Management of Paid Vacation at a Workplace Level,” Annual Review of Japanese Association of Labor Sociology, 22:86-87; 2011.
end of this paper. Here, the results of simple tabulation regarding the relationship between the paid vacation usage and the usage methods are introduced. The rate of employees who took paid vacation and each usage me-thod are shown inTable 2;Table 3 indicates the number of paid vacation days taken by each usage method.
The number of those who took paid vacation using the “self-pay (advance)” method was the highest (44.7%), followed by the “share” method (28.2%).
As for the number of paid vacation days taken by usage method, the “progressive” method was the highest (10.1 days), followed by the “self-pay (arrears)” (8.7 days). Although the difference of paid vacation days taken by usage method was verified using the analysis of variance for one-way layout, there was no significant differ-ence (F(5,341) = 1.20, p > 0.10).
4. Variables/Analysis Method and Results
Table 2. Rate of employees who took paid vacation using each usage method.
Paid Vacation Usage Methods
Share Progressive Regressive Self-Pay, Advance Self-Pay, Arrear Self-Pay, Work at Home
Mean 7.4 10.1 6.0 7.3 8 6.2
Standard
Deviation 6.4 6.4 6.3 6.0 6.9 7.8
Table 3. Number of paid vacation days taken by each use method.
Paid Vacation Usage Methods
Share Progressive Regressive Self-Pay, Advance Self-Pay, Arrear Self-Pay, Work at Home
Frequency
(Rate) 98 (28.2%) 15 (4.3%) 23 (6.6%) 155 (44.7%) 45 (13.0%) 11 (3.2%)
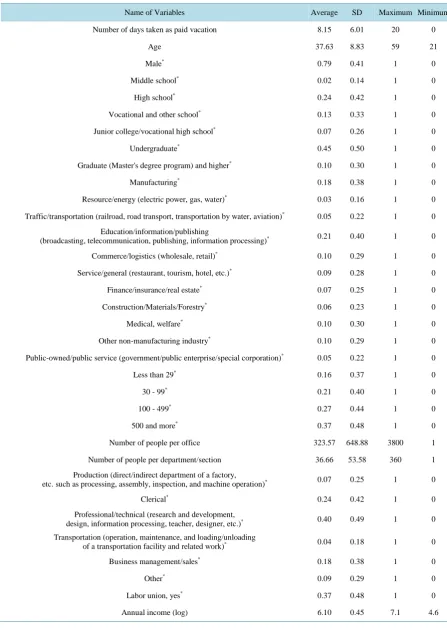
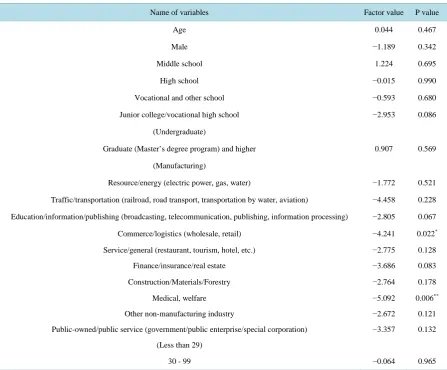
In order to study the influence of the usage methods on paid vacation income, a dummy variable was used as an independent variable for each usage method. For control variables, variables related to the basic attributes and work styles as well as actual working hours per week and the number of predetermined non-work days per week were used. The descriptive statistics of variables used for the analysis are shown inTable 4; the results are indicated in Table 5.
The following can be gleaned from this. First of all, it can be understood that the share method and the self-pay method (work at home) become significant and that there is a clear difference in the number of paid vacation days depending on method of usage.
Secondly, it can be understood that if suitable workload management is implemented to correspond to per-sonnel, this has a real effect on the number of paid vacation days.
Thirdly, as a reference, we would like to compare samples that were collected through internet research and the results of qualitative analysis of these with the results of previous research by Ogura [1] in which samples were collected through a large-scale survey with the number of paid vacation days as dependent variables. Ogura [1] discovered that the larger the company, the higher the yearly salary and the more paid vacation days that are granted, the easier it is for workers to take paid vacations. In addition, there are differences between in-dustries and it has been discovered that it is difficult for workers in the service industry to take paid vacation.
In response, the higher the number of paid vacation days that are granted, the more paid vacations days are taken in this model, too. In addition, the number of paid vacation days for workers in wholesale, retail, medi-cine/welfare of who many are in the service industry, is low. From here, it can be understood that the results of analysis of this study using internet research are consistent with the results of analysis of previous research to a certain extent.
5. Discussion and Conclusions
Table 4. Descriptive statistics.
Name of Variables Average SD Maximum Minimum
Number of days taken as paid vacation 8.15 6.01 20 0
Age 37.63 8.83 59 21
Male* 0.79 0.41 1 0
Middle school* 0.02 0.14 1 0
High school* 0.24 0.42 1 0
Vocational and other school* 0.13 0.33 1 0
Junior college/vocational high school* 0.07 0.26 1 0
Undergraduate* 0.45 0.50 1 0
Graduate (Master's degree program) and higher* 0.10 0.30 1 0
Manufacturing* 0.18 0.38 1 0
Resource/energy (electric power, gas, water)* 0.03 0.16 1 0
Traffic/transportation (railroad, road transport, transportation by water, aviation)* 0.05 0.22 1 0
Education/information/publishing
(broadcasting, telecommunication, publishing, information processing)* 0.21 0.40 1 0
Commerce/logistics (wholesale, retail)* 0.10 0.29 1 0
Service/general (restaurant, tourism, hotel, etc.)* 0.09 0.28 1 0
Finance/insurance/real estate* 0.07 0.25 1 0
Construction/Materials/Forestry* 0.06 0.23 1 0
Medical, welfare* 0.10 0.30 1 0
Other non-manufacturing industry* 0.10 0.29 1 0
Public-owned/public service (government/public enterprise/special corporation)* 0.05 0.22 1 0
Less than 29* 0.16 0.37 1 0
30 - 99* 0.21 0.40 1 0
100 - 499* 0.27 0.44 1 0
500 and more* 0.37 0.48 1 0
Number of people per office 323.57 648.88 3800 1
Number of people per department/section 36.66 53.58 360 1
Production (direct/indirect department of a factory,
etc. such as processing, assembly, inspection, and machine operation)* 0.07 0.25 1 0
Clerical* 0.24 0.42 1 0
Professional/technical (research and development,
design, information processing, teacher, designer, etc.)* 0.40 0.49 1 0
Transportation (operation, maintenance, and loading/unloading
of a transportation facility and related work)* 0.04 0.18 1 0
Business management/sales* 0.18 0.38 1 0
Other* 0.09 0.29 1 0
Labor union, yes* 0.37 0.48 1 0
Continued
Actual working hours per week 46.80 9.13 90 30
Predetermined non-work days per week 1.93 0.25 3 1
Paid vacation days given 15.96 5.12 28 5
Share method* 0.26 0.44 1 0
Progressive method* 0.05 0.21 1 0
Regressive method* 0.07 0.26 1 0
Self-pay method (advance)* 0.46 0.50 1 0
Self-pay method (arrears)* 0.15 0.36 1 0
Self-pay method (work at home)* 0.02 0.14 1 0
Information sharing* 0.78 0.42 1 0
Sensitivity to other employees* 0.68 0.47 1 0
Work load management appropriate for personnel* 0.50 0.50 1 0
[image:7.595.90.538.351.721.2]Note 1: SD = Standard Deviation. Note 2: Sample Size = 201. Note 3: * = Dummy Variable.
Table 5.Influence of usage methods on paid vacation usage (censored model). Dependent Variable = Number of Paid Vaca-tions used. Sample Size = 201. Left Censored Obs = 25. Log likelihood = 566.542.
Name of variables Factor value P value
Age 0.044 0.467
Male −1.189 0.342
Middle school 1.224 0.695
High school −0.015 0.990
Vocational and other school −0.593 0.680
Junior college/vocational high school −2.953 0.086
(Undergraduate)
Graduate (Master’s degree program) and higher 0.907 0.569
(Manufacturing)
Resource/energy (electric power, gas, water) −1.772 0.521
Traffic/transportation (railroad, road transport, transportation by water, aviation) −4.458 0.228
Education/information/publishing (broadcasting, telecommunication, publishing, information processing) −2.805 0.067
Commerce/logistics (wholesale, retail) −4.241 0.022*
Service/general (restaurant, tourism, hotel, etc.) −2.775 0.128
Finance/insurance/real estate −3.686 0.083
Construction/Materials/Forestry −2.764 0.178
Medical, welfare −5.092 0.006**
Other non-manufacturing industry −2.672 0.121
Public-owned/public service (government/public enterprise/special corporation) −3.357 0.132
(Less than 29)
Continued
100 - 499 −0.457 0.749
500 and more −0.153 0.927
Number of people per office −0.001 0.450
Number of people per department/section 0.007 0.386
Production (direct/indirect department of a factory, etc. such as processing, assembly, inspection, and machine operation)
Clerical 2.292 0.285
Professional/technical (research and development, design, information processing, teacher, designer, etc.) 2.834 0.159
Transportation (operation, maintenance, and loading/unloading of a transportation facility and related work) 3.522 0.439
Business management/sales −2.101 0.344
Other 1.042 0.651
Labor union, yes −1.853 0.062
Annual income (log) −0.253 0.782
Actual working hours per week −0.082 0.099
Predetermined non-work days per week 2.113 0.148
Paid vacation days given 0.458 0.000***
Share method 3.846 0.027*
Progressive method 4.601 0.056
(Regressive method)
Self-pay method (advance) 3.127 0.074
Self-pay method (arrears) 3.070 0.113
Self-pay method (work at home) 6.966 0.032*
Information sharing −0.276 0.797
Sensitivity to other employees −1.477 0.105
Work load management appropriate for personnel 2.442 0.007**
Note 1: Estimated by the author. Note 2: Significant at the *5%; **1%; ***0.1% levels.
employees who utilized the “self-pay (advance)” method, which is the case in which replacement of work when taking paid vacation is difficult, was the highest; if enhancing interchangeability of work is successful, it is ex-pected that workers will shift from the self-pay (advance) method to the share method, leading to a certain effect in increasing paid vacation usage.
in which there is an issue of people even taking the paid vacation to which they are entitled is a barrier to the usage of paid vacation.
This paper focused on understanding the actual situation of the relationship between the paid vacation usage rate and the usage methods through questionnaires and quantitatively verifying the relationship using empirical analysis. However, since the rates of those who take paid vacation are different among the usage methods, it is necessary to maintain a constant sample size of each method by using stratified sampling, etc. in order to ana-lyze the relationship more precisely. It is expected that a fundamental solution for the issue of unused paid vaca-tion will be explored in future research.
Conflict of Interest
The author has no conflict of interest to declare.
References
[1] Ogura, K. (2003) Behaviors Concerning Paid Vacation Usage by Japanese—Economic Analysis of Paid Vacation. Ja-pan Institute of Labour, JaJa-pan.
[2] Matsuzaki, Y. (1982) Analysis on Steel Industry in Japan. Nippon Hyoron Sha, Japan.
[3] Wakisaka, A. (2002) Conditions and Issues for Utilizing Childcare Leave System at a Workplace. Japan Institute of
Labour Magazine, 44, 4-14.
[4] Igusa, G. (2011) Six Patterns of Paid Vacation Use: A Study Concerning the Management of Paid Vacation at a Workplace Level. Annual Review of Japanese Association of Labor Sociology, 22, 75-105.
[5] Hazama, H. (1989) Management Sociology. Yuhikaku Publishing, Japan.
[6] Wrinkler, D. (1980) The Effects of Sick-Leave Policy on Teacher Absenteeism. Industrial and Labor Relations Review, 33, 232-240. http://dx.doi.org/10.2307/2522452
Appendix
Survey Sheet
Survey on Paid Vacation Usage (2013) Please answer the following questions about yourself:
What is your highest educational achievement? (Please choose one).
1 Middle school 4%
2 High school 20%
3 Vocational/other school 14%
4 Junior college/vocational high school 8%
5 Undergraduate school 44%
6 Graduate school (master’s degree) and higher 7%
What is the main type of business of the company/office you work for? (Please choose one). 1 Manufacturing 20%
2 Resource/energy (electric power, gas, water) 1%
3 Traffic/Transportation (railroad, road transport, transportation by water, aviation) 4%
4 Education/information/publishing (broadcasting, telecommunication, publishing, information processing) 17%
5 Commerce/logistics (wholesale, retail) 12%
6 Service/general (restaurants, tourism, hotels, etc.) 11%
7 Finance/insurance/real estate 4%
8 Construction/materials/forestry 4%
9 Medical, welfare 8%
10 Other non-manufacturing industry 10%
11 Public-owned/public service (government, public enterprise, special corporation) 4%
Which of the following options best describes the number of employees at your workplace (entire company)? (Please choose one). 1 29 or less 22%
2 30 - 99 18%
3 100 - 499 21%
4 500 and more 37%
Please answer the number of employees/staff members per factory or office you work for. ( ) people Average 280.3 Please answer the number of employees/staff members in your department/section? ( ) people Average 39.0 Which of the following option best describes your work/job category at your workplace? (Please choose one). 1 Production (direct/indirect department of a factory, etc. such as processing, assembly, inspection, and machine opera-tion) 8%
2 Clerical 20%
3 Professional/technical (research and development, design, information processing, teacher, designer, etc.) 36%
4 Transportation (operation, maintenance, and loading/unloading of a transportation facility and related work) 3%
5 Business management/sales 20%
6 Other 11%
Do you have a labor union at your workplace? (Please choose one). 1 Yes 36%
2 No 63%
What is your annual salary before taxes at your workplace last year? Please write an approximate amount below.
What are your actual working hours per week? Please answer your average hours.
About ( ) hours per week Average 7.7 hours
How many predetermined non-work days do you have per week?
( ) day(s) Average 1.9 days
How many new paid vacation days were you given for the previous year (FY2012)?
( ) days Average 16.4 days
How many paid vacation days did you take for the previous year (FY2012)?
( ) days Average 8.4 days
Which method do you mainly use when taking paid vacation? Please choose one that is closest to your situation.
1 Share method—The work of a person taking paid vacation is shared by his/her colleagues. 28%
2 Progressive method—The work of a person taking paid vacation is passed down to an employee who handles tasks that are easier than that of the person taking paid vacation. 4%
3 Regressive method—The work of a person taking paid vacation is covered by his/her superior within the same group, team or section. 7%
4 Self-pay method (advance)—When an employee plans to take paid vacation, s/he completes her/his tasks in advance.
42%
5 Self-pay method (arrears)—An employee taking paid vacation completes the work of the paid vacation day later.
12% 6 Self-pay method (work at home)—An employee taking paid vacation communicates closely with his/her workplace and handles tasks at home or at a travel destination. 4%
Are you always making efforts to share information across the workplace? (Please choose one).
1 Yes 73%
2 No 26%
When trying to take paid vacation, do you have awareness such as “if I am not at the workplace, the work will be dif-ficult,” “the burden caused by my paid vacation will go to my colleagues,” or “I will cause troubles for others”? (Please choose one).
1 Yes 68%
2 No 31%
At your workplace, is the work load management appropriate for personnel? (Please choose one).