Anomaly Detection and Elimination Algorithm for RFID
Data
A. Anny Leema
1, Dr.Hemalatha.M
2 1Assistant Professor, Computer Applications Department, B.S.Abdur Rahman University PhD Scholar, Karpagam University, Coimbatore, India
2
Head of MSc. Software Systems, Karpagam University, Coimbatore, India
ABSTRACT
The RFID technology has penetrated into all the sectors like supply chain automation, asset tracking, medical/Health Care applications, people tracking, Manufacturing, Retail, Warehouses, Livestock Timing and the healthcare sector due to its increased functionality, low cost, high reliability and easy-to-use capabilities. RFID system produces data that are unreliable, low-level, and rarely able to be used directly by applications. This paper discusses the existing physical, middleware and deferred approaches to deal with anomalies. Each approach has its own drawbacks. To clean the anomaly - false positive in an effective manner we have chosen the integrated approach of middleware and deferred. The premise taken is based on cellular for detecting out of the range readings .The RFID readers have Omni-directional antenna and hence there are possibilities for the adjacent regions to over lap with each other. Algorithm proposed in this paper do not deal with any physical device , but rather integrate middleware and deferred to construct RFID hybrid system that lighten issues associated with using RFID data through adaptive cleaning technique. The resultant data is cleaned data and it can be used for any high end applications. Simulation shows our approach deals with RFID data more efficiently and accurately.
Keywords
RFID technology, RFID data characteristics, Existing approach, proposed approach, case study
1. INTRODUCTION
Radio Frequency Identification (RFID) is an ADC (Automatic data capturing technology) used to identify and track objects using radio frequency waves. It has its own attractiveness because of no line of sight required between the reader and the Antenna. An RFID system consists of readers, tags and middleware. Tag is used to uniquely identify an object and the Readers use radio signals to communicate with the tags. Among the types of tags - passive, active and semi passive, passive tags have much demand due to their least system cost and long life. It don’t have battery on its own and with the help of radiofrequency waves from the reader, backscatters its ID to the reader. By detecting the backscattering signal, the reader demodulates the received signal to retrieve tag’s ID. A reader can also be fitted with an additional interface to transmit its stored data to a computer or a programmable logic.
2. RFID SYSTEM DESIGN
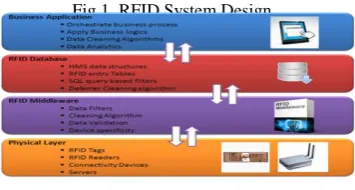
RFID System design is depicted in fig.1. Raw RFID data stream is a spontaneous and very complex data to use for any analysis. The Readers are the detection nodes and it is identified by a unique ID that serves as the location ID. RFID tags in different locations are detected by these readers. One of the biggest challenges of the RFID data is the data volume.
[image:1.595.348.526.361.456.2]Sending terabyte data in to a centralized system for data cleaning requires a high performance server as well as a high speed network, which will inevitably increase the total hardware cost. Some of the data cleaning methodologies apply to data fetched by the readers, some requires an RFID middleware and others require a centralized data processing server to handle the raw data. The server level data observations include data validations, data inconsistencies and identification of anomalies before entering the enterprise application database. One solution is to distribute the centralized information into local nodes, then analyze the information in a distributed way.
Fig.1. RFID System Design
RFID systems can appear diversely in applications but there are fundamental characteristics of RFID data as follows:
Applications dynamically generate readings that change along the time and are temporal in nature.
An ideal RFID deployment will generate gigabytes of spontaneous and consistent data per day.[1]
Data Inaccuracies are inevitable in the RFID system considering the complexity of deployment and diverse business needs it
3.RFID DETECTION MODEL
The reader detection model is based on the RFID tag-reader detections regions.[2] The three distinct regions of operations of a passive RFID reader tag system are:
Fig: 2 Reader –Detection Model
3.1
Strong-in-field region
The tag responds to almost all of the attempts from the reader. Thus the response rate in the strong-in-
field region is very high
3.2 Weak-in-field region
The tag responds to most of the attempts from the reader and the tag performance then degrades
gradually with increasing distance in this field.
3.3 Out-of-field region
The tag hardly responds to any of the attempts from the reader. The response rate tends to become
negligible. The detection range in RFID deployment environment plays a significant role where the
reader location is complex and overlapping.
4 RFID DATA CHARACTERISTICS
The format of the data recorded in the database after a tag has been read consists of three primary pieces of information: the Electronic Product Code, the Reader Identifier and the Timestamp which contains the reading time. [3] The Electronic Product Code (EPC) is a unique identification number introduced by the Auto-ID Center and given to each RFID Tag which is made up of a 96 bit, 25 character-long code containing numbers and letters. It is made up of a Header for 8 bits, EPC Manager for 28 bits, Object Class for 24 bits and Serial Number for 36 bits. Data quality has become increasingly important to many firms as they build data warehouses and focus more on customer relationship management Data quality was concerned with accuracy, precision and timeliness.
5 RFID ANOMALIES AND
MOTIVATION BEHIND THE WORK
5.1. RFID Anomalies:
RFID data acquisition and transmission are unreliable [4],[5], [6], [7].Poor data quality has adverse effects at the operational, tactical and strategic levels of an organization. RFID data is dirty, not reliable and the probabilities of errors and redundancies are high in the RFID data which results in the limited deployment of RFID technology. There are three types of errors in RFID data reading. They are misreads, unexpected readings and duplicate readings. The following
table: 1 depict the types of anomalies found in observed RFID readings.
Table: 1 Depicts the types of Anomalies
S.No Types of anomalies Reason
1 Wrong readings/
false positive
i )When tags outside the normal Reader range ii ) Due to environmental setup
2
Duplicate readings/ redundant
Reader level
i ) Tag happens to pass within overlapped region ii) when there is more than one reader deployed to cover a
specific area. Data
level
i ) Scanned item stays in the reader range for a long period of time
3 Missing readings /
false negatives
i ) Tagged objects not being scanned ii) Object outside the scanning range. iii) not proper
orientation with respect to the reader
5.2. Motivation
One of the primary factors limiting the widespread adoption of RFID technology is the inaccuracy of the data stream produced by RFID readers. The following factors motivate to develop an effective data cleaning technique so that it increases operational efficiency.
The observed read rate in real world RFID deployments is often in the 60- 70 % range
The effectiveness in cleaning the RFID data remains a concern.
Lack of content management of RFID data.
Errors and inconsistencies will produce incorrect or misleading statistics.
6 EXISTING APPROACHES
The table: 2 depict the various existing methodologies to deal with the anomalies and its drawbacks.
Table: 2 Various methodologies to deal with anomalies in RFID data
Approach Author Methodology Drawbacks
[image:2.595.322.547.101.396.2]Physical Rahhmati, Zhong, Hiltunen and Jana [2007]
Tag Orientation Anomalies rises if orientation is not proper
Additional cost involved. Potdar, Hayati and
Chang [2007]
Weighing Cycles increased
Bai, Y.,Wang, F. & Liu, P. (2006)
Multiple Tags/Multiple readers
Duplicate readings and tag collision
[image:2.595.301.566.662.763.2]Middleware Jeffery, Garofalakis and Franklin 2006
Edge Filtering Small window result in false negative and large window result in false positive Jeffery, Garofalakis
and Franklin 2006
declarative and adaptive smoothing window
Doesn’t work when tag moves dynamically in and out of readers communication range.
Shih 2006 RFID
Anti-collision protocols
Corrects missing readings only
Message may collide
Deferred Ziekow and
Ivantysynova[2010]
Proximity Detection
False positive and negatives may be unintentionally introduced during cleaning Gonzalez,2007 Cost-Conscious
Cleaning
Need to remember previous readings and data correction is not done faster.
Peng, Ji, Luo, Wong and Tan2008]
P2P
Collaboration
breaking the readings into detection nodes is a complex task
7 PROPOSED APPROACH
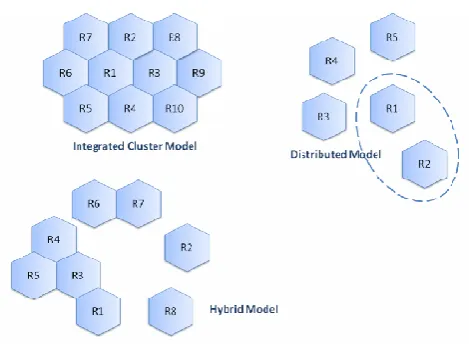
Our proposed approach is hybrid approach of middleware and deferred based on Cellular model for detecting out of the range readings. The RFID readers have Omni-directional antenna and hence there are possibilities for the adjacent regions to over lap with each other.
[image:3.595.22.287.73.255.2]It is not always possible to remove all sorts of anomalies and redundancies in middleware approach. Business context is dynamic and it is not even framed during the loading of data. Hence this motivates to combine both middleware and deferred .There are three different cases that describe the possible architecture of the RFID reader locations and our premise is based on the integrated cluster model depicted in Fig: 3.
Fig: 3 Possible Models to deploy RFID
8 THE PROPOSED DATA CLEANING
ALGORITHMS
We have developed a simulator designed in C# with SQL Server 2008 as backend to evaluate the performance of the proposed algorithm. Simulation is especially suited to the analysis of healthcare organizations due to its ability to handle high complexity and variability which is usually inherent in this sector. RFID is deployed in hospital to construct an elegant hospital environment and to provide various services
like Patient Identification & Tracking, Patient Record Maintenance, Work flow Management, Resource management, Avoiding Equipment Theft, Prevent Infant Theft and Inventory management. [8, 9]
Readers are deployed in various wards ICU, Labor ward, emergency, infant ward, visitors zone, reception, general ward, consulting area , pharmacy etc. to track authorized persons like patients, doctors, employees, staff, infants and visitors. Passive tags will be used to track and identify Objects such as drugs, food, equipment or furniture, which have low mobility or no mobility at all. In the above mentioned wards fixed RFID readers are deployed to track those mobile objects that change their locations less frequently.[10] As stationary objects, such as large hospital equipment or furniture like beds, are not moved very often, in order to track the interaction of a patient with those objects, mobile RFID readers can be used. A person can carry RFID Reader attached to his/her wristband or to ID cards in order to detect the presence of any stationary objects close to him/her[11]. Moreover, as persons, such as patients, doctors or staff, change their locations very frequently; RFID tags can be attached on their wristbands or ID cards in order to track and monitor them. The observed data by the reader was sent to a computer wirelessly [12]. The diagnostic-prognostic software then analyzed the data and provided detection and prognostic information.
8.1. Anomaly Detection and Elimination
Algorithm
Algorithm Anomaly Detection (Readers[], Tags[]) Set = Initial Location of all Tag_Id
NewSet = Null;
While not (Ta_detection) do begin
M= Choose (M); // Finding Adjacent set for the related Loc_Id
M = Crossover (M); // Checking whether Tag_Id is in the Adjacent Set
M = Alteration(Loc_Id, M, Tag_Id); Mutating the set (Original) and Adjacent Set Update NewSet with the Most –ve Coeff; End;
S1 = Set of data covered by NewSet with return (Newset/ S1);
End;
8.2. Algorithm for false negative and
false positive based on Pre-conditions
Algorithm False Readings Elimination (Reader [ ], tags [])
Status Flag 0 – not available Status Flag1 - Available
Input: Reader R1 , Reader R2 Input: Tag 1, Tag2, Tag3……Tag n Begin
For (every tag in reader X (X=A, B) at Time t) do if
{
( t-1=0; t+1=0; t=1 & Precondition = 0 OR Timestamp=0) }
[image:3.595.52.287.453.628.2]{
(t-1=1; t+1=1; t=0 & Precondition = 1 OR Timestamp=1) }
return “ False negative - To be eliminated”; Endif
Endfor End
9 SIMULATION RESULTS
The simulation set up is done as mentioned in Section 8. The RFID reader is modeled based on the design features of SkyeTek’s M1 Mini RFID reader. This reader operates from a Lithium rechargeable battery which has 0.48 KJ of energy. The tag to reader data rate is taken as 26 Kbps as per ISO 15693.
9.1. Case Study 1:
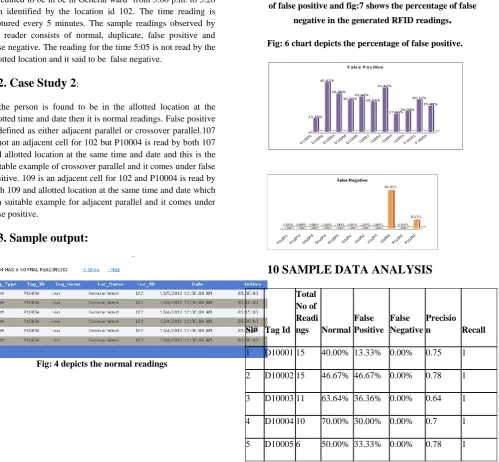
Fig:4 depicts the sample output generated for the person Hari scheduled to be in be in General ward from 5.00 p.m. to 5.20 p.m identified by the location id 102. The time reading is captured every 5 minutes. The sample readings observed by the reader consists of normal, duplicate, false positive and false negative. The reading for the time 5:05 is not read by the allotted location and it said to be false negative.
9.2. Case Study 2
:If the person is found to be in the allotted location at the allotted time and date then it is normal readings. False positive is defined as either adjacent parallel or crossover parallel.107 is not an adjacent cell for 102 but P10004 is read by both 107 and allotted location at the same time and date and this is the suitable example of crossover parallel and it comes under false positive. 109 is an adjacent cell for 102 and P10004 is read by both 109 and allotted location at the same time and date which is a suitable example for adjacent parallel and it comes under false positive.
9.3. Sample output:
Fig: 4 depicts the normal readings
Fig: 5 depicts the false positive and crossover
The chart(fig:6) depicts the percentage of occurrence of false positive and fig:7 shows the percentage of false
[image:4.595.61.561.307.769.2]negative in the generated RFID readings
.
Fig: 6 chart depicts the percentage of false positive.
10 SAMPLE DATA ANALYSIS
Sl# Tag Id Total No of Readi ngs Normal
False Positive
False Negative
Precisio n Recall
1 D10001 15 40.00% 13.33% 0.00% 0.75 1
2 D10002 15 46.67% 46.67% 0.00% 0.78 1
3 D10003 11 63.64% 36.36% 0.00% 0.64 1
4 D10004 10 70.00% 30.00% 0.00% 0.7 1
5 D10005 6 50.00% 33.33% 0.00% 0.78 1
13.33% 46.67%
36.36%
30.00%33.33%28.57% 41.67%
17.65%20.00% 30.77%
25.00%
D100 01
D100 02
D100 03
D100 04
D100 05
I100 01
I100 02
I100 03
I100 04
P 100 01
P 100 04
6 I10001 7 42.86% 28.57% 0.00% 0.68 1
7 I10002 12 58.33% 41.67% 0.00% 0.58 1
8 I10003 17 76.47% 17.65% 0.00% 0.81 1
11. PERFORMANCE EVALUATIONS
:An rfid network needs to capture rfid data without errors and in real-time. We measured the performance by calculating the precision , recall and percentage of data cleaned compared to the existing techniques. The average errors are calculated based on following equation and the chart depicts the comparative study of our method with the existing techniques. Σ ( falsenegatives + falsepositives ) / NumTags
Results of comparing three method
Strategy Percentage of Cleaned data
Percent 70%
Average 92%
SMURF 96%
Our Method 99%
12 CONCLUSIONS AND FUTURE WORK
RFID data remains a concern, even though a number of literary works are available. In this paper we have applied the hybrid approach to develop the cleaning techniques which dealt with the anomalies false positive and false negative on the colossal RFID unreliable data read by the readers. Our proposed algorithm implemented using C# and the algorithm is tested with the health data. The experiment result proved that cleaning is done in an effective manner and the accuracy is improved compared to the existing techniques such that the operational efficiency is enhanced and the cleaned data is applied for any high end applications.Major barriers to RFID adoption are identified as prohibitive costs, technological limitations, and privacy concerns. By improving perceptions, safety, reliability, user-friendliness, accessibility, and privacy in healthcare or any organizations it is expected that the demand for RFID will grow. In future the existing system is
easily enhanced to launch in online so that the public is benefited based on the requirements.
12. REFERENCES
[1] P.F. Drucker, “The essential Drucker: selections from the management works of Peter F. Drucker”,New York: HarperBusiness, 2001.
[2] Chunkai Zhang , Yan Chen “Application oriented Data Cleaning for RFID middleware”, IEEE, 2011. [3] U.S. Government Accountability Office, “Radio
Frequency Identification Technology in the Federal Government”, 441 G Street NW, Room LM Washington, D.C. 20548, 2005.
[3]. Sudarshan S. Chawathe, Venkat Krishnamurthy, Sridhar Ramachandran, and Sanjay Sarma, "Managing RFID Data", In Proceedings of the 30th VLDB Conference, pp.1189-1195, 2004
[4] C. Floerkemeier and M. Lampe. Issues with RFID Usage in Ubiquitous Computing Applications. In Pervasive, pages 188–193, 2004.
[5] S. R. Jeffery, G. Alonso, M. J. Franklin, W. Hong, and J. Widom. Declarative Support for Sensor Data Cleaning. In Pervasive, pages 83–100, 2006
[6] S. R. Jeffery, M. N. Garofalakis, and M. J. Franklin. Adaptive Cleaning for RFID Data Streams. In VLDB, pages 163–174, 2006.
[7] J. Rao, S. Doraiswamy, H. Thakkar and L.S. Colby, A Deferred Cleansing Method for RFID Data Analytics, in Proceedings of the 32nd VLDB Conference, pp. 175-186, 2006.
[8]. Angela M. Wicks, John K. Visich and Suhong Li, "Radio Frequency Identification Applications in Hospital Environments", , Vol. 84, No.3, pp.3-9, 2006.
[9] A.Anny Leema, M.Hemalatha , “Optimizing Operational Efficiency and Enhancing Data Reliability using Effective and Adaptive CleaningApproach for RFID in Healthcare “,International Journal of Computer Applications (IJCA)
[10] A. Lahtela, "A Short Overview of the RFID Technology in Healthcare", Systems and Networks Communications,2009, ICSNC '09, In Proceedings of Fourth International Conference on, pp.165-169, 2009 Cleansing Method for RFID Data Analytics. In VLDB, pages 175–186,2006.
[11] A.Anny Leema, M.Hemalatha , “An effective and adaptive data cleaning technique for colossal RFID
data sets in healthcare”in WSEAS
TRANSACTIONS onINFORMATION SCIENCE and APPLICATIONS, pages 243-252, ISSN: 1790-0832, Issue 6, Volume 8, 2011.
[12] Bettina Fazzinga, Sergio Flesca, Elio Masciari and Filippo Furfaro, "Efficient and effective RFID data warehousing", In proceedings of the 2009 International Database Engineering & Applications Symposium,pp. 251-258 , 2009.
Percent of cleaned data
70%
92% 96% 99%
0% 20% 40% 60% 80% 100% 120%
Percent Average SMURF Our
Method
P
e
rc
e
nt
a
ge