http://dx.doi.org/10.4236/epe.2015.72004
How to cite this paper: Goeke, J. and Henne, A. (2015) Time-Temperature Charge Function of a High Dynamic Thermal Heat Storage with Phase Change Material. Energy and Power Engineering, 7, 41-54.
http://dx.doi.org/10.4236/epe.2015.72004
Time-Temperature Charge Function of a
High Dynamic Thermal Heat Storage with
Phase Change Material
Johannes Goeke*, Andreas Henne
Institute of Building Services, Faculty 09, Cologne University of Applied Sciences, Köln, Germany Email: *[email protected]
Received 4 February 2015; accepted 22 February 2015; published 25 February 2015
Copyright © 2015 by authors and Scientific Research Publishing Inc.
This work is licensed under the Creative Commons Attribution International License (CC BY). http://creativecommons.org/licenses/by/4.0/
Abstract
A thermal heat storage system with an energy content of 40 kWh and a temperature of 58˚C will be presented. This storage system is suitable for supporting the use of renewable energies in build-ings and for absorbing solar heat, heat from co-generation and heat pumps or electric heat from excess wind and solar power. The storage system is equipped with a plate heat exchanger that is so powerful that even with small temperature differences between the flow temperature and the storage temperature a high load dynamic is achieved. The storage system has a performance of 2.8 kW at 4 K and 10.6 kW at a temperature difference of 10 K. Thus, large performance variations in solar thermal systems or CHP plants can be buffered very well. Further a storage charge function Q(T, t) will be presented to characterize the performance of the storage.
Keywords
Thermal Storage, Phase Change Material (PCM), Plate Heat Exchanger, Dynamic Performance, Storage Charge Function
1. Introduction
Thermal high performance storage systems in buildings are becoming increasingly important owing to the rising need to offset fluctuating ranges of different renewable energies from wind power, photovoltaic and solar ther-mal, as well as other sources of thermal energy. The real revolution in energy supply will take place in the heat-ing market. The use of water reservoirs is indeed cheap, although in some cases it is not possible; for example, in the rehabilitation of buildings where space is restricted. Here we would like to introduce the effects of a
42
mal energy storage system for heat that is based on the phase change material sodium acetate trihydrate (NA58) and a plate heat exchanger.
The decision for a plate heat exchanger was based on expectations of absorbing rapid changes in the heat supply with a high momentum. The energy should then be stored as quickly as possible. Moreover, it is neces-sary to better understand the design of a storage system when interacting with the various materials used. Mod-ifications can then be explored to achieve improved dynamics.
1.1. Application of Phase Change Material
The use of phase change material (PCM) for energy storage has been known since the late 1940s. In 1949 Telkes and Raymond supplied a building with heat using a sodium acetate trihydrate storage system [1]. Since that time the technological development of storage technology has been fuelled in cyclical waves by energy crises. De-velopments have usually been individual solutions for specific storage systems or heating systems. The targets of these technical solutions―set by both universities and industry—have often not been achieved, with the re-sult that economic representation has not materialised. A broad overview of application of thermal energy sto-rage with phase change materials is given by Zalba et al. [2]. Especially for various applications of cold storages in buildings Oro et al. [3] have given a summary.
There are important criteria to consider when using thermal storage systems in buildings. These include sto-rage density and working temperature. For use in buildings the stosto-rage density should be better than that of wa-ter by a factor of 3 - 4 in order to generate a cost saving with regard to volume, considering the investment. The storage temperature must also be acceptable so as to avoid unnecessary loss in the system due to temperature differences between application and storage temperature. For use in buildings, to achieve optimal efficiency the temperature of the phase changes should be between 40˚C and 80˚C. High performance is also of great impor-tance so that the available energy can be stored directly.
Numerous review articles [2]-[11] describe the use of PCM materials and improvements in storage technology. Nevertheless, numerous studies describe repeated attempts (with various measures) to compensate for the dis-advantage of PCM materials, namely the poor heat conduction (λ = 0.2 Wm−1·K−1 to λ = 0.6 Wm−1·K−1). The re-view articles by Agyenim et al.[4], Pomianowskia [5], Soares [6] and Liu [7], as well as the book of Mehling and Cabeza [8], are especially worth mentioning.
Rathod [9] provides an overview of the studies on the long-term stability of PCM material both for organic and inorganic PCMs. Tan et al. [10] investigated the melting behaviour of paraffin in a spherical capsule. They could clearly replicate the melting behaviour by means of simulations. Lafdi [11] also examined improving the thermal conductivity of salt hydrates with graphite foam in a theoretical analysis and computer simulation.
1.2. Experiments with Plate and Fins
Increasing the thermal conductivity can be strongly improved by adding a mixture of salt hydrate and graphite, as well as applying measures of classic heat transfer such as using fins for heat exchange. This well-known tech- nique was examined by Tay et al. [12] Sciacovelli [13], Khalifa et al. [14] and Agyenim and Hewitt [15]-[17], Kayansayan [18] and Kurnia [19] in various arrangements experimentally.
Ismail and Lino [20] described a transverse fin system, which should support the formation of ice in a water container (700 × 500 × 500 mm). Fins with diameters of 40 mm, 60 mm, 120 mm, and 180 mm—made of cop-per to a thickness of 1 mm—were placed on a pipe at intervals of 60 mm. This showed a visible reduction in the melting times. A further investigation by Ismail and Lino [21] analysed cold storage by using water. They fitted circular fins on a pipe at different intervals and recorded by using a camera the progression of the phase limits and the formation of ice. They then translated the results into meaningful charts. A transverse fin system is also described by Kozak, Rozenfeld and Ziskind [22].
Baby, Rajesh and Balaji [23] placed aluminium tips (needles) on a plate and studied the effects of these tips, similar to fins. They found improved heat transfer compared to longitudinal fins. A similar form
can be find by Campos-Celador for applications in buildings [26].
Liu et al. [27] examined the improvement of the melting process of stearic acid (phase change temperature 67.7˚C) using fins. They were able to prove that the warming process was greatly reduced, as well as the overall melting time.
Tay, Bruno and Belusko [28]-[30] constructed a pipe-in-tank system and examined the melting behaviour of salt hydrate (tmelting = −11˚C). They developed a “pre-melting tube” system to improve the heat transfer. Thus, it is possible to force a stronger convection in the liquid phase. The downside is the need to establish an additional circulation, as well as having to provide energy pumps, which negatively affect the overall energy output. In ad-dition to studying the basic phenomena, they showed, inter alia, the testing of a PCM storage system in a build-ing in conjunction with a space coolbuild-ing device.
Chang [31] investigated the effect of longitudinal fins in a cylindrical container with dodecanoic acid as PCM and a phase change temperature of 44˚C, also with visible success.
2. Material and Methods
2.1. Storage Construction
At this stage we would like to introduce a highly dynamic heat storage system with plate exchanger technology with a maximum capacity of 40 kWh—which in principle is suitable for absorbing heat from solar thermal pow-er, CHP or heat pumps—to improve the energy efficiency of a heat supply system for buildings of any size [32] [33]. Basically, 100 kWh can be accommodated in a storage system of one cubic metre when using NA58. It is thus possible to provide power for larger buildings and heat supply concepts by coupling multiple storage units of this kind.
The focus of our research was devoted to improving the dynamics of the storage system. In the case of solar thermal energy it is necessary to immediately transfer the energy provided by the sun to the storage units before the next cloud. It is irrelevant whether the energy is stored directly or whether a heat pump is installed in the meantime. The summed up heat quantity Q is equivalent to the Q T t
( )
, charging function of the storage system.The Q T t
( )
, charging function provides information about the time and the flow temperature (HTF) needed to charge a storage system. The charging function is a criterion for the dynamics of storage and provides a relia-ble assessment for the use of a storage system. Ideally the charge function should correspond to an e-function of( )
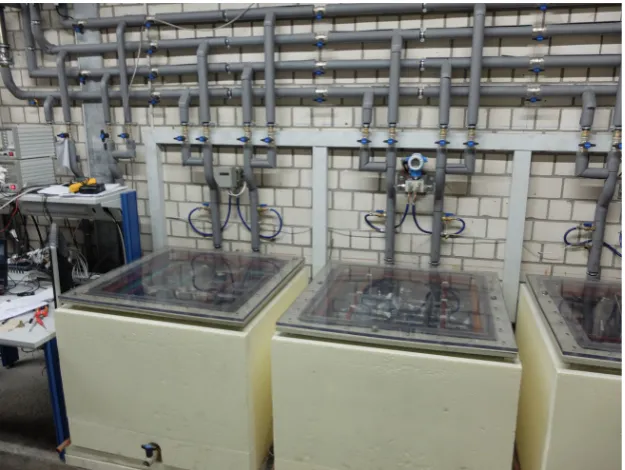
, [image:3.595.158.471.466.701.2]Q T t when a jump function is previously applied on the system. In Figure 1 the three storage units that can work in parallel are seen.
44
The storage systems had a usable volume of 400 litres with dimensions of 0.75 m × 7.5 m × 0.8 m and a fill-ing height of 0.56 m. A hot water tank with a 6 kW power cartridge was available as a source of heat. This heat-ing system was not able to provide the system with an ideal temperature jump. In order to get closer to ideal conditions, in a second phase the system was extended with a further hot water cylinder with a 400 litre capacity and heating power of 9 kW. Only by achieving the best possible jump function can comparisons be permitted between similar storage systems with regard to their storage behaviour.
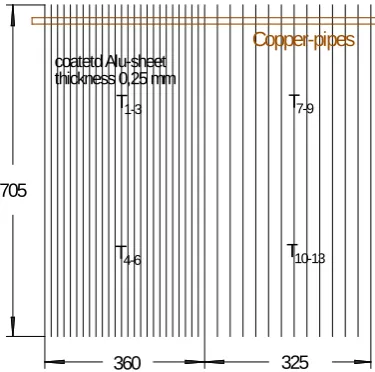
The plate arrangement is shown in Figure 2. The heat pipes run perpendicular to the plates.
The effect of different plate intervals was established during tests. In the left half of the plate heat exchanger the distance between the 13 plates was 25 mm, while in the right half it was 15 mm with 22 plates. In addition to satisfactory performance, it is also important to make sure that the volume ratio of the installations in the storage system to the actual phase change material still behaves favourably. The compactness factor CF [21] is defined as:
Volume of assembly storage capacity F
C =
For the heat exchanger tubes we then obtain:
,
Number * pipearea * pipelength storage capacity F Pipe
C =
(
)
(
2)
, 3
,
126 0.000036 m 1.2 m
0.0534 0.32 m 5.3% F Pipe F Pipe C C π × × × = = =
As 1.57% of the reservoir was needed for the fins, approximately 6.9% volume of the usable phase change material was lost through the installation. An acceptable ratio is 93.1% PCM and 6.9% pipe and fin design. This ratio was significantly better than in the use of composite materials. When trying to improve the dynamics of storage with simple tube heat exchangers and a mixture of salt hydrate and expanded graphite, the usable PCM share is <80%.
The storage system was equipped with appropriate instrumentation for monitoring 12 temperatures in each horizontal and vertical section in depth of 200 mm, 300 mm and 500 mm. PT 100 was used as temperature sen-sors. The flow rate, pressure loss and the flow in and out temperatures were recorded and evaluated using a sys-tem from National Instruments (Compact DAQ) and Labview.
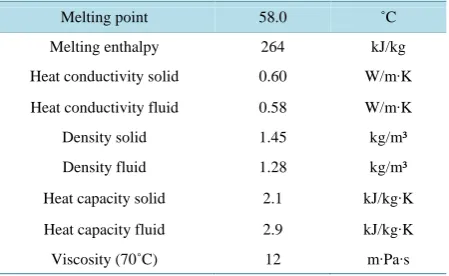
The material data for sodium acetate trihydrate is shown in Table 1. The data was taken from freely available sources [7]. However, there was no publicly accessible source for the temperature-dependent viscosity, so we
coatetd Alu-sheet thickness 0,25 mm
[image:4.595.216.404.516.702.2]Copper-pipes 360 325 705 T1-3 T4-6 T7-9 T10-13
Table 1. Material data for sodium acetate trihydrate.
Melting point 58.0 ˚C
Melting enthalpy 264 kJ/kg
Heat conductivity solid 0.60 W/m∙K
Heat conductivity fluid 0.58 W/m∙K
Density solid 1.45 kg/m³
Density fluid 1.28 kg/m³
Heat capacity solid 2.1 kJ/kg∙K
Heat capacity fluid 2.9 kJ/kg∙K
Viscosity (70˚C) 12 m∙Pa∙s
had to carry out our own measurements. In particular, in the range above 58˚C an indifferent melting product was obtained and it was, therefore, difficult to get an indication of the viscosity. We measured a viscosity of ap-proximately 2000 mPas at the melting point and at 80˚C a viscosity of apap-proximately 2 mPas. Also, the convec-tion in the melting process was significantly influenced by this wide range. Therefore, one obtained αA heat transfer rates between 300 W/(m2·K) and 1200 W/(m2·K). It follows that the performance of the heat exchanger was determined not only by the temperature difference ΔT, but also by variation in the viscosity.
The storage systems were heat insulated with fine pored, expanded polystyrene hard foam. The loss amounted to 868 W per day with an insulation of 12 cm and a λ thermal conductivity of 0.034 W/(m∙K). Another layer of polystyrene foam strongly reduced the heat loss.
2.2. Storage Hydraulic System
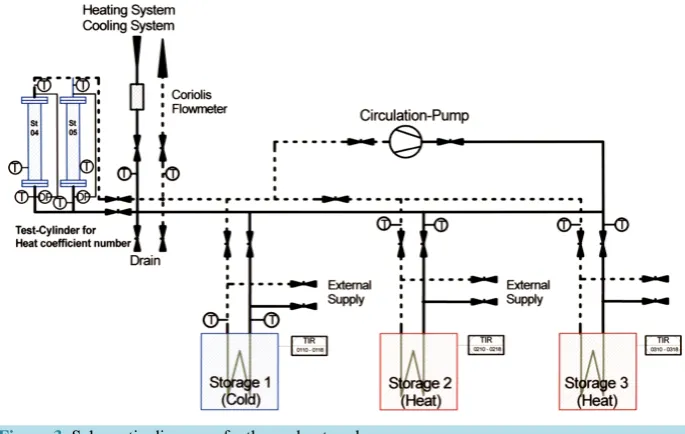
In Figure 3 the hydraulic diagram of the system is shown, which includes two heat storage units with NA58, a cold storage and two pipe testing facilities with calcium chloride hexahydrate. In the pipe testing facilities ways to improve the heat transfer rates αI using prepared copper pipes were investigated. The heat storage units were
fed by a heat source (6 kW) with an integrated water tank (200 L). They could be further cooled with a cooling system to generate different cooling curves. The cooling system also fed the cold storage and the pipe testing fa-cilities for investigation purposes. By using a circulating pump the energy of the storage could be redeployed to every other storage unit. Thus, the storage units could mutually cool or heat each other.
The inward flow of heat transfer fluid (HTF) was pumped via a pump onto the plate heat exchanger and the mass flow was directly measured by means of a Coriolis flow meter. In addition to the inward flow and outward flow temperature (PT 100), the system pressure and the differential pressure across the plate heat exchanger were measured.
The heat storage unit was loaded with two different volume flows. In the first half of the test the flow rate ranged from 930 L/h up to 980 L/h and in the second half from 1950 L/h up to 1990 L/h. No significant differ-ence was found in the heating-up behaviour. The reason was that in the case of 126 pipes with 10.1 mm internal diameter the Reynolds numbers were 545 < Re < 1080. Thus, the flow was completely in the laminar range. The heat transfer was similar in both halves of the test, because the increased proportion of the volume was offset by reducing the temperature difference ΔT. A boost of the Nusselt number Nu by increasing the Reynolds number in the laminar range was barely noticeable, so the heat transfer coefficient αI only increased slightly and had a
limited impact.
The pressure loss of the heat exchanger was measured in order to obtain the complete energy balance. At a volume flow of 950 L/h it was at 22 hPa and at 1950 L/h it was 68 hPa.
After the trials and before extended downtime the hot solution should be cooled to approximately 50˚C after the heating phase, so that excessive cooling to room temperature is prevented. This induces a risk of separation. The cooling down temperature of the melt ended at about 52˚C when it was cooled with 35˚C inward water temperatures. Crystallisation then set in. An addition of polyacrylic acid can prevent a separation, but leads to higher viscosity that inhibits the heat transfer.
46
Figure 3. Schematic diagram of a thermal network.
3. Heat Power of Plate Heat Exchanger
The performance of the plate heat exchanger used in the storage system will be described and calculated at this stage using the equations of classical thermodynamics. To do this a unit cell from a pipe piece with fin is used as the basis for valuation. Because an equal spacing between the fin and the pipe with the heat transfer fluid is not given, the hexagon fin is used as a calculation basis, which takes into account the effective areal distribution. The elementary cell of the hexagon fin1 in Figure 4 consists of aluminium with a material thickness d = 0.25 mm and an edge length s of 26.5 mm. Furthermore, a piece of pipe of 15 mm in length and 12.2 mm outside diameter perpendicular to the fin is part of the unit cell.
The heat output, which this unit cell is capable of, is composed of two performance parts. The fin provides the first part and the pipe piece, which belongs to the fin, delivers the second part. The amount of heat generated by the fin QFin can be calculated according to Equation (1.1)1.
(
)
2 tanh
Fin
Q = αλd L⋅ ⋅ ∆T m L⋅ (1.1)
with
α = Heat-transfer coefficient [W/m2∙K]; d = Thickness of plate [m];
λ = Heat-conductivity coefficient of material [W/m∙K]; ΔT = Fin temperature difference [K];
L = Effective Length of pipe [m].
The argument of the hyperbolic tangent is formed with the effective fin length L and a factor of m, which contains the heat transition coefficient αA, the heat conductivity λ and the fin thickness.
2 m
d
α λ =
The effective length L of the hexagon fin is determined by the side length s and the diameter of the pipe D.
3 3
0.978
2 2 2
D D
L s s
π
= − = − 2
(1.2)
The results of heat power for the hexagonal unit cell as opposed to a disc fin, represented by the effective dis-tance L from the heat conveying pipe, is shown in Figure 5 for a fin temperature difference.
[image:7.595.148.485.82.241.2]
(a) (b)
Figure 4. Sketch of elementary cell of heat exchanger (hexagon) and as part of a greater sheet.
Figure 5. Heat power distribution of an elementary cell depending on the plate length.
The heat performance with a fin differential temperature of 4 K is 0.91 W. The heat exchanger consists of 3366 hexagonal elementary cells. The selected fin arrangement is shown in Figure 6.
Considering only half of the thermodynamic effect of edge cells, a performance of 3086 W for the entire heat exchanger with 3366 elementary cells at a fin differential temperature of 4 K is obtained. The temperature dif-ference is defined here as the temperature at the base of the fin and the temperature of the liquid salt hydrate on the fin. The fin base temperature is lower than the average inward flow temperature (meaning HTF) by about 1 K. This temperature difference should not be confused with the difference between inward flow temperature and melting temperature. In our studies we noticed that the temperature difference between inward and outward flow can be used as a good approximation in the equations.
In addition to the fins, the storage also has a 62 m heat-transferring pipe. This heat transfer must be taken into account as well. The heat transfer performance of the pipe is calculated as follows:
Pipe
2
1 1 1
ln A I W A
I I I A A
L T
Q T
r R R R
r r r
α λ α
π
α λ α
∆
= ∆ =
+ +
+ +
(1.3)
αI = Heat-transfer coefficient HTF―pipe [W/m2∙K]; αA = Heat-transfer coefficient pipe/plate―PCM [W/m2∙K]; rA = outer pipe radius [m];
[image:7.595.183.450.266.464.2]48
(a)
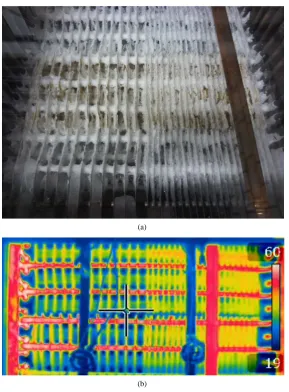
[image:8.595.170.460.79.472.2](b)
Figure 6. (a) Storage shelter with sodiumacetate trihydrate and the alignment of plates. (b) Temperature distribution of the storage shelter in a heating state with a HTF-Temperature of 63˚C.
λPCM = Heat conductivity of PCM [W/m∙K]; ΔT = effective Temperature difference [K]; L = Length of pipe [m].
The thermal resistance of the pipe RλW with a thermal conductivity of the copper pipe of λCU - 400 W/(m·K) is negligible and the thermal resistance RαI of hot water on the inside of the pipe is almost constant. The outer heat transfer from the fins and the pipes on the phase change material NA58 is essentially dominated by convection during the melting process. Thus, the outer thermal resistance RαA is effectively determined by the Nusselt num-ber Nu3. This in turn is determined by the Grashof number Gr and the Prandtl number Pr and thus strongly by the temperature-dependent viscosity. The applied approximation equations for the dimensionless ratios are as follows:
(
)
1 26
Zylinder 0.825 0.387 Pr 1 0.435 L
Nu Gr f
D
= + ⋅ ⋅ +
(
)
32 ; Pr
p
S A c
g T T r
Gr β η
λ ν
∞
−
= =
1 16 9 9 16 1 0.492 1 Pr f = +
Using the Nusselt number for the convective laminar heat transfer, the alpha number can be determined.
Nu D α
λ ⋅ =
Thus, a temperature-dependent outer thermal resistance RαA can be obtained. The outer thermal resistance will decrease with increasing temperature of heat transfer fluid. The heat transfer coefficient αA is then comprised of values between 250 W/(m∙K) and 850 W/(m∙K).
( )
Pipe
I A
T Q
Rα Rα T
∆ =
+
(1.4)
For example, at a fin temperature of 4 K the pipe surface contributes 339 W to the thermal capacity of the ex-changer. Thus, the total heat output consists of
Sum Plate Pipe Q =Q +Q
In Figure 6(a) the melted sodium acetate trihydrate (NA58) can be seen in part with crystalline residues on the plates of the heat exchanger. The different plate intervals are clearly visible. This supports the investigation of the efficiency of the heat transfer in different thicknesses of salt plates. In Figure 6(b)the heat distribution is shown at a HTF-Temperature of 63˚C.
The long-term stability of such a storage system is closely related to the corrosion resistance. According to investigations by Cabeza et al. [7] [34], no serious problems are to be expected. This is also consistent with our experience. A small salt hydrate storage unit (80 litres with copper pipes) has been running for 5 years in our la-boratory without any problems. The explanation for this is that copper and aluminium are enclosed and sealed away from the salt hydrate and corrosion is thus strongly suppressed.
4. Results and Discussion
Figure 7 shows three characteristic temperature curves for heating of the storage system for the average of in-ward flow temperatures of 62.8˚C, 69.8˚C and 70.8˚C. While the curves for 66.9˚C (dashed black) and 71.8˚C (dashed grey) leave the deferred area of 58.5 ± 1˚C at similar times, an inward flow temperature of 62.8˚C (doted) needed much longer. The low temperature difference caused the final temperature to be reached very slowly. The shown temperature curve of the storage is a mean value of 12 temperature measurements.
On further examination of the evolution of the actual inward flow temperature (black dashed line), it appears that no ideal jump to the storage system could be achieved due to limited heating capacity. Thus, the tempera-tures within the storage unit slowly follow the inward flow temperature and accordingly global warming takes longer. An even stronger performance is thus prevented. To ensure comparability of the storage behaviour with different heating systems, we established an average inward flow temperature of HTF as a reference temperature. This temperature value refers to the total charging time of the storage unit. The more precisely a constant inward flow temperature can be maintained as a heat jump onto the system, the better the storage behaviour corresponds to the jump response.
The temperature curves were evaluated offline, so that reaching a average temperature above 59.5˚C was evaluated as the end of the melting process. Thus, a reliable limit is given for which the charging time of a sto-rage unit can be determined regardless of the heat level that can still be fed to the stosto-rage unit (see Figure 11) beyond 59.5˚C. The heat stored so far is approximately 80% - 90% of the total amount of heat.
50
Figure 7. Temperature curves in the thermal storage depending on HTF-Tem- perature.
Figure 8. Heat energy during storage load depending on the temperature of heat transfer fluid.
flow temperature cannot be kept stable, the increase in the heat curves is slowed and they go over into a linear phase until they become asymptotical at the end, towards the limit of the maximum possible energy.
The heat curves have different limits and approach these limits asymptotically if no excessive losses counte-ract this heat absorption. The differentiated limits appear because of different amounts of sensible heat due to different end temperatures in the inward flow. For this reason, attention was also paid to a uniform starting tem-perature. This was due to the use of the cooling system at 14˚C ± 1˚C.
The solid black curve shows the heat quantity for an average inward flow temperature of 71.8˚C. It is located at 40.2 kWh. This includes both the latent heat as well as the sensible heat from the sodium acetate trihydrate. The sensible heat from the storage system and its installations was taken into account. It is 2.2 kW.
For the curves shown the differences amount to approximately 1.9 kWh at the end of the heat quantity curve for the sensible heat.
[image:10.595.173.455.318.529.2]Figure 9. Heating power during storage load depending on the temperature of heat transfer fluid.
the warm water tank (200 l), the temperature difference between inward flow and the temperature in the storage unit drops and thus the performance decreases before the heater cartridge can generate stronger heat. With an average temperature of 62.8˚C, the temperature difference is so greatly reduced (ΔT < 2 K) that a steady drop in performance is observed.
In addition to these four curves shown as examples, fourteen more curves (data sets) were recorded with dif-ferent inward flow temperatures. They allowed for a detailed representation of the storage behaviour. From the individual data sets the charging curve of the storage system Q T t
( )
, , as well as the performance curve Q t T′( )
, , can be identified and presented in diagrams.In Figure 10 the performance of the plate heat exchanger in the storage system (squares) is applied and used in relation to the performances (triangles) that were calculated with Equations (1.1) and (1.3) and other equa-tions of classical heat transfer. The experimentally determined performance function Q t T′
( )
, is consistent with the theoretical heat transfer function in the context of uncertainty.Insufficient knowledge of the temperature-dependent viscosity of the liquid sodium acetate trihydrate was a hindrance. The viscosity could not be measured adequately for calculating heat transfer coefficient. A mixing zone (mushy zone) is particularly present close to the melting temperature. It contains tiny solid ingredients and significantly influences the viscosity. Due to the uncertain knowledge of the viscosity of ~15%, the performance curve is also affected with a similar uncertainty.
The charging time depending on the inward flow temperature is shown in Figure 11. The charging times are shown separately for the different sections of the storage unit. The black semicolon line shows the charging time for the section with plates at 15 mm intervals. The dotted curve shows the results with 25 mm plate spacing. From the inward flow temperature of approximately 65˚C (ΔT = 7 K), it can be seen that acceptable charging times can be reached.
52
Figure 10. Power of plate heat exchanger depending on the HTF-temperature and belonging viscosity.
Figure 11. Loading time of thermal storage depends on HTF-temperature, loading curve Q(T, t).
time increases exponentially the closer the average inward flow temperature gets to the phase change tempera-ture. Another interesting fact is that above 74˚C no further significant reduction in the charging time is achieved by increasing the temperature difference.
5. Summary
[image:12.595.182.446.317.523.2]The implication is that we can determine the combination of different heating systems and heat storage units that can best be used in buildings.
References
[1] Telkes, M. and Raymond, E. (1949) Storing Solar Heat in Chemicals—A Report on the Dover House. Heat Vent, 46, 80-86.
[2] Zalba, B., Marin, J., Cabeza, L.F. and Mehling, H. (2003) Review on Thermal Energy Storage with Phase Change: Materials, Heat Transfer Analysis and Applications. Applied Thermal Engineering, 23, 251-283.
http://dx.doi.org/10.1016/S1359-4311(02)00192-8
[3] Oró, E., de Gracia, A., Castell, A., Farid, M.M. and Cabeza, L.F. (2012) Review on Phase Change Materials (PCMs) for Cold Thermal Energy Storage Applications. Applied Energy, 99, 513-533.
http://dx.doi.org/10.1016/j.apenergy.2012.03.058
[4] Agyenim, F., Hewitt, N., Eames, P. and Smyth, M. (2010) A Review of Materials, Heat Transfer and Phase Change Problem Formulation for Latent Heat Thermal Energy Storage Systems (LHTESS). Renewable and Sustainable Energy Reviews, 14, 615-628. http://dx.doi.org/10.1016/j.rser.2009.10.015
[5] Pomianowskia, M., Heiselberg, P. and Zhang, Y. (2013) Review of Thermal Energy Storage Technologies Based on PCM Application in Buildings. Energy and Buildings, 67, 56-69. http://dx.doi.org/10.1016/j.enbuild.2013.08.006
[6] Soares, N., Costab, J.J., Gasparb, A.R. and Santosc, P. (2013) Review of Passive PCM Latent Heat Thermal Energy Storage Systems towards Buildings’ Energy Efficiency. Energy and Buildings, 59, 82-103.
http://dx.doi.org/10.1016/j.enbuild.2012.12.042
[7] Liu, M., Saman, W. and Bruno, F. (2012) Review on Storage Materials and Thermal Performance Enhancement Tech-niques for High Temperature Phase Change Thermal Storage Systems. Renewable and Sustainable Energy Reviews, 16, 2118-2132. http://dx.doi.org/10.1016/j.rser.2012.01.020
[8] Mehling, H. and Cabeza, L.F. (2008) Heat and Cold Storage with PCM: An Up to Date Introduction into Basics and Applications. Springer, Berlin.
[9] Rathod, M.K. and Banerjee, J. (2013) Thermal Stability of Phase Change Materials Used in Latent Heat Energy Sto-rage Systems. Energy and Buildings, 67, 56-69.
[10] Tan, F.L., Hosseinizadeh, S.F., Khodadadi, J.M. and Fan, L. (2009) Experimental and Computational Study of Con-strained Melting of Phase Change Materials inside a Spherical Capsule. International Journal of Heat and Mass Transfer, 52, 3464-3472. http://dx.doi.org/10.1016/j.ijheatmasstransfer.2009.02.043
[11] Lafdi, K., Mesalhy, O. and Elgafy, A. (2008) Graphite Foams Infiltrated with Phase Change Materials, as Alternative Materials for Space and Terrestrial Thermal Energy Storage Applications. Carbon, 46, 159-168.
http://dx.doi.org/10.1016/j.carbon.2007.11.003
[12] Tay, N.H.S., Belusko, M., Castell, A., Cabeza, L.F. and Bruno, F. (2014) An Effectiveness-NTU Technique for Cha-racterising a Finned Tubes PCM System Using a CFD Model. Applied Energy, 131, 377-385.
http://dx.doi.org/10.1016/j.apenergy.2014.06.041
[13] Sciacovelli, A., Gagliardi, F. and Verda, V. (2015) Maximization of Performance of a PCM Latent Heat Storage Sys-tem, with Innovative Fins. Applied Energy, 137, 707-715.
[14] Khalifa, A., Tan, L., Date, A. and Akbarzadeh, A. (2014) A Numerical and Experimental Study of Solidification around Axially Finned Heat Pipes for High Temperature Latent Heat Thermal Energy Storage Units. Applied Thermal Engineering, 70, 609-619. http://dx.doi.org/10.1016/j.applthermaleng.2014.05.080
[15] Agyenim, F., Eames, P. and Smyth, M. (2010) Heat Transfer Enhancement in Medium Temperature Thermal Energy Storage System Using a Multitube Heat Transfer Array. Renewable Energy, 35, 198-207.
http://dx.doi.org/10.1016/j.renene.2009.03.010
[16] Agyenim, F. and Hewitt, N. (2010) The Development of a Finned Phase Change Material (PCM) Storage System to Take Advantage of Off-Peak Electricity Tariff for Improvement in Cost of Heat Pump Operation. Energy and Build-ings, 42, 1552-1560. http://dx.doi.org/10.1016/j.enbuild.2010.03.027
[17] Agyenim, F., Eames, P. and Smyth, M. (2009) A Comparison of Heat Transfer Enhancement in a Medium Tempera-ture Thermal Energy Storage Heat Exchanger Using Fins. Solar Energy, 83, 1509-1520.
http://dx.doi.org/10.1016/j.solener.2009.04.007
[18] Kayansayan, N. and Acar, M.A. (2006) Ice Formation around a Finned-Tube Heat Exchanger for Cold Thermal Energy Storage. International Journal of Thermal Sciences, 45, 405-418. http://dx.doi.org/10.1016/j.ijthermalsci.2005.05.009 [19] Kurnia, J.C., Sasmito, A.P., Jangam, S.V. and Mujumdar, A.S. (2013) Improved Design for Heat Transfer Performance
54 http://dx.doi.org/10.1016/j.applthermaleng.2012.08.015
[20] Ismail, K.A.R. and Lino, F.A.M. (2011) Fins and Turbulence Promoters for Heat Transfer Enhancement in Latent Heat Storage Systems. Experimental Thermal and Fluid Science, 35, 1010-1018.
http://dx.doi.org/10.1016/j.expthermflusci.2011.02.002
[21] Ismail, K.A.R., Lino, F.A.M., da Silva, R.C.R., de Jesus, A.B. and Paixão, L.C. (2014) Experimentally Validated Two Dimensional Numerical Model for the Solidification of PCM along a Horizontal Long Tube. International Journal of Thermal Sciences, 75, 184-193. http://dx.doi.org/10.1016/j.ijthermalsci.2013.08.008
[22] Kozak, Y., Rozenfeld, T. and Ziskind, G. (2014) Close-Contact Melting in Vertical Annular Enclosures with a Non- Isothermal Base: Theoretical Modeling and Application to Thermal Storage. International Journal of Heat and Mass Transfer, 72, 114-127. http://dx.doi.org/10.1016/j.ijheatmasstransfer.2013.12.058
[23] Baby, R. and Balaji, C. (2012) Experimental Investigations on Phase Change Material Based Finned Heat Sinks for Electronic Equipment Cooling. International Journal of Heat and Mass Transfer, 55, 1642-1649.
http://dx.doi.org/10.1016/j.ijheatmasstransfer.2011.11.020
[24] Al-Abidia, A.A., Mata, S.B., Sopiana, K., Sulaiman, M.Y. and Mohammada, A.T. (2014) Experimental Study of Melting and Solidification of PCM in a Triplex Tube Heat Exchanger with Fins. Energy and Buildings, 68, 33-41. http://dx.doi.org/10.1016/j.enbuild.2013.09.007
[25] Al-Abidi, A.A., Mat, S., Sopian, K., Sulaiman, M.Y. and Mohammad, A.Th. (2013) Internal and External Fin Heat Transfer Enhancement Technique for Latent Heat Thermal Energy Storage in Triplex Tube Heat Exchangers. Applied Thermal Engineering, 53, 147-156. http://dx.doi.org/10.1016/j.applthermaleng.2013.01.011
[26] Campos-Celadora, Á., Diarceb, G., Zubiagac, J.T., Bandosc, T.V., García-Romerob, A.M., López, L.M. and Salac, J.M. (2014) Design of a Finned Plate Latent Heat Thermal Energy Storage System for Domestic Applications. Energy Pro-cedia, 48, 300-308. http://dx.doi.org/10.1016/j.egypro.2014.02.035
[27] Liu, Z.L., Sun, X. and Ma, C.F. (2005) Experimental Investigations on the Characteristics of Melting Processes of Stearic Acid in an Annulus and Its Thermal Conductivity Enhancement by Fins. Energy Conversion and Management,
46, 959-969. http://dx.doi.org/10.1016/j.enconman.2004.05.012
[28] Tay, N.H.S., Bruno, F. and Belusko, M. (2013) Experimental Investigation of Dynamic Melting in a Tube-in-Tank PCM System. Applied Energy, 104, 137-148. http://dx.doi.org/10.1016/j.apenergy.2012.11.035
[29] Tay, N.H.S., Bruno, F. and Belusko, M. (2012) Experimental Validation of a CFD and an e-NTU Model for a Large Tube-in-Tank PCM System. International Journal of Heat and Mass Transfer, 55, 5931-5940.
http://dx.doi.org/10.1016/j.ijheatmasstransfer.2012.06.004
[30] Tay, N.H.S., Bruno, F. and Belusko, M. (2012) Designing a PCM Storage System Using the Effectiveness-Number of Transfer Units Method in Low Energy Cooling of Buildings. Energy and Buildings, 50, 234-242.
http://dx.doi.org/10.1016/j.enbuild.2012.03.041
[31] Liu, C. and Groulx, D. (2014) Experimental Study of the Phase Change Heat Transfer Inside a Horizontal Cylindrical Latent Heat Energy Storage System. International Journal of Thermal Sciences, 82, 100-110.
[32] Moreno, P., Solé, C., Castell, A. and Cabeza, L.F. (2014) The Use of Phase Change Materials in Domestic Heat Pump and Air-Conditioning Systems for Short Term Storage: A Review. Renewable and Sustainable Energy Reviews, 39, 1- 13. http://dx.doi.org/10.1016/j.rser.2014.07.062
[33] Lopez-Navarro, A., Biosca-Taronger, J., Corberan, J.M., Penalosa, C., Lazaro, A., Dolad, P. and Paya, J. (2014) Per-formance Characterization of a PCM Storage Tank. Applied Energy, 119, 151-162.
http://dx.doi.org/10.1016/j.apenergy.2013.12.041