© 2018, IRJET | Impact Factor value: 6.171 | ISO 9001:2008 Certified Journal | Page 7
Simulation Analysis of a New Startup Algorithm for TCP New Reno
Ahmed Yusuf Tambuwal
1, Aminu Bui Muhammed
21,2
Computer Science Unit, Usmanu Danfodiyo University, Sokoto (UDUS)
---***---Abstract -
Standard TCP (New Reno) is vulnerable to startup effects that cause loss of connection setup packets or result in long round trip time (RTT) greater than 1-second. When either of these events occurs, TCP New Reno resets its congestion state by reducing initial congestion window (IW) and slow-start threshold (ssthresh) values to 1 and 2 maximum segment size (MSS) respectively. In this condition, TCP requires multiple round trips to complete delay-sensitive transactions, thus resulting in poor user-experience. This paper presents a new congestion control algorithm that makes TCP more responsive by increasing its robustness against startup losses. Our main contribution in this paper is performing extensive simulation studies to investigate dynamics of the proposed algorithm. The main result obtained shows that an average latency gain of 15 RTTs can be achieved at up to 90% link utilisation, with a packet loss rate (PLR) of 1%.Key Words: Transmission Control Protocol, Congestion
Control, Startup, Responsiveness, Short-Lived Applications
1. Introduction
The transmission control protocol (TCP) 1 is the main protocol used on the Internet for reliable delivery of data packets between communicating hosts. A TCP client initiates a connection to a remote Internet server using a three-way handshake (3WHS) procedure. In general, the client then submits a data request, which is processed by the server resulting in a data response. Once data transmission starts, TCP attempts to maximize throughput without causing congestion on the network. Several works have focused on designing new TCP algorithms with better throughput performance such as in 2345.
Conversely, throughput performance is not the main requirement of short-lived interactive applications (e.g. web browsing and E-commerce), which account for a majority of TCP flows 67. Quite different from bulk transfers, interactive applications demand speedy delivery of few data chunks across the Internet within short delay bounds. Despite many algorithms proposed to solve this important problem 89101112, it still remains an open challenge for TCP.
This paper proposes a new algorithm that aims to make standard TCP (New Reno) more responsive by increasing its robustness against startup losses. TCP New Reno interprets the loss of connection setup packets (i.e. SYN or SYN-ACK) as a signal for serious network congestion, prompting a sender to reduce its initial congestion window (IW) to 1 maximum segment size (MSS) and its slow-start threshold (ssthresh) to 2 MSS 13. This response increases latency of short-lived interactive applications by
several round trips, thus significantly reducing end-user Internet experience.
While ignoring the SYN congestion signal and starting with very large IW and ssthresh values negates TCP conservative principles, there are strong motives to use a less conservative approach. Firstly, random packet loss is quite a common occurrence when data traverses wireless/mobile network links e.g. due to high contention between multiple users sharing the radio channel, poor weather conditions, or when a mobile host is obstructed and suffers temporary link outages 1415. Also, network middle boxes such as firewalls, proxies, and network address translators, can erroneously drop SYN packets due to suspicion of unwanted or malicious traffic 1617. In a more general context, TCP inherently causes loss of packets (including the SYN and SYN-ACK) when probing for available capacity and trying to maximize throughput 181920.
This paper investigates performance of a newly proposed algorithm called ‘TCP SYN Loss (TSL) Startup Algorithm’
that uses a halving congestion response function during
startup, which is less conservative than the current
standard. After connection setup is completed, standard
TCP congestion control is applied for the data transfer phase. Our proposed algorithm uses the following set of instructions.
( ) *
( )
(
)
+
The rest of this paper is organized as follows: Section 2 presents the simulation setup that we use for the study. Section 3 then presents and discusses extensive simulation results before the paper concludes with a summary in section 4.
2. Simulation Setup
In order to investigate dynamics of the proposed algorithm, sets of simulations are performed with realistic models that represent Internet connections at different congestion levels. The network topology, application traffic, and transport model are discussed below.
2.1 Network Topology
© 2018, IRJET | Impact Factor value: 6.171 | ISO 9001:2008 Certified Journal | Page 8 backbone is generally highly provisioned, though
[image:2.595.38.288.192.324.2]sometimes it can get congested 22. Conversely, the access link from an institution network to the Internet gateway is usually shared among multiple networks, and can reasonably be assumed to be the main bottleneck for wide-area Internet connections. Therefore simulations in this paper are performed using the single bottleneck, dumbbell topology illustrated in Figure 1.
Fig. 1 Single Bottleneck Dumbbell Simulation Topology
The available bandwidth at the end links is set high (i.e. 1Gbps), which causes the 10Mbps Internet service provider (ISP) access link between the routers to be the bottleneck. The main direction of traffic flow is from the left side where HTTP servers are connected to the Internet router, while the traffic destinations are connected to the access router on the right side.
2.2 Traffic Model
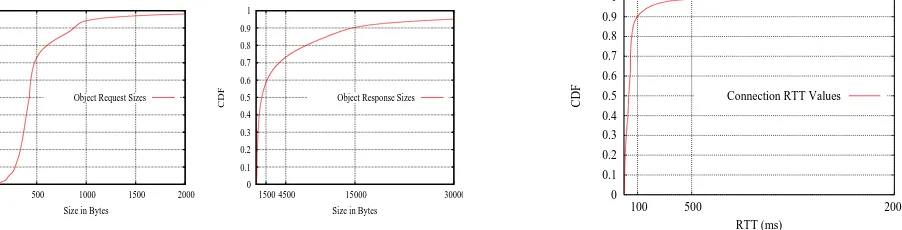
The Packmime-HTTP traffic generator 23 is used to simulate TCP-level traffic generated on an Internet link that is shared by many web clients and servers. The most important parameter is the rate parameter, which controls traffic intensity i.e. average number of new HTTP connections started each second. The distribution of Packmime-HTTP web object request and response sizes are plotted below. Comparing the web object size distributions of Packmime-HTTP model to a recent measurement by Google, the statistics are closely matched. In fact the average size of web pages has increased over the years because the number of objects contained in each page have increased rather than the object sizes.
Fig. 2. CDF of Packmime-HTTP Request and Response Sizes
Each new HTTP connection has a random request and response size, and number of objects associated to it. Three TCP traffic types are differentiated based on size of the client request and server response: short-lived web requests, medium-sized web download, and long-lived FTP traffic.
Short-lived web requests, in which the total volume of
data is not significantly greater than a few times the IW. Examples include small object requests, DNS lookups.
Medium-sized web downloads, when the flow
transfers a volume of data that takes many RTTs to complete (e.g. with a volume less than ten times the total capacity of the network path). Such flows do not achieve steady-state throughput predicted by TCP throughput equation. Examples include web-download, and email.
Long-lived FTP traffic, in which the total volume of
data is greater than the network capacity and where the flow achieves a steady-state throughput with a maximum value that may be predicted by the TCP throughput equation. Examples include large file downloads, video streaming etc.
In each simulation, the HTTP client-server pairs generate required traffic level using the formula below.
( )
( )
( )
2.3 DelayBox
DelayBox 24 is an NS-2 equivalent to dummynet, often used in network test beds to delay and drop packets. The delay box models the propagation and queuing delay incurred from the clients to server destinations.
Since all HTTP connections in Packmime-HTTP take place between only two NS-2 nodes, there must be an ns object to delay packets in each flow, rather than just having a static delay on the link between the two nodes. DelayBox also models bottleneck links and packet loss on an individual connection basis.
Fig. 3. CDF of HTTP Connection RTT Values
Bottleneck Link
•10Mbps
• 4ms RTT
• Buffer Size=40ms
HTTP Servers
Internet Router Access Router
End Links 1Gbps
HTTP Clients
HTTP Connections with Variable RTT’s
0 0.1 0.2 0.3 0.4 0.5 0.6 0.7 0.8 0.9 1
0 500 1000 1500 2000
C
D
F
Size in Bytes Object Request Sizes
0 0.1 0.2 0.3 0.4 0.5 0.6 0.7 0.8 0.9 1
1500 4500 15000 30000
C
D
F
Size in Bytes Object Response Sizes
0 0.1 0.2 0.3 0.4 0.5 0.6 0.7 0.8 0.9 1
100 500 2000
C
D
F
[image:2.595.66.517.632.747.2]© 2018, IRJET | Impact Factor value: 6.171 | ISO 9001:2008 Certified Journal | Page 9
2.4 Transport Protocol
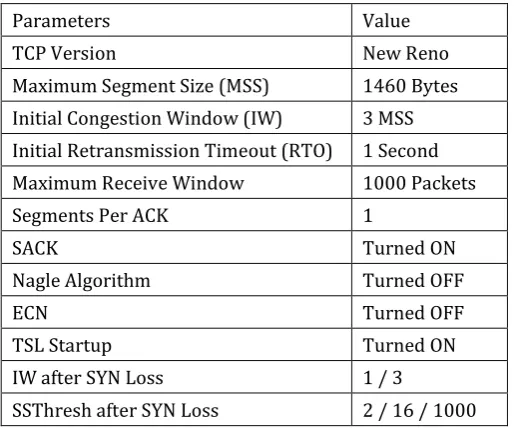
TCP New Reno is the transport protocol used for all End-hosts with Selective Acknowledgement (SACK) 25 enabled. However both Explicit Congestion Notification (ECN) and the Nagle algorithm 26 were disabled. Other TCP parameter settings are listed in Table 1.
[image:3.595.30.288.258.472.2]The TCP latency is calculated as the average response time of individual web object requests. NS2 code was changed to enable TSL startup algorithm i.e. choosing different values of IW and ssthresh upon SYN-ACK loss during the 3WHS.
Table 1: TCP Simulation Parameters
Parameters Value
TCP Version New Reno
Maximum Segment Size (MSS) 1460 Bytes
Initial Congestion Window (IW) 3 MSS
Initial Retransmission Timeout (RTO) 1 Second
Maximum Receive Window 1000 Packets
Segments Per ACK 1
SACK Turned ON
Nagle Algorithm Turned OFF
ECN Turned OFF
TSL Startup Turned ON
IW after SYN Loss 1 / 3
SSThresh after SYN Loss 2 / 16 / 1000
2.5 Description of Simulation Graphs
With the aim to evaluate performance of the different TSL variants, TCP implementation in ns2 has been modified to include an option that implements the TSL startup algorithm. This chapter performs sets of simulations that compare TCP to five TSL variants at different levels of congestion.
The following notations are used to represent TCP and TSL variants.
TSL 1, 2 – IW = 1 and ssthresh = 2 after SYN-ACK loss
TSL 1, 16 - IW = 1 and ssthresh = 16 after SYN-ACK loss
TSL 1, 1000 - IW = 1 and ssthresh = 1000 after SYN-ACK
loss
TSL 3, 2 - IW = 3 and ssthresh = 2 after SYN-ACK loss
TSL 3, 16 - IW = 3 and ssthresh = 16 after SYN-ACK loss
TSL 3, 1000 - IW = 3 and ssthresh = 1000 after SYN-ACK
loss
3. Simulation Results
Each set of simulations is run with a constant average traffic load that fluctuates stochastically over time
depending on application and transport protocol behaviour. A simulation run is terminated after a total of 750,000 HTTP client-server connection pairs have been completed. This allows the sample metrics to reach a reasonable stable value with very low sampling errors. Also a warm up interval of 60 seconds is applied at the beginning of each simulation to disregard startup effects.
The main results show impact of TSL startup on web transfers with cases of lost SYN-ACK segments. The impact of the transport protocol on network performance is also monitored based on packet loss rates and bottleneck link utilisation.
3.1 Response Times of Web Connections with SYN-ACK Loss
In the first simulation, the response times of web connections that experience SYN-ACK loss are plotted and compared for the different startup algorithms. The response times are measured in units of RTT so that all the connections with different RTTs are normalized and presented in a uniform scale. The response times plotted do not include the 1-second initial RTO delay before the SYN-ACK is retransmitted. Hence the fastest response time is 2 RTTs, including the 3WHS.
Fig. 4. Response Time (in RTT) of short web connections with SYN-ACK loss at 40% congestion
The graph on the left in Figure 4 plots response times for object sizes between 1KB and 50KB. This results in a scatter plot with a stepwise function. The steps represent boundaries, which separate connections that can be completed in a minimum number of RTTs if no further losses occur after SYN-ACK retransmission. As can be seen in the graph, many connections deviate from the center where the best-fitting line would pass. The frequency and level of deviation largely depends on the startup algorithm employed.
The graph on the right in Figure 4 shows the corresponding complementary cumulative distribution
2 5 10 50 100 200 500
1 8 20 50
R
e
s
p
o
n
s
e
T
i
m
e
(
R
o
u
n
d
T
r
i
p
s
)
Web Object Size (KB) Latency of All Web Connections with SYN-ACK Loss
SYN Loss Startup Algorithms TSL 1, 2
TSL 1, 16 TSL 1, 1000
TSL 3, 2 TSL 3, 16 TSL 3, 1000
0.01 0.1 1
2 5 10 50 100 200
C
o
m
p
l
e
m
e
n
t
a
r
y
C
D
F
Response Time (RTT) Response Time CCDF Distribution - 40% Link Utilisation
SYN Loss Startup Algorithms TSL 1, 2
TSL 1, 16 TSL 1, 1000
[image:3.595.310.557.387.573.2]© 2018, IRJET | Impact Factor value: 6.171 | ISO 9001:2008 Certified Journal | Page 10 (CCDF). The response times of the top 10% of connections
is similar because these connections sizes are less than 1 maximum segment size (1460 Bytes). Hence these connections are not affected by any congestion action apart from the 1-second SYN-ACK RTO delay.
As expected, the brute-start variants result in fastest response times for majority of web object downloads, up
to the 70th percentile. This is because brute-start variants
can transfer up to 4.5KB in 2 RTTs if no further loss occurs. Furthermore, due to higher number of segments in flight, the brute-start variants are more robust to early packet losses (e.g. for the first and second RTT) as they can take advantage of limited transmit 27 and fast recovery algorithms.
TSL 3,2 and TSL 3,1000 startup variants become progressively slower than TSL 3,16 as object size increases. This is due to slower acceleration and higher induced congestion respectively. Similarly, TSL 1,16 and TSL 1,1000 variants become progressively faster than TCP (TSL 1,2) as object size increases. Between the gentle-start variants, TSL 1,1000 has slightly higher tail latencies compared to TCP.
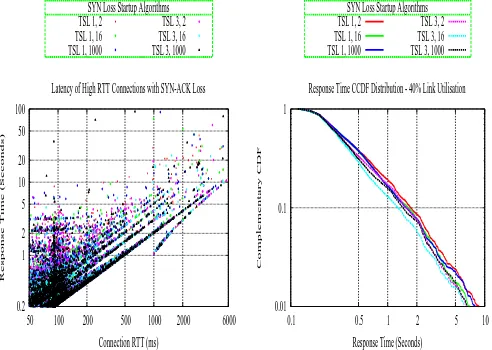
3.2 Response Times of High RTT Connections
[image:4.595.38.284.541.716.2]In this section, response times of high-RTT connections are specifically examined. The RTT represents how much time it takes, regardless of object size, for a single transaction between the client and server. This means high-RTT connections are particularly affected by multiple numbers of round trips. For example, 20 RTTs results in a 1 second delay for a 50ms connection, but a 500ms connection perceives a 10 seconds waiting delay. Almost 50% of end-to-end connections have an RTT less than 50ms. Hence for the purpose of this study, high-RTT connections are selected as those having an RTT that is greater than 50ms.
Fig. 5. Response Time (in seconds) of high-RTT connections with SYN-ACK loss at 40% congestion
The CCDF graph in Figure 5 shows that TSL startup reduces average response time by approximately 500ms
at the 10th percentile, and by up to 3 seconds for the
bottom 1% of high-RTT connections with SYN-ACK loss. Apart from measuring average performance, it is also important to consider individual HTTP flows to ensure latency fairness, which is assessed using the correlation of response times for web flows. The spread of responses in Figure 5 shows higher occurrences of extreme response times (above 10 seconds) when TCP is used compared to all the TSL startup variants. This proves that using TSL startup improves fairness for web flows, as the response times of individual connections are more closely correlated.
Another interesting phenomenon that is observed in left graph of Figure 5 occurs for connections with RTT greater than 1 second. Due to the initial RTO value of 1 second, these connections are assumed to have lost the SYN-ACK packet after 1 second, causing spurious SYN-ACK retransmission. However when the response to the initial SYN-ACK eventually arrives, the connection proceeds and finishes faster than connections with SYN-ACK drops.
3.3 Response Time Distribution at High Congestion
This section measures latency performance at very high congestion levels of 90% and 98% link utilisation as a worst-case scenario. High congestion may occur infrequently on a network link due to flash crowds of HTTP flows or due to initiation of simultaneous bulk transfers.
At 90% link utilisation, all TSL startup variants continue to perform better than TCP for web transactions. However the overall web performance is considerably worse. For example, average TSL response time is
increased from 20 to 50 RTTs at the top 10th percentile,
and from 100 to 400 RTTs for the top 1 percentile. Similarly, average TCP response time is increased from 30
to 60 RTTs at the top 10th percentile, and from 180 to 600
RTTs for the top 1% of connections.
Also at 90% congestion level, starting with large IW of 3 segments causes collateral damage for self and other HTTP flows. This is shown on the left graph of Figure 6 where the latency performance of brute-start variants for small web objects is similar or worse than other TSL variants, unlike the situation at 40% congestion.
At 98% link utilisation, a number of TSL startup variants result in too high PLR, which ultimately results in worse average latency performance than TCP. In particular, keeping the ssthresh value at an infinitely high value does not benefit short web flows as TSL 1,1000 and TSL 3,1000 variants have highest web response time. Conversely, TSL 3,16 variant has the overall best performance across all the different congestion levels considered as it allows most object downloads to be 0.2
1 2 5 10 20 50 100
50 100 200 500 1000 2000 6000
R
e
s
p
o
n
s
e
T
i
m
e
(
S
e
c
o
n
d
s
)
Connection RTT (ms) Latency of High RTT Connections with SYN-ACK Loss
SYN Loss Startup Algorithms TSL 1, 2 TSL 1, 16 TSL 1, 1000
TSL 3, 2 TSL 3, 16 TSL 3, 1000
0.01 0.1 1
0.1 0.5 1 2 5 10
C
o
m
p
l
e
m
e
n
t
a
r
y
C
D
F
Response Time (Seconds) Response Time CCDF Distribution - 40% Link Utilisation
SYN Loss Startup Algorithms TSL 1, 2 TSL 1, 16 TSL 1, 1000
© 2018, IRJET | Impact Factor value: 6.171 | ISO 9001:2008 Certified Journal | Page 11 completed in one or few RTTs, and also accelerates with
[image:5.595.36.285.123.287.2]an appropriate speed to complete larger object downloads quickly, without causing too high congestion.
Fig. 6 Response Time (in RTT) at very high congestion
3.4 Average Response Times at Different Congestion Levels
Figure 7 shows a summary of average web response times at different congestion levels.
Fig. 7. Average response times (in RTT) of all connections with SYN-ACK loss
At low-to-moderate congestion (0-40% link utilisation
level), TSL startup helps to reduce average web response time by 1-5 RTTs.
At moderate-to-high congestion (40-90% link
utilisation level), TSL startup becomes more critical for protecting web flows from early congestion action. It reduces average web response time by 13 RTTs.
At very high congestion (greater than 90%), TSL
startup worsens web performance, increasing the average response time by up to 70% for the worst case.
Based on results obtained, some preliminary conclusions can be made:
TSL startup benefits web flows for faster completion
time in most cases.
Starting with a larger IW after SYN-ACK loss is very
useful because it allows up to 75% of web objects to be downloaded in a single round trip assuming no further losses occur.
If TSL startup is used, a mechanism that provides
feedback is beneficial to interrupt its use over a short-term basis while there is very high congestion.
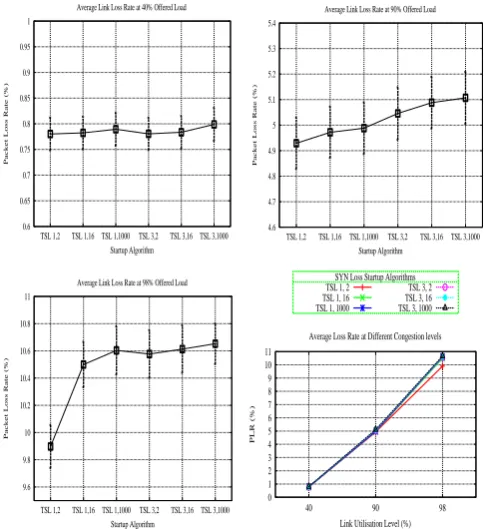
3.5 Average Packet Loss Rate
This section reports average PLR of bottleneck link at 40%, 90%, and 98% link utilisation levels when using TCP and TSL startup variants respectively.
[image:5.595.308.551.302.567.2]
Fig. 8. Average packet loss rates measured with 95% confidence intervals
TABLE 2. Percentage Increase in Average PLR at Different Congestion Levels
Congestion
Level Increase in Average PLR due to TSL Startup (%)
TSL 1,
16 TSL 1, 1000 TSL 3, 2 TSL 3, 16 TSL 3, 1000
40% 0.268 0.93 0.038 0.42 2.329
90% 0.86 1.18 2.32 3.13 3.49
98% 5.74 6.66 6.43 6.745 7.093
0.01 0.1 1
2 5 10 50 100 200 500 1000
C o m p l e m e n t a r y C D F
Response Time (RTT) Response Time CCDF Distribution - 90% Link Utilisation
SYN Loss Startup Algorithms TSL 1, 2 TSL 1, 16 TSL 1, 1000
TSL 3, 2 TSL 3, 16 TSL 3, 1000
0.01 0.1 1
2 5 10 50 100 200 500 1000 2000
C o m p l e m e n t a r y C D F
Response Time (RTT) Response Time CCDF Distribution - 98% Link Utilisation
SYN Loss Startup Algorithms TSL 1, 2
TSL 1, 16 TSL 1, 1000
TSL 3, 2 TSL 3, 16 TSL 3, 1000
0 20 40 60 80 100 120 140
40 90 98
N u m b e r o f R T T s
Link Utilisation Level (%)
Ave. Latencies for Web Connections with SYN-ACK Loss SYN Loss Startup Algorithms
TSL 1, 2 TSL 1, 16 TSL 1, 1000
TSL 3, 2 TSL 3, 16
TSL 3, 1000 0.6
0.65 0.7 0.75 0.8 0.85 0.9 0.95 1
TSL 1,2 TSL 1,16 TSL 1,1000 TSL 3,2 TSL 3,16 TSL 3,1000
P a c k e t L o s s R a te ( % ) Startup Algorithm Average Link Loss Rate at 40% Offered Load
4.6 4.7 4.8 4.9 5 5.1 5.2 5.3 5.4
TSL 1,2 TSL 1,16 TSL 1,1000 TSL 3,2 TSL 3,16 TSL 3,1000
P a c k e t L o s s R a te ( % ) Startup Algorithm Average Link Loss Rate at 90% Offered Load
9.6 9.8 10 10.2 10.4 10.6 10.8 11
TSL 1,2 TSL 1,16 TSL 1,1000 TSL 3,2 TSL 3,16 TSL 3,1000
P a c k e t L o s s R a te ( % ) Startup Algorithm Average Link Loss Rate at 98% Offered Load
0 1 2 3 4 5 6 7 8 9 10 11
40 90 98
P L R ( % )
Link Utilisation Level (%) Average Loss Rate at Different Congestion levels
SYN Loss Startup Algorithms TSL 1, 2 TSL 1, 16 TSL 1, 1000
[image:5.595.37.277.384.575.2]© 2018, IRJET | Impact Factor value: 6.171 | ISO 9001:2008 Certified Journal | Page 12 Based on accumulated results summarized in Table 2, a
number of conclusions can be drawn:
The level of performance degradation due to TSL
startup depends on link congestion level. At 40% congestion level, TSL startup does not significantly increase the average PLR. However as congestion level increases, TSL startup becomes more harmful, with a higher rate of increase of average PLR.
At low-to-moderate congestion levels, keeping the
ssthresh infinitely high causes higher PLR compared to keeping IW high. This can be explained by the fact that the congestion window grows too quickly, causing larger instantaneous buffer queues that are more susceptible to packet drops when a sudden traffic burst occurs.
At high congestion levels, collapsing the IW to 1 helps
to keep the average PLR relatively low compared to when IW is kept high. This is because starting with an IW of 3 segments increases probability of causing packet losses at the already congested buffer queues.
When congestion is very high, it is very important to
be conservative and reduce both IW and ssthresh to lowest possible values as practiced by standard TCP.
3.6 Instantaneous Packet Loss Rate
Figure 9 compares instantaneous PLR measured at 1-second intervals for TCP and TSL 3,16 variant. The left graph shows that at 40% link utilisation, the loss behaviour is quite similar, with both algorithms experiencing occasional spikes in PLR above 10%. At 90% link utilisation (right graph), TSL 3,16 causes higher instantaneous PLR with a peak value of 26% compared to 19% for TCP.
Fig. 9. Instantaneous packet loss rates measured at 1-second intervals
[image:6.595.311.552.76.251.2]Figure 10 plots CCDF of instantaneous PLR for different congestion levels. The average PLR only measures the average number of packets dropped during an arbitrary long period of time. This cannot adequately reflect packet loss of individual flows during a small period of time when the PLR fluctuates severely due to congestion. Related to this problem is a basic question of how correlated are the losses. This is better represented by the instantaneous PLR graphs plotted below.
Fig. 10. CCDF of instantaneous packet loss rates at different levels of congestion
For example a short web flow may suffer multiple
losses at startup because a bulk FTP connection is
occupying the router’s entire buffer. Conversely, an FTP may suffer losses because a new flow starts too aggressively, exceeding the available capacity at the bottleneck buffer.
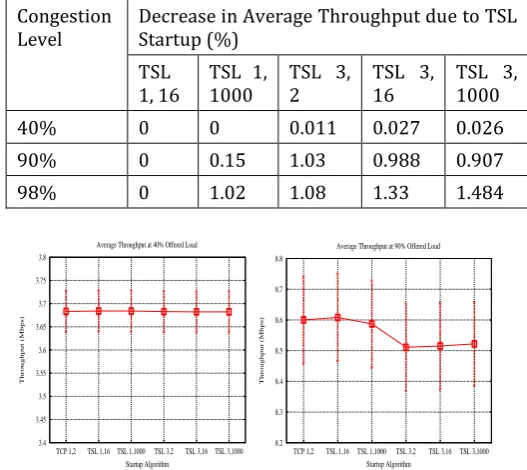
3.7 Average Link Throughput
[image:6.595.40.280.508.636.2]Overall, there is only a small impact on average throughput as a result of using TSL startup algorithms. The highest throughput drop is 1.484%, which occurs at 98% link utilisation and using the most aggressive TSL variant. However, in most cases there is always a small decrement in throughput, which is a direct consequence of higher PLR. This result indicates a slight throughput tradeoff for lower web latency.
TABLE 3. Percentage Loss in Average Throughput at Different Congestion Levels
Congestion
Level Decrease in Average Throughput due to TSL Startup (%)
TSL
1, 16 TSL 1, 1000 TSL 3, 2 TSL 3, 16 TSL 3, 1000
40% 0 0 0.011 0.027 0.026
90% 0 0.15 1.03 0.988 0.907
98% 0 1.02 1.08 1.33 1.484
0 2 4 6 8 10 12 14 16
15mins 30mins 45mins 1hr
P
L
R
(
%
)
Simulation Time Instantaneous PLR measured at 1s Intervals (40% Ave. Link Utilisation)
SYN Loss Algorithm TCP Startup TSL 3,16 Startup
0 5 10 15 20 25 30
15mins 30mins 45mins 1hr
P
L
R
(
%
)
Simulation Time Instantaneous PLR measured at 1s Intervals (90% Ave. Link Utilisation)
SYN Loss Algorithm TCP Startup TSL 3,16 Startup
0.01 0.1 1
0.01 0.1 0.5 1 2 5 10 20 30
C
o
m
p
le
m
e
n
ta
ry
C
D
F
PLR (%) PLR CCDF Distribution Startup Algorithm (Congestion Level) TSL 1, 2 (40%)
TSL 1,2 (90%) TSL 1,2 (98%)
TSL 3, 16 (40%) TSL 3,16 (90%) TSL 3,16 (98%)
3.4 3.45 3.5 3.55 3.6 3.65 3.7 3.75 3.8
TCP 1,2 TSL 1,16 TSL 1,1000 TSL 3,2 TSL 3,16 TSL 3,1000
T
h
r
o
u
g
h
p
u
t
(
M
b
p
s
)
Startup Algorithm Average Throughput at 40% Offered Load
8.2 8.3 8.4 8.5 8.6 8.7 8.8
TCP 1,2 TSL 1,16 TSL 1,1000 TSL 3,2 TSL 3,16 TSL 3,1000
T
h
r
o
u
g
h
p
u
t
(
M
b
p
s
)
[image:6.595.300.564.522.757.2]© 2018, IRJET | Impact Factor value: 6.171 | ISO 9001:2008 Certified Journal | Page 13 Fig. 11. Average link throughput measured with 95%
confidence intervals
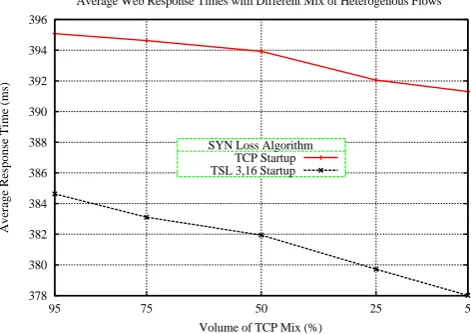
3.8 TCP Fairness Measure
[image:7.595.39.275.360.527.2]New congestion control mechanisms are required to interact fairly with TCP. In most cases TCP fairness is estimated based on the bandwidth share (throughput) of the new protocol compared to TCP e.g. using Jains fairness index or Max-min fairness method. However when the metric of interest is latency, the conventional methods are not appropriate.
Fig. 12. Heterogeneous Traffic Mix with Different Flows using TCP and TSL Startup
For this simulation, the latency fairness is measured as the relative increment in response time of short TCP flows when there is an increase in volume of TSL flows in a heterogeneous traffic scenario. A number of simulations are performed with a varying traffic mix of HTTP flows that use TCP and TSL startup respectively. For each simulation the average traffic level is kept constant at 40% link utilisation.
Figure 12 shows that as the percentage of TSL flows increases (left to right), average response time of both TSL and TCP flows is reduced accordingly. This means that when a number of Internet hosts implement TSL startup algorithm, performance of older TCP versions is not negatively affected but rather they also benefit from faster web response time.
4. CONCLUSION
In principle, TCP should be able to operate seamlessly over a wide spectrum of communication systems ranging from fast hard-wired connections to slow wireless connections. In reality, many standard TCP mechanisms are not well suited for lossy and long-delay Internet paths, creating possibility of degraded performance in specific scenarios. This paper presented TSL startup algorithm, which decouples TCP congestion control used during the startup phase from the data transfer phase. By using a gentler loss response function, the TSL startup algorithm improves TCP robustness against non-congestion related packet losses that occur due to various startup effects. The key results are summarized below.
I. TSL startup reduces web latency for all link types
investigated. Average latency gain of 15 RTTs is achieved at 90% link utilisation.
II. TSL 3,16 variant has best overall performance due to
three main reasons. The first is related to web object size distribution, which majorly consists of small sizes that can fit into 3 segments. Also starting with 3 segments allows the sender to be more robust to early loss of data packets. Third, when the ssthresh is infinitely high, there are long-lived flows that take advantage of TSL startup to grow their cwnd too quickly, causing collateral damage for other short flows. Highest individual latency gains occur for connections with high-RTT.
III. TSL startup reduces web latency at low, moderate
and high congestion levels. However when the link is almost fully utilized (98%), then there can be no latency gain due to high number of buffer drops.
IV. There are many cases where increase in PLR at
bottleneck link due to use of TSL startup is negligible. For example at 40% link utilisation, the increase in average PLR is less than 1% unless the most aggressive TSL variant is used (TSL 3,1000).
V. On average, TSL startup does not considerably
increase average PLR for all links investigated. The only exception is for 98% link utilisation where TSL startup increases average PLR by up to 7%.
VI. The reduction in web latency is achieved at the
expense of slight reduction in link utilisation and throughput of long-lived flows. This is a consistent trend exhibited in all simulations performed and can be considered a positive consequence as it increases fairness to short flows.
REFERENCES
1. W. R. Stevens, TCP/IP Illustrated Volume I: The
Protocols, New York: Addison-Wesley, 1994.
9.2 9.3 9.4 9.5 9.6 9.7 9.8
TCP 1,2 TSL 1,16 TSL 1,1000 TSL 3,2 TSL 3,16TSL 3,1000
T
h
r
o
u
g
h
p
u
t
(
M
b
p
s
)
Startup Algorithm Average Throughput at 98% Offered Load
3 4 5 6 7 8 9 10
40 90 98
T
h
r
o
u
g
h
p
u
t
(
M
b
p
s
)
Link Utilisation Level (%) Average Link Throughput at Different Congestion levels
TSL 1, 2 TSL 1, 16 TSL 1, 1000
TSL 3, 2 TSL 3, 16 TSL 3, 1000
378 380 382 384 386 388 390 392 394 396
5 25
50 75
95
A
v
er
a
g
e
R
e
sp
o
n
se
T
im
e
(m
s)
Volume of TCP Mix (%)
Average Web Response Times with Different Mix of Heterogenous Flows
© 2018, IRJET | Impact Factor value: 6.171 | ISO 9001:2008 Certified Journal | Page 14
2. A. Baiocchi, A. Castellani, and F. Vacirca,
“YeAH-TCP: Yet another highspeed TCP,” in Proceedings of PFLDNET, Los Angeles, CA, February 2007.
3. S. Ha, I. Rhee, and L. Xu, “CUBIC: a new
TCP-friendly high-speed TCP variant,” SIGOPS Oper. Syst. Rev., 42(5), 2008.
4. R. Mittal, V. T. Lam, N. Dukkipati, E. Blem, H.
Wassel, M. Ghobadi, A. Vahdat, Y. Wang, D. Wetherall, and D. Zats, “TIMELY: RTT-based Congestion Control for the Datacenter,” ACM SIGCOMM Comp Commun. Review, vol. 45, no. 4, pp. 537–550, 2015.
5. N. Cardwell, Y. Cheng, C. S. Gunn, S. H. Yeganeh et
al., “BBR: congestion-based congestion control,” Commun. ACM, vol. 60, no. 2, pp. 58–66, 2017.
6. P. Borgnat, G. Dewaele, K. Fukuda, P. Abry, and K.
Cho, "Seven Years and One Day: Sketching the Evolution of Internet Traffic," INFOCOM 2009, IEEE, Rio de Janeiro, 2009, pp. 711-719.
7. “Scaling in Internet Traffic: A 14 Year and 3 Day
Longitudinal Study with Multiscale Analyses and Random Projections,” IEEE/ACM Trans. on Networking, vol. 24 (4), pp. 2152-2165, 2017.
8. N. Dukkipati, T. Refice, Y. Cheng, J. Chu, T. Herbert,
A. Agarwal, A. Jain, and N. Sutin, “An Argument for Increasing TCP’s Initial Congestion Window,” ACM Comput. Commun. Rev., 40, 2010.
9. S. Radhakrishnan, Y. Cheng, J. Chu, A. Jain, and B.
Raghavan. “TCP Fast Open,” In Proc. of the ACM Int. Conf. on Emerging Networking Experiments and Technologies (CoNEXT), Dec. 2011.
10. H. Sangtae, R. Injong, “Taming the elephants: New
TCP slow start,” Elsevier Computer Networks, vol. 55 (9), pp. 2092-2110, Jun, 2011.
11. T. Flach et.al, “Reducing web latency: the Virtue of
Gentle Aggression”, in Proc. of ACM SIGCOMM, (Hong Kong, China), pp. 159-170, 2013.
12. B. Briscoe et.al, “Reducing Internet Latency: A
Survey of Techniques and their merits,” in IEEE Commun. Surveys & Tutorials, vol. 18 (2), pp. 2149-2196, 2016.
13. M. Allman, V. Paxsons, “TCP Congestion Control,”
IETF RFC 5681, Sep. 2009.
14. L. Angrisani, and M. Vadursi, "Cross-Layer
Measurements for a Comprehensive
Characterization of Wireless Networks in the Presence of Interference," IEEE Trans. on Instrumentation and Measurement, vol. 56, (4), pp.1148-1156, 2007.
15. A. Sheth, S. Nedevschi, R. Patra, S. Surana,
L. Subramanian, and E. Brewer, “Packet Loss Characterization in WiFi-based Long Distance Networks,” IEEE INFOCOM, Alaska, USA, 2007.
16. A. Medina, M. Allman, and S. Floyd, “Measuring
Interactions Between Transport Protocols and Middleboxes,” in Proceedings of the 4th ACM SIGCOMM conf. on Internet measurement, Taormina, Sicily, 2004, pp. 336-341.
17. W. Zhaoguang, Z. Qian, Q. Xu, Z. Mao, and M.
Zhang, "An untold story of middleboxes in cellular networks," ACM SIGCOMM Comp. Commun. Review, vol. 41, (4), pp. 374-385, 2011.
18. Akamai, “State of the Internet,” [online]. Available:
http://www.akamai.com/html/about/press/rele ases/2013/press_101613.html (Accessed: 14 October 2013).
19. G. Linden, “Make Data Useful” [online]. Available:
http://sites.google.com/site/glinden/Home/Stanf ordDataMining.2006-11-28.ppt . Retrieved 20 Mar. 2014.
20. Nokia Siemens Network,
http://br.nsn.com/file/2103/latencywhitepaperp rintversion White paper. Retreieved 20 Mar. 2014.
21. K. Fall, K. Varadhan, ns Notes and Documentation,
Technical report, the VINT UC Berkley, LBL, USC/ISI, Xerox PARC, 2003.
22. L. Qiu, Y. Zhang, and S. Keshav, “On individual and
aggregate TCP performance,” Cornell CS Tech. Rep. TR99-1744, May 1999.
23. J. Cao, C. S. William, G. Yuan, J. Kevin, S. F.
Donelson, and W. Michele, "Stochastic models for generating synthetic HTTP source traffic." In INFOCOM 2004. Twenty-third Annual Joint Conf. of the IEEE Comp. and Commun. Societies, vol. 3, pp. 1546-1557, 2004.
24. NS2, “Use of DelayBox with Packmime-HTTP,”
[online]. Available:
http://www.isi.edu/nsnam/ns/doc/node560.htm l (Accessed 17 November 2013).
25. S. Floyd, J. Mahdavi, M. Mathis, and M. Podolsky,
“An extension to the selective acknowledgement (SACK) option for TCP,” RFC 2883, 2000.
26. J. Nagle, “Congestion Control in IP/TCP
Internetworks,” RFC 896, January 1984.
27. M. Allman, H. Balakrishnan, and S. Floyd,