© 2017, IRJET | Impact Factor value: 5.181 | ISO 9001:2008 Certified Journal
| Page 736
Prioritization of Data Using Sentiment Analysis in Calamitous Situation
Suchita M. Patil, R. P. Mirajkar, Neeta B. Patil, Sagar B. Patil
Computer Science and Engineering Dept, Bharati Vidyapeeth’s College of Engineering,
Kolhapur (District), Maharashtra-416013, INDIA. [email protected],
[email protected], [email protected], [email protected]
---***---Abstract -
As of now we know present industries and somesurvey companies are mainly taking decisions by data obtained from web. As we see WWW is a rich collection of data that is mainly in the form of unstructured data from which we can do analysis on those data which is collected on some situation or on a particular thing.
In this paper, we are going to talk how modular analysis is done on the data which is collected from the Twitter using hadoop. Twitter is an online web application which contains rich amount of data that can be a structured, semi structured and un-structured data. We can collect the data from the twitter by using BIGDATA eco-system using hadoop. And doing analysis on Twitter is also difficult due to language that is used for comments. And, coming to analysis there are different types of analysis that can be done on the collected data. So here we are taking modular analysis, for this we are using hadoop tools.
In big data world, Hadoop Distributed File System (HDFS) is very popular. It provides a framework for storing data in a distributed environment and also has set of tools to retrieve and process. These data set using map-reduce concept. In this paper, a thorough work has been carried to discuss that how big data analytics can be performed on data stored on Hadoop distributed file system. Apache Pig and Hive are two projects which are layered on top of Hadoop, and provide higher-level language to use Hadoop’s MapReduce library. In this paper, first of all, the basic concepts of Pig and Hive are introduced. In part II, a map-reduce job using Pig has been explained. In part III, a map-reduce job using Hive is discussed. The final section of this paper compares and concludes both techniques.
Key Words
:
BIGDATA, Flume, Hive, HQL, SentimentAnalysis, Structured, Twitter, Un-Structured
1. INTRODUCTION
Apache's Hadoop framework has become synonymous with the big data movement and is it designed to become the dominant data management platform for us all. Present situation is people completely are expressing their thoughts through online blogs, discussion forms and also some online applications like Facebook, Twitter, etc.
If we take Twitter as our example nearly 1TB of text data is generating within a week in the form of tweets. So, by
this it is understand clearly how this Internet is changing the way of living and style of people. Among these tweets can be categorized by the hash value tags for which they are commenting and posting their tweets. So, now many companies and also the survey companies are using this for doing some analytics such that we can predict the success rate of their product or also we can show the different view from the data that we have collected for analysis [1]. There are different ways to get Twitter data or any other online streaming data where they want to code lines of coding to achieve this. And, also they want to perform the sentiment analysis on the stored data where it makes some complex to perform those operations. Coming to this paper we have achieved by this problem statement and solving it in BIGDATA by using Hadoop and its Eco Systems. And finally we have done sentiment analysis on the Twitter data that is stored in HDFS. So, here the processing time taken is also very less compared to the previous methods because Hadoop MapReduce and Hive are the best methods to process large amount of data in a small time [2].
2. LITERATURE REVIEW
Analysis has aroused the interest of many researches in recent year, since subjective texts are useful for many applications [3]. In particular, analysis on online reviews has become a hot research field. Survey on latest development in analysis, and makes an in-depth. Introduction on its research and application in business [4].
Our day to day life has always been influence by what people think. Ideas and opinion of others have always affected our own opinion. Effective analysis is the computational treatment of opinions, sentiments and subjectivity of text [5]. In this review we take look at the various challenges and applications of analysis.
© 2017, IRJET | Impact Factor value: 5.181 | ISO 9001:2008 Certified Journal
| Page 737
3. DESIGN ASPECTS
As we have already discussed about some of the ways of getting data and also performing the sentiment analysis on those data. Here they are going to use some coding techniques for crawling the data from the twitter where they can extract the data from the Twitter web pages by using some code that may be written either in JAVA, Python etc. For those they are going to download the libraries that are provided by the twitter guys by using this they are crawling the data that we want particularly [7]. After getting raw data they will filter by using some old techniques and also they will find out the positive, negative and moderate words from the list of collected words in a text file. All these words should be collected by us to filter out or do some sentiment analysis on the filtered data [2] [8]. These words can be called as a dictionary set by which they will perform sentiment analysis. Also, after performing all these things and they want to store these in a database and coming to here they can use RDBMS [9] where they are having limitations in creating tables and also accessing the tables effectively.
3.1 Proposed System
We want to overcome limitations in creating, accessing and maintaining tables, here we use Big Data problem statement also we use Hadoop and its Ecosystems, for getting raw data from the Twitter using Hadoop [2]. As shown in fig.1,we are going to design and implement a new system that aiming to provide correct information source to help units by detecting and summarizing high priority tweets which are posted during calamitous situation.
Fig.1: Architecture of Proposed System
3.2
Methodology
Step 1: Creating Twitter Application: - First of all if we will do sentiment analysis on Twitter data, we want to get Twitter data first. So to get it, we want to create an account in Twitter developer and create an application.
Step 2: Getting data using Hadoop: - After creating an application in the Twitter developer site, we will use the consumer key and secret along with the access token and secret values. By which we can access Twitter and we can get the tweet information.
Step 3: Making structured data from unstructured data: - Information collected from twitter will be in unstructured format. So before applying analysis process on that data, we want to make it as structured data, like if tweet is “ i am feeling verryyyyy lucky today ” which is unstructured and the structured form of the same is “I am feeling very lucky today” which identifies and maps word ‘verryyyyy’ to ‘very’.
Step 4: Applying sentiment analysis to data: -
And the last step will be to perform actual sentiment analysis and prioritizing the data using mapReduce algorithm, which is detailed below:Fig.2: Steps in mapReduce algorithm
The MapReduce algorithm contains two important tasks, namely Map and Reduce.
The map task is done by means of Mapper Class
The reduce task is done by means of Reducer Class.
4. RESULT AND DISSCUTION ON MODULES
The keys are generated after creating application and keys are the API key and API secret also two access tokens that we want to generate it by ourselves by clicking the generate access token. After clicking that we can get the two keys that are our account access token and coming to that one is Access token and the other one is the Access token secret.
© 2017, IRJET | Impact Factor value: 5.181 | ISO 9001:2008 Certified Journal
| Page 738
Fig.3: Welcome windowFig. 3 shows GUI for welcome window of project. Here three fields are given to user. Also we provide facility for searching keyword.
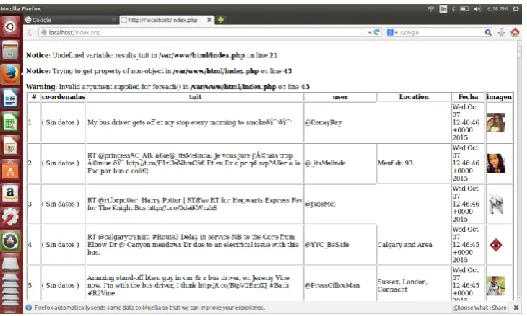
Fig.4: Resulted tweets
Figure 4 shows the resulted tweets of keyword bombing. Twitter sets limit on accessing tweets i.e. maximum number of tweets you can access via the API is, the latest 3200 tweets and after every 15 min new Tweets will be available.
In this section, we observe result with the help of charts. In 1st chart we considered 7 days to take values on time at 10 A.M and 11 A.M.
DATE NO. OF TWEETS
AT 10 A.M. AT 11 A.M.
9-NOV-2016 25 35
10-NOV-2016 85 70
11-NOV-2016 115 95
12-NOV-2016 90 75
13-NOV-2016 125 110
14-NOV-2016 94 105
[image:3.595.325.550.241.374.2]15-NOV-2016 85 110
Table-1: Number of tweets on specific data and time
Chart-1 Number of tweets on specific date and time
Chart-1 shows number of tweets collects from twitter on specific date and time. Here we took one single keyword for all days.
Chart-2 is related to time required for execution. Execution time is depends on the frequency. Execution time is inversely proportional to frequency. If available frequency is high then we required minimum execution time and vice versa.
DATE EXECUTION TIME
AT 10 A.M. AT 11 A.M.
9-NOV-2016 5 7
10-NOV-2016 4 3
11-NOV-2016 9 6
12-NOV-2016 2 9
13-NOV-2016 13 17
14-NOV-2016 6 8
15-NOV-2016 3 4
[image:3.595.37.301.356.514.2] [image:3.595.318.551.527.640.2]© 2017, IRJET | Impact Factor value: 5.181 | ISO 9001:2008 Certified Journal
| Page 739
Chart-2 Required execution time for particular dayChart 2 shows that on particular day how much time take for execution. As I said earlier, execution time is totally depends on frequency available at that point.
Chart-3 is about frequency which is available at the time of execution of application. If we use 2G frequency then their range is in between GSM 900 to GSM 1800 and for 3G range is UMTS 900 to UMTS 2100.
DATE FREQUENCY
AT 10 A.M. AT 11 A.M.
9-NOV-2016 1150 1290
10-NOV-2016 1700 1500
11-NOV-2016 2000 1800
12-NOV-2016 1600 1900
13-NOV-2016 2100 2000
14-NOV-2016 1900 1985
15-NOV-2016 2080 2050
Table-3: Available frequency
Chart-3 Available frequency for execution on specific day
Chart-3shows the frequency availability at the time of execution of application. Execution time depends on the frequency. Execution time is inversely proportional to frequency. If available frequency is high then we required minimum execution time and vice versa.
5. CONCLUSIONS
There are different ways to get Twitter data or any other online streaming data and also they want to perform the analysis on the stored data which will be helpful for the application user. After creating an account on twitter developer, authentication keys (API key, API Secret key, Access token and Access token secret) are generated by twitter server. These keys are useful for authentication. The keyword to be searched for tweets is passed from application by using twitter API towards twitter server which will intern returns a set of recent tweets. Whatever data fetched from twitter server is raw data. Raw data has to be converted to original tweets by using Java script object notation.
5. REFERENCES
[1]
Sentiment analysis: from opinion mining to human -agent interaction: 2444846, IEEE Transactions on Affective Computing, DOI 10.1109/TAFFC.2015. [2] Valentina Sintsova, Claudiu Musat, Pearl Pu“Semi-Supervised Method for Multi-Category Emotion Recognition in Tweets” IEEE International Conference on Data Mining Workshop 2014.
[3] Sentiment and Emotion Analysis for Context Sensitive Information Retrieval of Social Networking Sites: A Survey D.I. George Amalarethinam, V. Jude Nirmal International Journal of Computer Applications (0975 – 8887) Volume 100– No.10, August 2014.
[4] Eman M.G. Younis “Sentiment Analysis and Text Mining for Social Media Microblogs using Open Source Tools: An Empirical Study”.International Journal of Computer Applications (0975 – 8887) Volume 112 – No. 5, February 2015
[5] Nann, Stefan, Krauss,Jonas, Schoder, Detlef “ Predictive analytics on public data – the case of stock markets” Proceedings of the 21st European Conference on Information Systems.2013
[6] Chlo´e Clavel, Catherine Pelachaud, Magalie Ochs “User’s sentiment analysis in face-to-face human-agent interactions – prospects” 2013.
[7] Jiehan Zhou, Changrong Yu, Jukka Riekki, Elise Kärkkäinen.” AmE Framework: a Model for Emotionaware Ambient Intelligence” 2010.
[8] K. Scherer, “What are emotions? And how can they be measured?” Social scienc information, vol. 44, no. 4, pp. 695– 729, 2005.
[9] U. Krcadinac, P. Pasquier, J. Jovanovic, and V. Devedzic, “Synesketch: An open source library for sentence-based emotion recognition,” IEEE Transactions on Affective Computing, vol. 4, pp. 312–325, 2013.