http://dx.doi.org/10.4236/ajor.2015.52008
The Role of Technology in the Process of
Learning Mathematics
Costică
Lupu
Informatics and Education Sciences Department, Faculty of Sciences Mathematics, “Vasile Alecsandri” University of Bacău, Bacău, Romania
Email: [email protected]
Received 27 February 2015; accepted 15 March 2015; published 17 March 2015
Copyright © 2015 by author and Scientific Research Publishing Inc.
This work is licensed under the Creative Commons Attribution International License (CC BY). http://creativecommons.org/licenses/by/4.0/
Abstract
The research was achieved by applying several questionnaires and evaluation tests that have shown the efficacy of using the computer in building active thought and skills in the graphical representation of functions f :A⊆→, within a Cartesian reference system xOy. Our research was based on the following hypothesis: if we systematically use, in lessons of algebra and mathe-matical analysis, the GeoGebra software for drawing the graph of a function, then we shall con-tribute to building attitudes and competences in using the computer for the graphical representa-tion of funcrepresenta-tions f :A⊆→, within a Cartesian reference system xOy. The purpose of our study is to present a practical computer use model for the students from the Pre- and In-Service Teacher Training Department, “Vasile Alecsandri” University of Bacău, during their pedagogical practice stage of continuous training, aimed at building practical skills in supporting the teaching- learning process with computers. To deal with these issues, we are trying to find the best teaching- learning strategies by using the calculus technique. The research was conducted at the “Stefan cel Mare” National Pedagogical College from Bacău, by assisting 20 lessons of mathematics and 20 lessons of Information and Communication Technology, involving a group of 104 students in the 11th grade. In order to verify the hypothesis, we have established several objectives that orient and guide our activity: knowing the initial level of mathematical training in terms of graphical representation of functions; identifying the frame and reference objectives of the curriculum for mathematical education regarding the graphical representation of functions; designing and con-ducting a teaching process focused on the use of the computer and the GeoGebra software in learn- ing the graphical representation of functions; final evaluation of the students’ level of training re-garding the graphical representation of functions in a plane.
Keywords
1. Introduction
The mathematician Markus Hohenwarter, creator of the GeoGebra software, started the project in 2001 at the University of Salzburg. The software was designed and developed like a computerised teaching device to be used in the teaching-learning of geometry for the level of elementary school, independently or simultaneously with Algebra, for the level of high-school. In April 2002, the first version GeoGebra 1.0 was freely offered to pre-university educational institutions.
The worksheet of the latest versions of GeoGebra or the document with the extension GGB contains: the “al-gebra window” and the “geometry window”, where one may also insert the Excel calculus table for numerical values. A feature of the latest versions of the application is that it associates “mathematical objects” with three representations: 1) graphical (points, polygons, representative curves for functions); 2) algebraic (points, coor-dinates, equations of lines, conics; 3) value representation, in the Excel calculus sheet [1].
As shown in the examples above, the graphical representation of a function implies several stages of calculus that students may cover after having studied mathematical analysis in the 11th grade. Although these steps are performed well by students, they still display a certain amount of unskillfulness in achieving the drawings. That is why we believe that GeoGebra comes to support students in achieving a correct image of the graph of a func-tion [2].
2.
Methodology of Research
2.1. The
Research Hypothesis and Objectives
By exploiting work in class during pedagogical practice, we intend to illustrate the role of using GeoGebra for building attitudes and developing strategies for learning algebra and mathematical analysis with the help of the computer.
Hypothesis: if, in lessons of mathematics, we systematically use GeoGebra to learn mathematical analysis, we shall contribute to building attitudes and competences related to the teaching-learning of the graphical represen-tation of functions in a plane.
Researchobjectives: The objective of this study is to showcase a practical model for using the computer by the students from the Pre- and In-Service Teacher Training Department, from the Faculty of Mathematics, at-tending their continuous training, during their pedagogical practice, by teaching geometry in elementary school.
To verify the hypothesis, we have established several objectives that may orient and guide the activity: 1) Knowledge of the initial level of mathematical training regarding the collinearity of points in a plane; 2) Identification of the frame and reference objectives of the curriculum for mathematical education regarding the solving of problems of collinearity of points in a plane;
3) Designing and conducting a teaching process focused on using the computer and the GeoGebra software in learning geometry;
4) The final evaluation of the students’ level of training regarding the collinearity of points in a plane.
2.2.
Characterization of the Experimental Group
The research group comprised 4 (2 experimental and 2 control) classes of 11th graders, at which 20 students from the Pre- and In-Service Teacher Training Department, the Faculty of Mathematics, continuous training study programme, conducted, during their pedagogical practice hours, observation, probation and final lessons.
Each student has conducted probation lessons in the Computer science laboratory, initiating the high-school students in using the GeoGebra software for geometrical representations and calculus applied in solving prob-lems of plane collinearity.
This fact has determined us to conduct a process of individualizing the instructive-educational act, given the fact that true pedagogical art springs from the student’s ability to combine harmoniously the active-formative strategies, the children’s individual development with digital competences in using the computer [3].
2.3.
The Research Stages
The experimental research was conducted during the 1st semester of the 2014-2015 school year, in three stages:
there were applied tests aimed at identifying the initial development level of the ability to represent functions graphically.
Theameliorativestage was conducted between 1 November-20 December 2014. At this stage, there were or-ganized and conducted lessons of mathematics, with frontal activities as well as differentiated for small groups and individual work. The aim was to build cognitive, psychomotor, socio-emotional elements and the accent was put on developing skills in the graphical representation of functions and using the computer by using the GeoGebra software.
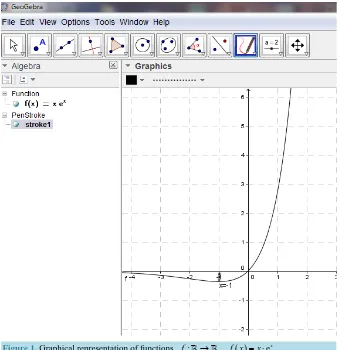
Thestageoffinalevaluation was conducted between 12-23 January 2015. At this stage, there were conceived, adapted and applied tests to establish the progress recorded by the high-school students in terms of building the ability to use the GeoGebra software in the graphical representation of functions (Figure 1).
2.4
. Research Methods and Techniques
To verify the hypothesis and achieve the research objectives, the students have applied the following research methods and techniques: the portfolio, the questionnaire, observation, psycho-pedagogical experiment, conver-sation, analysis of the activity products and research of documents, the method of the tests, as well as the tech-niques for the mathematical-statistic presentation and processing of the research data (Table 4andFigure 2).
3. Results of Research
3.1. Questionnaire Results
[image:3.595.145.484.365.715.2]The pre- and post-test questionnaires included a series of questions regarding the use of the GeoGebra software in teaching-learning geometry in elementary school.
To what extent do you believe that using the computer and the GeoGebra software is useful in learning ge-ometry in the present context? The answers will be provided on a scale from 1 to 5, where: 1 = to a very small extent/not at all and 5 = to a very large extent (Table 1).
In percentages, the students’ answers to the 6 questions from the pre- and post-test questionnaires were: computer confidence: 62% - 67%; confidence in mathematical training: 62% - 65%; attitude towards using the computer: 55% - 64%; relevance of the experience in using the GeoGebra software: 65% - 78%; engagement for exploration as a learning strategy: 61% - 65%.
Relevance of graphical representation as support in solving problems: 64% - 70%.
In fact, we may notice a slight percentage increase regarding computer confidence, confidence in mathematics and the attitude towards the computer over the semester. Also, there is a slight percentage increase regarding the two strategy scales.
When answering question 7 regarding what they liked in relation to using the computer, the students made frequent references to the following aspects: 1) graphics and visualization also support understanding; 2) the speed and ease of building geometrical forms and calculating quickly; 3) clarity in understanding problems fol-lowing graphical and calculus exploration; 4) The ability to verify written calculi and confirm answers [4].
Many students responded to using the computer in solving equations as if it were a game. Approximately half of the questioned students said they would keep on using the GeoGebra software. The mentors have also re-ported certain difficulties related to the use of computer science laboratories and the specific software. There were no relevant differences according to gender, but there was acknowledged the importance of knowing the English language.
3.2. The Final Evaluation Test Re
sults
[image:4.595.130.516.377.513.2]We shall further present only the final evaluation test (Table 2).
Figure 2. The results of the experimental group to the final test.
Table 1. Questionnaire on the use of the computer and the GeoGebra software in learning mathematical analysis.
1 2 3 4 5
1) To what extent does the computer, by means of the GeoGebra software, support you in learning mathematical analysis?
2) To what extent does your level of mathematical training support you in learning mathematical analysis?
3) What role does your attitude towards using the computer in learning mathematical analysis play?
4) What role does your experience of using the GeoGebra software play in learning mathematical analysis?
5) What is the degree of engagement for exploration as a learning strategy?
6) How important is graphical representation (visual strategies) in solving equations?
7) Mention what you liked about using the GeoGebra software in learning mathematical analysis?
8) Will you keep on using the GeoGebra software in learning?
0 5 10 15 20 25 30 35 40
insufficient sufficient well very well
1) Let there be f :→,
( )
exf x = ⋅x . Determine: the definition domain, the intersection with the axes, the limits to
±∞
.2) Let there be f :→,
( )
exf x = ⋅x . Calculate: the first derivative, the second derivative. 3) Let there be f :→,
( )
exf x = ⋅x . Determine the asymptotes and the variation table (Table 3). 4) Let there be f :→,
( )
exf x = ⋅x . Discuss the equation f x
( )
=m, according to the values of the real parameter m[1].Following the analysis and the interpretation of the data collected in the initial evaluation, there was con-ducted differentiated work, providing support particularly to children with knowledge gaps, no mathematical skills, looking for methods and procedures to remove such issues (exercises of drawing accurately the graphs in a plane and solving equations with a parameter) (Table 4).
[image:5.595.87.544.280.722.2]These elements have changed the children’s attitude towards mathematics. The students organized their ac-tivities better, becoming more critical towards them, as well as towards the actions of others. Concerned with ensuring the children’s active participation in the activities they conducted, the students tried to give tasks a clear motivation, catch and maintain interest by means of emotionally engaging procedures, make them use the computer and other attractive teaching materials at the most appropriate moments of the lesson [5].
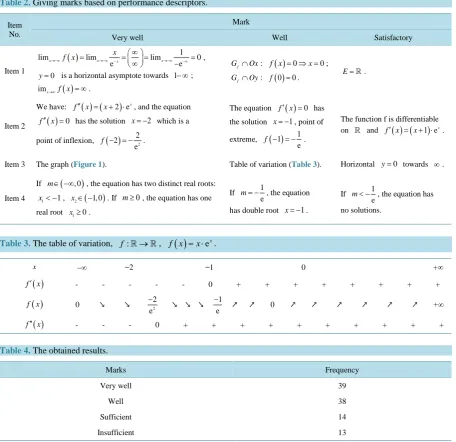
Table 2. Giving marks based on performance descriptors.
Item No.
Mark
Very well Well Satisfactory
Item 1
( ) 1
lim lim lim 0
e e
x x x x
x f x →−∞ →−∞ − →−∞ −∞ ∞ = = = = ∞ − , 0
y= is a horizontal asymptote towards l− ∞;
( )
imx→∞f x = ∞.
f
G ∩Ox: f x
( )
= ⇒ =0 x 0;f
G ∩Oy: f( )0 =0. E=.
Item 2
We have: ( ) ( 2 e) x
f′′ x = x+ ⋅ , and the equation
( )
0f′′ x = has the solution x= −2 which is a
point of inflexion,
( )
2 22 e f − = − .The equation f′( )x =0 has the solution x= −1, point of
extreme,
( )
1 1 e f − = − .The function f is differentiable on and ( ) ( 1 e) x
f′ x = x+ ⋅ .
Item 3 The graph (Figure 1). Table of variation (Table 3). Horizontal y=0 towards ∞.
Item 4
If m∈ −∞( , 0), the equation has two distinct real roots:
1 1
x < − , x2∈ −
(
1, 0)
. If m≥0, the equation has one real root x1≥0.If 1 e
m= − , the equation
has double root x= −1.
If 1 e
m< − , the equation has
no solutions.
Table 3. The table of variation, f:→,
( )
ex f x = ⋅x .x −∞ −2 −1 0 +∞
( )
f′ x - - - 0 + + + + + + + +
( )
f x 0 ↘ ↘ 2 2 e
−
↘ ↘ ↘ 1 e
−
↗ ↗ 0 ↗ ↗ ↗ ↗ ↗ ↗ +∞
( )
f′′ x - - - 0 + + + + + + + + + +
Table 4. The obtained results.
Marks Frequency
Very well 39
Well 38
Sufficient 14
Figure 3. The comparative analysis of the results to the evaluation tests.
4.
Conclusions
Their attitudes towards mathematics by using the computer and the role of technology in the process of learning mathematics are also analysed in connection to the paradigm of scientific, pedagogical, psychological and tech-nological training for the teaching-learning-evaluation of mathematical knowledge, conducted in faculties by means of lectures, pedagogical and technological training but, particularly, through pedagogical practice. The questionnaire confirms the formative and emotional potential of using the technology (Figure 3).
All the mentors and students appreciate the relevance of efficiently using the computer to raise motivational potential and learn mathematics, and the graduates of the Faculty of Mathematics should build the necessary competences to exploit the available technological resources. The students from the pedagogical practice and the pupils are encouraged to use, during their lessons of mathematics, the AEL lesson packages that are widely available, as well as special software [6].
References
[1] Lupu, C. and Săvulescu, D. (2000) Methods of Teaching Mathematics: Textbook for Class XI, Pedagogical Schools, Publisher Paralela 45, Pitesti.
[2] Lupu, C. (2014) The Contribution of the New Technologies to Learning Mathematics. Procedia-Social and Behavioral Sciences, 128, 240-245. http://dx.doi.org/10.1016/j.sbspro.2014.03.150
[3] Lupu, C. (2013) Epistemological and Psychological Fundamentals of the Didactics of Science. Procedia-Social and Behavioral Sciences, 92, 490-494. http://dx.doi.org/10.1016/j.sbspro.2013.08.706
[4] Lupu, C. and Săvulescu, D. (2003) Methods of Teaching Geometry. Publisher Paralela 45, Pitesti.
[5] Nechita, E., Cojocariu, V.M. and Păcurari, D. (2014) Internationalization of Higher Education at Home. An Initiative for Teaching Informatics. Procedia-Social and Behavioral Sciences, 149, 624-628.
http://dx.doi.org/10.1016/j.sbspro.2014.08.238
[6] Postolică, V., Nechita, E. and Lupu, C. (2014) The Romanian Mathematics and Informatics Education. British Journal of Education, Society & Behavioural Science, 4, 226-240. http://dx.doi.org/10.9734/BJESBS/2014/5940
0 5 10 15 20 25 30 35 40
Insufficient Sufficient Well Very well