Juan Pablo Rud
Thesis submitted in the fulfilment of the requirements for the degree of
DOCTOR OF PHILOSOPHY
in Economics
London School o f Economics and Political Science
All rights reserved
INFORMATION TO ALL USERS
The quality of this reproduction is dependent upon the quality of the copy submitted.
In the unlikely event that the author did not send a complete manuscript and there are missing pages, these will be noted. Also, if material had to be removed,
a note will indicate the deletion.
Dissertation Publishing
UMI U613416
Published by ProQuest LLC 2014. Copyright in the Dissertation held by the Author. Microform Edition © ProQuest LLC.
All rights reserved. This work is protected against unauthorized copying under Title 17, United States Code.
ProQuest LLC
789 East Eisenhower Parkway P.O. Box 1346
SOI?
ussac?
Library
SdttMtxatv .r .
I, Juan Pablo Rud, declare that the work presented in this thesis is my own. No
part of this dissertation contains material previously submitted to examiners of any
other university. Where information has been derived from other sources, I confirm
This thesis presents three papers that contribute to the measurement and under
standing of the process of economic development. In particular, I deal with issues of
significant importance in the current literature in development economics: the provi
sion and regulatory institutions of infrastructure, firms and industries’ behaviour and
performance, and the process of human capital accumulation and its link to gender
issues.
In Chapter 2 I investigate the effect of electricity provision on industrialization
using a panel of Indian states from 1965-1984. To address the endogeneity o f invest ment in electrification, I use the introduction of a new agricultural technology intensive
in irrigation (the Green Revolution) as a natural experiment. As electric pumpsets are
used to provide formers with cheap irrigation water, I use the uneven availability of
groundwater to predict divergence in the expansion of the electricity network and, ul
timately, to quantify the effect of electrification on industrial outcomes. I present a se
ries of tests to rule out alternative explanations that could link groundwater availability
to industrialization directly or through other means than electrification. Overall, the
uneven expansion of the electricity network explains between 10 and 15 percentage
vision of electricity. In a model that combines upstream regulation with downstream
heterogeneous firms in a monopolistic competition framework, I investigate the role of
the electricity regulator’s preferences and the economic environment (i.e. regulation
and openness) in determining the decision to adopt a captive generator of electricity
and industries’ aggregate productivity. I show that a firm’s productivity, the electricity
regulator’s disregard for the well-being of industrial producers consuming electricity
and greater industry protection from competition are associated with greater adoption
of captive power. The mechanisms I propose are present for a representative repeated
cross-section sample of Indian firms in the 1990s, with heterogeneous effects along
dimensions such as location.
In Chapter 4 I investigate the effect of the Green Revolution on rural literacy
and rural women’s employment and literacy levels, using a panel of 254 districts for
census years, before and after the introduction of the high yield variety (HYV) seeds.
Even though the new technology has been shown to increase returns to education, ag
gregate effects on literacy are ambiguous a priori, if claims are correct that the process
excluded most poor formers and that mechanization replaced women labour and their
effects are strong. I find robust evidence that the increase in adoption of the new seeds
is associated with increases of around 2 percentage points in literacy levels. The ef
fects are only present for treated cohorts. Additionally, I find no evidence of a Green-
I am grateful to my supervisors Robin Burgess and Guy Michaels for their con
tinuous support and guidance. I am also indebted to faculty and fellow PhD students
at the Economic Organisation and Public Policy Programme (EOPP), STICERD and
the Department o f Economics at the London School o f Economics for fruitful conver
sations, suggestions and ideas. In particular, Steve Redding, Oriana Bandiera, Andrea
Prat, Fernando Aragon, Paolo Masella, Irma Clots-Figueres and Raja Kali have been
extremely helpful at different stages of this project. Participants and discussants in the
conferences and seminars where I presented have also contributed to this research. I am also thankful for the financial support provided by the Department of Eco
nomics at LSE, the Anglo-Jewish Association and the Overseas Research Students
Awards Scheme at different stages of my Doctoral degree and to support staff at the
Department of Economics and STICERD.
My parents, Silvia and Eugenio, and my sister Flavia played an important part in
this process and I am forever grateful to them for their unconditional support, as I am
to my friends from Buenos Aires and to those I made in London. And to Emma, for
getting my energies flowing in the late stages. Last, but not least, the development and
completion of this project would not have been possible without the indefatigable love,
companionship, patience and encouragement offered by Laura, to whom I dedicate this
1 Introduction ... 1
2 Electricity Provision and Industrial Development: Evidence
from In dia... 9
2.1 Introduction...9
2.2 Electrification in India and the Green Revolution... 14
2.3 Identification Strategy... 20
2.3.1 Instruments ... 24
2.3.2 OLS and Two-Stage Least Squares Results... 35
2.4 Alternative Explanations and Other Robustness Checks ... 39
2.5 Conclusion... 51
2.A Appendix A: Variables and Sources... 53
2.B Appendix B: Figures and Tables... 55
3 Coping with Bad Infrastructure: Adoption o f Captive
Power Generators Among Indian F ir m s... 68
3.1 Introduction... 68
3.2 The M odel...■... 74
3.2.3 Changes in the environment... 84
3.2.4 Upstream ... 88
3.2.5 Predictions in the Indian context... 93
3.3 Data and Descriptive Statistics... 100
3.4 Results ... 102
3.5 Conclusion... 113
3.A Appendix A Tables... 115
4 Literacy and Female Status in Green Revolution In d ia ...125
4.1 Introduction... 125
4.2 Literacy and the Green Revolution... 130
4.2.1 Difference in differences analysis by cohort... 131
4.2.2 Effect of HYV adoption by cohort... 135
4.3 Gender, literacy and the Green Revolution... 145
4.3.1 Labour market and gen d er... 146
4.3.2 Literacy... 149
4.4 Conclusions... 155
4.A Appendix A: D ata... 157
4.B Appendix B: Tables ... 160
Chapter 1
Introduction
The accumulation of physical and human capital remains a fundamental yet
difficult task in the objective of reducing poverty and increasing standards of liv
ing in most of the developing world. Individuals in developing countries do face
an economic environment full of constraints, such as the absence or imperfection of
credit markets. However, in many cases, the decision not to invest in physical and
human capital can be explained by low private returns. In particular, in this thesis
I investigate two sources: the lack of adequate infrastructure, that hinders the birth
and growth of firms, and the prevalence of traditional farming technologies with low
returns to education. The economic structure of a large number of underdeveloped
countries suggests the relevance of these sources of low private returns. For exam
ple, the regions of Sub-Saharan African and South Asia where-out of the combined
population of 2 billion people-more than 30% live with less than a dollar a day, 70%
live in rural areas and around 30% of GDP comes from the agricultural sector (World
Bank (2005; 2007)). Both infrastructure and human capital indicators depict a bleak
outlook even when compared to other developing regions, such as Latin America:
only 24% of people in Africa and 43% in South Asia have access to electricity (vs.
89% in Latin America), around 35% in both areas have access to sanitation (vs. 74%
in Latin America), 34% and 65% of the rural population in Africa and South Asia,
fixed lines and mobile connections reach around 6
%
of the population on average (vs. 42% in Latin America). The picture looks very similar for human capital indicators: according to the Millennium Development Goals, in 2003 only 61% of children
in the relevant age group in Sub-Saharan Africa and 87% in South Asia had com
pleted primary school (vs. 96% in Latin America). Similarly, illiteracy among youth
aged 15 to 24 in 2003 was above 30% in both regions, while in Latin America, it was
below 10%.
Even though these indicators are conclusive indicators of underdevelopment,
the understanding of the underlying drivers of economic failure and the prescription
for successful policies are still a work in progress. This is due to the feet that the si
multaneity of phenomena makes it very hard to disentangle causal mechanisms and
the identification of causal effects. The objective of this thesis is to address some
of these analytic challenges. In doing so, we can learn about issues of significant
importance in the current literature in development economics, including the provi
sion and regulatory institutions of infrastructure, firms and industries’ behaviour and
performance, and the process of human capital accumulation and its link to gender
issues.
More specifically, the main issues I discuss in the following three chapters
revolve around two main features that have characterised the economy of India in the
last fifty years but could be used to understand the process of economic development
and agricultural production that has been underperforming for a long time in India, as
highlighted by the World Bank (2000) and by the US Department of Energy (2003)
(among others) as one of the main constraints to development in India. For example,
the Investment Climate Survey done by the Asian Development Bank and the World
Bank in 2002 reports information for around 1800 firms and shows that, on average,
firms face a power outage or a power surge every other day and that more than 60% of
firms have turned to captive power generators. This phenomenon of self-generation
o f electricity is recurrent in other developing countries in South Asia and Africa. For
example, similar surveys in Bangladesh, Sri Lanka and Kenya show that more than
70% of surveyed firms use a captive generator. In Pakistan, the rate is around 40%;
in Tanzania, 55%; and in Uganda, 36%. In all of these countries, including India,
the inadequacy of electricity is considered an important constraint for firms (Asian
Development Bank (2002)).
The second recurrent phenomenon highlighted in this thesis is the Green Revo
lution, i.e. the introduction of a new agricultural technology in India in the mid 1960s
consisting of seeds intensive in the use of irrigation and fertilizers. In the following
chapters, I make use of two features o f this technological change: the increase of
electricity provision in rural areas to provide the required timely irrigation (chapters
2 and 3) and the technology’s complementarity with human capital (chapter 4). The
lessons learned from the transformations associated with the Green Revolution in In
in the many developing countries where the agricultural sector employs more than
60% of the work force, its share of GDP is around 30% on average, and where il
literacy rates are in most cases above 30% (for the “agricultural-based countries” as
defined by the World Development Report (2007)).
In Chapter 2 ,1 investigate the effect of electricity provision on industrial devel
opment by looking at a panel of Indian states between 1965 and 1984. An interesting
feature in that period is that each state in India has its own State Electricity Board
(SEB)-politically dependent on the state government and independent o f the cen
tral govemmerit-that is in charge of expanding the electricity network. This allows
me to compare the industrial performance o f different states and link it to their elec
trification efforts. But the econometric identification of this effect is subject to the endogeneity concerns of reverse causality and unobserved time varying effects that
might produce spurious results. To deal with these issues I make use of the start of
the Green Revolution in the mid 1960s, where the successful introduction of High
Yield Variety (HYV) seeds was determined by geographical characteristics such as
groundwater availability, allowing farmers to pump water so as to provide timely
irrigation to the new seeds (see Foster and Rosenzweig (2008), for example). As
electric pumpsets were employed to provide farmers with cheap irrigation water, I
use the uneven availability of groundwater to predict diveigence in the expansion
of the electricity network and, ultimately, to quantify the effect of electrification on
invariant characteristic (groundwater availability) to the expansion of the electricity
network to address the endogeneity concerns that would bias least squares estimates.
Additionally, I present a series of tests to mitigate concerns about alternative explana
tions that could link groundwater availability to industrialization directly or through
other means than electrification, such as an increase in urbanization, expenditure in
manufacturing goods and credit availability. This chapter contributes to the growing
literature on infrastructure, reinforcing the idea that geographic characteristics can
be used to instrument for investment in infrastructure projects, as in Duflo and Pande
(2007).
Chapter 3 explores how firms in India cope with the erratic and expensive pro
vision of electricity. I develop a model that combines monopoly regulation of the
provider of a public utility, as in Laffont and Tirole (1993), with downstream hetero
geneous firms that use the infrastructure good as an input in a monopolistic competi
tion framework. As in Melitz (2003) and Bernard et al. (2006), I assume firms differ
exogenously in their productivity. In particular, I investigate the role of the electric
ity regulator’s preferences (i.e. the importance attributed to industrial consumers in
the objective function) in determining the quality adjusted price charged to indus
trial consumers and its effect on firms’ decisions to adopt a captive power generator
(presented as a cost reducing device). The existence of this technology changes the
configuration of the industry, since the exposure to high price or low quality is differ
tariffs increase the rate of adoption by two means: the productivity level of the mar
ginal adopting firm is lower and the productivity level of the marginal surviving firm
is greater. I subsequently show that the economic environment (i.e. openness and
regulation) also plays a part in determining the decision to adopt a captive generator.
A more protected environment translates into higher final good prices, allowing less
productive firms to recoup the fixed cost of the electricity generator. I test the mech
anisms I propose in the model using a repeated cross-section representative sample
of Indian firms for the years 1990, 1994 and 1997, combined with data at the state
and industry level. I first analyse the role of a regulator’s preferences in pricing de cisions and check whether industries face higher electricity tariffs in states where the
agricultural sector’s need for electricity is greater (i.e. where the Green Revolution
is more prevalent). The evidence suggests that states with greater intensity in HYV
are associated with industries paying significantly more for their network electric
ity. I subsequently show that the probability o f adopting a captive power generator is
greater in states that charge industries more for their electricity and provide a more
unreliable service (as measured by outages and network energy losses). In line with
the model, I find evidence that the more protected the industry, the more likely the
adoption of captive power is. Adopting firms are also on average bigger and more
productive.
In Chapter 4 ,1 investigate the relationship between the Green Revolution, rural
of 1961 (before the introduction of the new technology), 1971 and 1981. There is a
general consensus that the benefits of the Green Revolution were more likely to be
reaped by more prosperous and more educated households, and that returns to educa
tion increased with the adoption of the new high yield varieties (HYV), as shown by
Foster and Rosenzweig (1996). However, many authors (see Dhanagare (1989), for
example) argue that only relatively well-off farmers and large landowners benefited
from this new technology while the many poor and small farmers, tenants or agricul
tural labourers might have not experienced any benefits. The inequality associated
with the technical change raises the concern as to whether the increased returns to
education generated effects of any significance at the aggregate level. I am also in
terested in the concern expressed by many authors (see Sridhar (2004) for a review)
that the Green Revolution has worsened the status of women, because mechaniza
tion has reduced the demand for women labour and their returns to education. To
test the whether HYV adoption is associated with more rural literacy, I use a sim
ilar identification strategy to Duflo (2001) and compare the change in literacy for
rural cohorts that were in primary schooling age during the Green Revolution (ac
cording to districts’ HYV intensity) with respect to the same cohort in 1961. I find
that literacy has increased in all districts on average, but a district at the mean of the
HYV adoption distribution would have produced an extra increase in rural literacy of
around 2 percentage points per cohort. The identifying assumption is that there are
rural literacy that would generate spurious results. To deal with this concern in the
identification strategy I use two control groups, for which I find no effects: older rural
cohorts to capture pre-Green Revolution trends in literacy and same cohorts in urban
areas, to capture contemporaneous district-wide trends in literacy. Results are ro
bust to the inclusion of channels other than HYV that could explain the divergence in
literacy rates, such as migration, strong presence of population belonging to Sched
uled Castes or Scheduled Tribes (groups recognized by the Constitution of India as
previously disadvantaged), and state trends and state-wide investments in primary
schools. Additionally, I show that there is an average increase in the literacy gender gap and a decrease in female labour participation in all of India. HYV intensity mit
igates these effects, but it does not reverse them: female participation in the labour
force, employment in the agricultural sector and literacy gap for treated cohorts fare
better in districts with greater adoption of HYV seeds. These findings reconcile con
flicting evidence in the literature regarding gender issues and the Green Revolution.
I suggest that not taking into account the negative trend for all of rural India in fe
male labour and educational outcomes might lead to misleading conclusions when
Chapter 2
Electricity Provision and Industrial
Development: Evidence from India
2.1 Introduction
The adequate supply of infrastructure goods is increasingly acknowledged as one key
factor in generating a conducive environment for industrial and economic develop
ment. The World Bank currently directs 35% of their lending portfolio to infrastruc
ture projects with the idea that "infrastructure has a central role in the development
agenda and is a major contributor to growth, poverty reduction and achievement
of the Millennium Development Goals" (World Bank (2005)). However, average
expenditure on infrastructure for developing countries is only around 3% of GDP.
Among developing countries, South Asia and Sub-Saharan Africa perform particu
larly poorly in a range of infrastructure goods, such as water and sanitation, telecoms
and electricity access. The latter, according to investment climate surveys, is one of
the greatest obstacles to industrial development in India and the rest of southern Asia:
around 43% of the population have access to the electricity network, compared to at
least a 90% access in Latin America, Eastern Europe and East Asia.
India’s poor infrastructure in general, and the power sector in particular, is seen
their comparative advantage in labour intensive products (World Bank (2000)). Pub
lic agencies, economic journalists and sector analysts1 are among those who point to
the electricity sector’s poor performance as heavily affecting the growth and devel
opment possibilities of the Indian economy since independence, to the point that "the
poor quality of electricity has been the single greatest deterrent to India’s economic
growth and development" (US DoE (2003)). Yet the history o f Indian electrification
is not one of uniform failure. For example, around 10% of villages on average were
electrified by 1965, with some states like Tamil Nadu close to 50% and others such
as Assam or West Bengal less than 3%. In 1984, the average increased to over 75% and some states like Punjab achieved full village electrification.
I use this variation across regions and over time within India to investigate the
effect of electricity provision on industrial development, by examining a panel of In
dian states between 1965 and 1984. India’s federal political organization gives each
state full responsibility for creating, expanding and administrating the electricity net
work, from electricity generation to retail. This provides significant variation in the
extent of the physical network and industrial outcomes, allowing me to test whether
the gap in infrastructure provision is associated with unequal industrialization levels.
Assessing and quantifying the impact of investment in electrification on eco
nomic outcomes in the long run is a difficult task, since it is hard to determine the
underlying driving force. The resulting endogeneity concerns arise because of re
verse causality and unobserved state characteristics-such as the business or political
climate-that might explain why some states are better prepared to provide a better
electricity network than others. In such cases, OLS estimates would be biased. To
overcome this problem, my empirical strategy aims to find and use appropriate instru
ments for the expansion of the electricity network in order to consistently estimate
its impact on industrial development in a two-stage least squares (2SLS) strategy.
For this purpose, I use the start of the Green Revolution-an agricultural technology intensive in irrigation introduced in India in the mid 60s-as a natural experiment.
The successful introduction of High Yield Variety (HYV) seeds was determined by geographical characteristics such as soil characteristics and groundwater availability,
that allowed farmers to pump water so as to provide timely irrigation to the new seeds
(see Foster and Rosenzweig (2008), for example). As electric pumpsets were used to
provide cheap irrigation water, the uneven availability of groundwater across states was subsequently followed by an expansion of the electricity network. That means
that I can link the time-varying effects of a time invariant characteristic (groundwater
availability) to the expansion of the electricity network to address the endogeneity
concerns that would bias OLS estimates. After testing for the power and validity
of the instruments, I find that 2SLS estimates provide a more credible estimate than
least squares for this empirical question. This paper contributes to the growing litera
ture on infrastructure, reinforcing the idea that geographic characteristics can be used
Duflo and Pande (2007) instrument dams placement in India using information on
rivers’ gradients and Dinkelman (2008) instruments electrification in South Africa
with land gradients. My strategy exploits the complementarity between groundwa
ter and electrified pumpsets after the start of the Green Revolution to address the
endogenous placement of rural electricity.
The main concern regarding my empirical strategy is that groundwater or HYV
adoption could affect industrial outcomes through channels other than electrifica
tion. For example, greater rural incomes can increase the demand for manufacturing
goods2 or savings that translate into credit availability. An alternative story is that
positive shocks to agricultural productivity release cheap labour to be employed in the manufacturing sector (see Matsuyama (1992)) where an urbanization process fol
lows. Foster and Rosenzweig (1996) show that returns to education increased with
the Green Revolution and it could be the case that an increase in overall levels of hu
man capital or state expenditure in development projects (such as health and educa
tion) might be driving the uneven industrialization process rather than electrification.
To see whether the time varying effect o f groundwater availability could be linked to
these alternative mechanisms, I reproduce the 2SLS specification, instrumenting for
variables such as credit, expenditure, urbanization rates, literacy and development
expenditure. For a series o f different specifications, none of these channels shows
robust results, reducing the concerns that my strategy captures confounding effects.
The electrification link remains the most powerful of all.
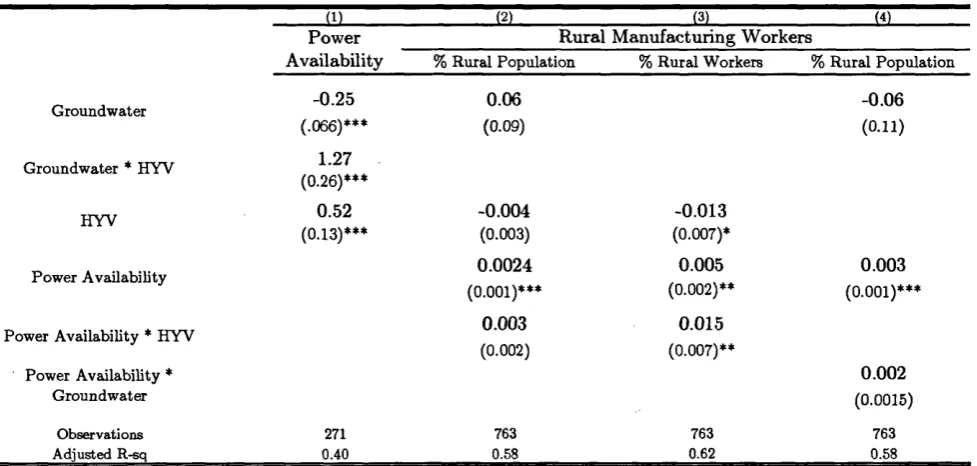
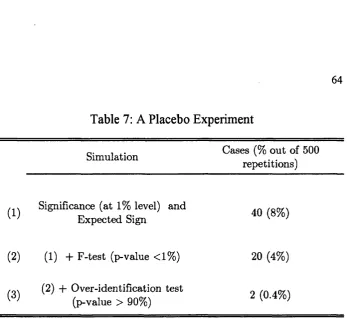
Another concern is that abundant groundwater can have a direct effect on in
dustrialization, if firms require water for production. Using district level data within
states, I show that there is no link between employment in the manufacturing sector
and groundwater availability once power availability has been controlled for. I also
deal with the concern that groundwater availability is spuriously correlated with elec
trification and that a "lucky draw" in the groundwater measure is driving the results.
I carry out a placebo experiment where I randomly assign values to my measure of
groundwater availability and show that the probability that my results are driven by
a lucky draw is very low (i.e. 0.4%). Results are robust to these alternative explana
tions and suggest that a standard deviation difference in the reach of the grid explains
between 10 and 15 percentage points difference in industrial output, in addition to
more factories and greater output among smaller firms. Magnitudes are substantial
and underline the potential economic benefits of investing in the expansion of the
electricity network.
The rest of the chapter is organised as follows. Section 2.2 provides some
background of the electricity sector in India and its relation to the Green Revolution.
Section 2.3 develops the empirical strategy where I identify the set of instruments and
indicators on manufacturing outcomes. Section 2.4 deals with alternative explana
tions and Section 2.5 presents additional robustness checks. Section 2.6 concludes.
2.2 Electrification in India and the Green Revolution
The empirical contribution of this paper, i.e. to quantify the effect of electrification in
industrial development, draws both from the organisation of the electricity sector in
India and from the uneven introduction of an agricultural technology that increased
the demand for powered irrigation. From a theoretical perspective, Murphy et al.
(1989b) show that infrastructure can be an important component of a "big push" in
dustrialization process. By overcoming coordination problems that arise because in
frastructure goods are used by many sectors at the same time, the public provision of
infrastructure contributes to the development of other markets, since it has the effect
of reducing the total production costs of the other sectors. In particular, infrastruc
ture can reduce costs in producing and marketing (i.e. transporting) goods. In this
paper, by focusing on the provision of electricity, the reduction in production costs
becomes the underlying mechanism that links infrastructure to industrialization. In
general, electrification could lower prices and induce more consumption of manu
facturing goods3. In a setting with heterogeneous firms, a selection effect might be
present, wherein smaller and less productive firms can break even only when elec
tricity is available.
With these mechanisms in mind, I investigate the effect o f electricity infrastruc
ture on industrial development, by looking at a panel of Indian states between 1965
and 1984. The cross-state variation in electricity provision in India has been used to
explain differences in productivity, return and investment rates (Dollar et al. (2002),
(2003)), and divergence in growth rates and income levels (Bandyopadhyay (2003);
Sachs et al. (2002)). To the best of my knowledge, mine is the first attempt to quantify
the long run effects of electrification on industrialization by addressing the endogene
ity of network expansion. The provision o f electricity is analysed at the state level,
since there is a constitutional arrangement in India that ensures state independence
from the central government in designing electricity policies. The Indian Constitu
tion establishes in a handful of articles the distribution of legislative powers between
the Central Government and the States, specifying a concurrent list of activities where
both levels of government have the power to intervene. These shared competencies
include non-economic legislation (e.g., criminal law) and economic regulation (e.g.,
labour markets or price controls). The electricity sector falls in this last category.
The Electricity Supply Act created in 1948 fully vertically integrated State Electric
ity Boards (SEB), in charge of coordinating electricity generation, transmission and
distribution and commercialization at the state level, whose Board members are ap
Figure 1 shows a correlation between changes in agricultural electrification
and manufacturing output in the analysed period for 15 Indian states. Note that states
where HYV seeds overtook traditional seeds (Punjab, Haryana and Tamil Nadu) are
amongst the faster growing states and have experienced a larger expansion of their
electricity network.
This correlation between Green Revolution and electrification is at the heart of
the identification strategy. The Green Revolution followed persistent food shortages
in newly independent India, where farming activity was mainly for subsistence, char
acterized by the use of primitive techniques and was rainfed (Chakravarti (1972)).
The Third Five Year Plan laid out by the Planning Commission, covering the years
from 1961-2 to 1965-6, set ambitious taigets in terms of agricultural production: e.g.
foodgrains should grow by 30%, other products like jute, by 55%, all in the belief
that "with the achievement of these taigets, the economy will become self-sufficient
in the supply of foodgrains". After the failure of some programmes such as the In
tensive Agricultural District Programme (LADP) and the Intensive Agricultural Ar
eas Programme (IAAP) in 1966-7 the introduction of the High Yielding Variety Seed
Programme provided the expected breakthrough, by providing fanners with hybrid
seeds scientifically adapted to India’s domestic conditions. The Green Revolution-in
order to become a "revolution'-depended on a series o f factors, especially the ad
equate and timely supply of water. In 1961, only around 20% of the total cropped
in irrigated areas was more than 50%, with very uneven distribution across regions.
In the period under consideration, Haryana and Punjab-states at the forefront of the
Green Revolution-achieved a share of irrigated area around 60% and 90% respec
tively, while other relatively rich states like Gujarat and West Bengal were around
the 25% mark.
The nature and the depth of irrigation development constitutes the fundamen
tal argument in my empirical strategy. Its expansion goes hand in hand with HYV
seeds adoption, meaning that states that were trying harder to introduce the new tech
nology were creating a demand for irrigation. Irrigation could be provided by using canals supplying water from a dam or reservoir or the installation of deep or shallow
powered tubewells. Bharadway (1990) notes that "the rate o f increase of irrigation
by wells/tubewells was higher than that by canals, and accelerated remarkably during
the period 1969-1980 when there was a spurt in private tubewells, especially in the
late sixties". McGuirk and Mundlak (1991) emphasize this point further by show
ing that in Punjab government-provided canal irrigation dominated only until 1968;
afterwards, private wells and tanks became more important in terms of land cover
age. As a matter of fact, this acceleration in the usage of tubewells is closely related
to the availability of electricity in rural areas. As Bharadway explains, "a tubewell
uses diesel or electricity operated pumps to lift the water (from the water table) and
can manage greater depths and irrigate bigger commands (than dug wells.)" It has to
sion on Agriculture, Ministry of Agriculture and Irrigation of India (1976) estimated
that operating diesel pumpsets was two times more expensive. As the efficient uti
lization of the tubewells was conditional on electricity availability, states that were
to deepen the Green Revolution had an incentive to expand their electricity network
simultaneously. McGuirk and Mundlak show an example by mentioning that "from
1965/6 to 1979/80, power generation in Punjab increased by over 240% and by 1976
all villages had access to electricity. (...) The fastest-growing source of demand for
electricity during this period was agriculture. A large part of this increase (from
14.5% in 1960/1 to 47% in 1979/80 o f the total available electricity) was as a source
of power for the growing numbers of tubewells."
A natural question to ask is why farmers’ demand for electricity was satisfied in HYV intensive states. Two mechanisms could explain why farmers’ need of electric
ity was satisfied by their state governments. The first one is linked to the preferences
of the median voter. In the period analysed, rural population in any given state is
at least 65% of total population, and almost 80% on average (topping 90% in three
states), in a country that has been democratic and federal since its independence in
1947. There is some evidence that voters in states intensive in HYV like Punjab,
Haryana and Tamil Nadu moved away from the Congress Party and voted for re
gional parties. However, the salience of other issues (e.g., religion) and the fact that
incumbent parties could adapt their policies to the new needs o f the rural population
evidence: the endogenous formation of lobbies. The first circumstance that seems
important to note is that "increasing food shortages and mounting concern for im
mediate gain in production led to the shift in developmental priorities" (Sharma and
Dak, (1989)), such that expanding the production possibilities in the agricultural sec
tor was deemed fundamental. That circumstance gave formers, in particular big ones,
an unprecedented political clout over state governments. Dhanagare (1989) estimates
that "the prosperity unleashed by the Green Revolution was distributed differentially,
putting the small and marginal fanners at a relative disadvantage. The high cost/high
yield technology called for capital investments beyond the means of a majority of small and marginal farmers." It might be the case that a stronger economic position
translated into political leverage. Tongia (2003), for example, stresses that rural elec
trification "has swayed in strong political winds." Gulati and Narayanan (2003) also
show that what they call "the subsidy syndrome in Indian agriculture" after the in
troduction of the new seeds in the late 1960s became a fundamental instrument of
economic policy where available electricity was one of its main channels. In the
case o f Punjab, Simms (1988) describes a situation in which "farmers are aware of
the power they hold due to their strategic importance in the national economy (...)
Political action has led to extensive changes in rural Indian Punjab".
Even though the importance of the political economy of infrastructure provi
sion cannot be understated, this chapter does not enquire into its details. Rather, it
avail-ability, that facilitated the expansion of the electricity network with the start of the
Green Revolution. I turn to this analysis in the next section.
2.3 Identification Strategy
The main objective of this paper is to quantify the effect of electricity provision on
industrial outcomes using a panel of fifteen Indian states4 where consistent informa
tion on the electricity network is available over the period 1965-1984. That is, by
obtaining a consistent estimate of A in equation (2.1), where an indicator of indus
trial performance (yst) is expressed as a function of an indicator of electricity supply
(&
st)-V a t — OiQs + O iu + Aest + o t ^ X - s t + fiat (2.1)
The regression includes time varying state controls ( X st), state fixed effects
included to control for persistent and constant features within states, and year fixed
effects to control for shocks common to all states. To control for serial correlation,
standard errors are clustered at the state level5. The explained variable, yst, captures
industrial development or performance per state and year. If infrastructure reduces
4 Andhra Pradesh, Assam, Bihar, Gujarat, Haryana, Karnataka, Kerala, Madhya Pradesh, Maha rashtra, Orissa, Punjab, Rajasthan, Tamil Nadu, Uttar Pradesh and West Bengal.
costs or improves productivity, an increase in electricity availability should have a
positive impact on manufacturing output and fixed capital per capita. Additionally,
electrification could provide the boost that new or small firms need to survive. I can
test this by using data on the number of factories and on the small sector (e.g. value
added and fixed capital).
Different variables are represented by eat to capture the reach and network
development in states’ electricity supply at a point in time. The total number of
consumers per type (farmers and factories) connected to the network relative to the
state population and the average connected load (i.e. the maximum electrical power
consumption per user) measure the depth of the network.
To control for demographic features and human capital, I include the log of population density and the proportion of rural and literate population. In order to in
vestigate whether the infrastructure variable is actually picking up the effect of more
credit availability (thus allowing more manufacturing firms to start up), I control for
financial development by including indicators such as the log of real per capita total
credit. As noted by Laffont (2005), government inefficiencies and corruption in
crease the marginal cost of raising funds and constrains the ability of the executive to
invest in infrastructure. It follows that the indicators of electricity network develop
ment might actually be capturing these political economy variables that could drive
both dependent and independent variables. To address this concern, state controls
for the Congress Party in parliamentary elections) and real per capita expenditure
on development sectors such as health and education. The latter is not only aimed
at capturing states’ investment in human capital, but also the ability and/or willing
ness of the state government to enhance the economic environment. All variables and
sources are described in Appendix 2.A.
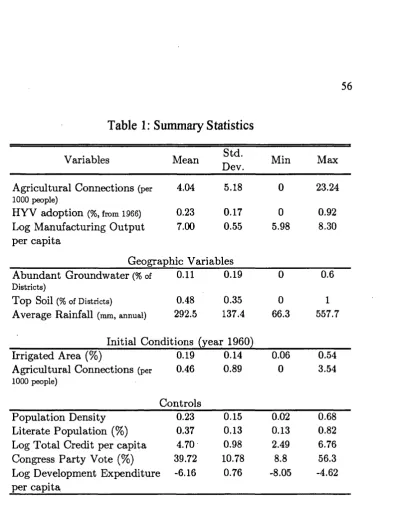
Descriptive statistics are presented in Table 1 for all main variables used in the
regression analysis. In particular, I focus on the number o f agricultural units con
nected to the network, manufacturing output, and the incidence of HYV at the state
level. Table 1 shows that there is significant variation in all three, with high values
of standard deviations relative to the mean and substantial differences between mini
mum and maximum. Of particular interest is the number o f agricultural connections
to the electricity network, whose mean increases tenfold during the period analysed.
Additionally, states show substantial variation in geographic characteristics and ini
tial conditions, a fact that will be exploited in the next section.
In the estimation o f the coefficient of interest, A, endogeneity is a major con
cern for quantifying the effect of infrastructure on output. The presence of corre
lation between the error term and the explanatory variable could be explained by
reverse causality (e.g. more industrialized states can afford investments in expanding
the electricity network) or omitted variables (e.g. unobserved changes in the insti
tutional environment that drive both industrialization and electrification), and would
bias, since alternative stories could work in both directions. For example, phenomena
such as a pro-business environment could explain a positive correlation with both the
outcome and the explanatory variable, biasing the estimate upwards. Alternatively,
the formation of a strong pro-rural electrification lobby clashing with urban indus
trialists, for example, could explain a positive correlation with electrification and a
negative correlation with industrialization, resulting in a negative bias.
The challenge is to find a set of instruments that can explain the differential
pattern of investment in infrastructure that is not correlated with industrial output
by other means. I aigue in this paper that the introduction of High Yielding Va rieties (HYV) in Indian agriculture in the mid-60s is at the root of the dissimilar
development of the electricity network across states, without being related to con
temporaneous or potential industrial development. HYV seeds needed reliable irri
gation and access to electricity was a fundamental input for farmers to pump wa
ter. Because some concerns about the endogeneity of HYV adoption remain, I will
first investigate how geo-climatic characteristics and some initial conditions-such as
groundwater availability and irrigation prior to the Green Revolution, respectively-
have affected the diffusion of the new agricultural technology6. Subsequently, by
exploiting the fact that states followed either a path of adoption of the new agri
cultural technology-creating a demand for rural electricity, or a path of traditional
farming without creating the need for expansion of the electricity network, I will ex
plore whether the proposed instruments satisfy the assumptions that validate the IV
strategy. That is, I will investigate whether state specific characteristics leading to the
uneven introduction of new seeds starting in 1966 is correlated with the development
of the electricity network (i.e. power o f the instruments) and whether this relation
can be used to assess the differential impact in manufacturing outcomes (i.e. validity
of the instruments). The underlying idea is that as the electricity network expanded
to satisfy farmers’ needs, industrial producers have benefited.
2.3.1 Instruments
The adoption of HYV seeds in rural India has been subject to a number of studies.
As noted by Sharma and Dak (1989) or Kohli and Sing (1997), among others, there
are many institutional factors that may claim a share of responsibility in the adoption
of this new technology. A list would include credit availability or price incentives (to
buy the new seeds, fertilizers, pesticides or new machinery), land matters (titling, dis
tribution and size) or human capital. The fact that these variables might be correlated
with (or determined by) industrial output calls for an exogenous source of variation
that explains HYV successful adoption. The answer lies in geographic and climatic
characteristics.
In a paper analysing the importance of human capital, Foster and Rosenzweig
(1996) point out that the technological change could be considered exogenous, given
seeds and that "a feature of the Green Revolution in India is that the ability to exploit
the new seeds profitably was substantially different across India because of exoge
nous differentials in local soil and weather conditions". On a similar note, Evenson
and McKinsey (1999) show that climatic and soil conditions, when combined with
basic investments in infrastructure, resulted in the diffusion of HYV seeds. In this
section I further investigate these claims by looking at the evolution of HYV adop
tion as a function of initial conditions, soil and climate characteristics (in particular,
groundwater) and their interaction.
HYV adoption drivers: geography and initial characteristics
To investigate whether soil or climate characteristics can be linked to the adop
tion of the new agricultural technology when the Green Revolution started in 1966,1
run a regression of the following form:
1984
H YV,t = p 0l + p u + £ ■yk( S , * T k) + 5 X , t + e,t (2.2)
fc=1966
where H Y V at is the proportion of cultivated land with HYV seeds in state s at
time t, Ss captures states’ time-invariant geographic characteristics, and Tk is a year
dummy equal to 1 whenever k = t. State controls, X at, are included to control for
the above mentioned characteristics suspected to be correlated with the diffusion of
HYV seeds, such as the proportion of literate population, the log of real per capita
development expenditure, the log o f real per capita credit availability and population
at the state level to deal with serial correlation. The coefficients of interest in equation
(2.2) are 7fc, where positive and significant values would indicate that states with
more adequate S8 adopted a greater proportion of HYV seeds. Increasing values
o f 7t would also indicate that the difference was growing over time. Intuitively, the
appropriate characteristics for seeds to grow would trigger a path of divergence across
states in HYV adoption.
Three different state characteristics are used for Sa: to account for the avail
ability of abundant groundwater that could be obtained with electric pumpsets and
used to provide timely and adequate irrigation, I use the proportion of districts at the
state level that have an aquifer thicker than 150 metres. This measure is the most im
portant for my empirical strategy, since groundwater availability has been the major
source o f electrified irrigation after the Green Revolution (see, for example, Foster
and Rosenzweig, (2008)). Other geographic characteristics include the quality of the
land, where I use the proportion of districts per state with a topsoil depth of at least
3 metres. Finally, to account for aridness, I use the average annual rainfall at the
state level. Sharma and Dak (1989) maintain that "HYV was directed towards areas
that were irrigated and not areas that relied on rainfall. The rainfed areas comprising
70% as against 30% of irrigated areas remained outside the fold of green revolution."
That means that HYV was directed towards drier areas, leaving states with abundant
Sharma and Dak (1989) also claim t h a t t h e new technology was tilted to
wards areas with better quality lands, assured irrigation facilities and more developed
infrastructure". Before the Green Revolution started, all agriculture was rainfed and
farmers in drier states had to rely on irrigation, like canals or pumpsets. This initial
"curse" that induced a state to look for alternative sources of water might explain why
some states, who were better prepared to reliably irrigate their crops, ended up in
troducing these new high-yielding but sensitive water-dependent seeds. Chakravarti
(1972) notes that "farmers under HYV cannot afford to take chances with erratic
rainfall, but 70% of the cropped area in India has rainfall too low or too unreliable to permit their use even during the main cropping season, and only 2 0% of the area is ir
rigated. Even where the annual rainfall is heavy, the available moisture is insufficient
for crop production during winter and premonsoonic seasons. The HYV has been
adopted mainly in areas with well developed irrigation facilities." To account for this
interaction between geographic characteristics and initial levels of infrastructure, I
also run a regression of the form:
1984
H Y V ,t = /J0, + 0 l t + E 7u ( S . * / C . 59* rO + 7 j(Sf. * T t )
fc=1966
+7 3( ^ s59 * T*;) + <5(Xa59 * Tfc) + eat (2.3) where ICa59 is a measure of infrastructure at least 5 years before the new seeds
were introduced, captured by two variables: proportion of irrigated land and agricul
in the specification of equations (2.2) and (2.3) is related to the introduction of state
controls. In the latter case, as I am testing the effect of initial conditions such as
irrigation, I am concerned that variation across states in the initial values of other
characteristics are driving the results. For example, it might be the case that what
mattered for HYV adoption was the initial level of human capital (e.g., literacy). In
the former regression, I am focusing on time invariant characteristics, so I want to
control for changes in potentially relevant variables. Also note that equation (2.3)
also includes Ss and I Cs59, implying that lower levels of interactions are included
and results captured by vectors 7 2 and 7 3. This means that values of j lk would now represent the marginal levels of adoption for states whose more appropriate ge
ographical characteristics for HYV diffusion were complemented with better initial
infrastructure.
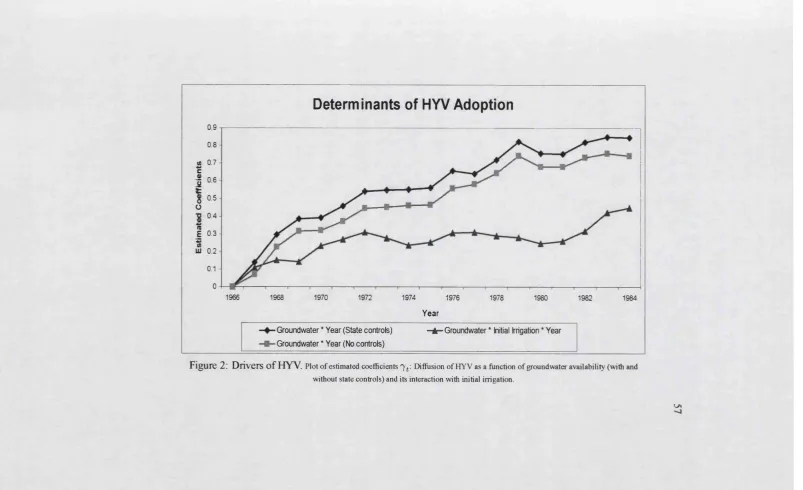
The estimation of regression (2.2) provides point estimates of the yearly impact
of groundwater availability on HYV adoption, as captured by the coefficients 7t. Re
sults are shown in Figure 2 for specifications with and without state controls. All
estimated coefficients are significant at the 1% level and show that states with
bet-\
ter access to groundwater have become relatively more intensive in the use of HYV
seeds7. Figure 2 also plots estimates for 7U in equation (2.3), where I use die mea
sure of groundwater availability interacted with initial levels of irrigation. A similar
result is obtained when using initial incidence of electricity in rural areas as a mea
sure of initial conditions (unreported). The positive, significant and increasing coeffi
cients show a maiginal effect for states that on top of having groundwater availability
also had greater initial agricultural facilities. This is consistent with the idea that a
combination of good geo-climatic conditions and investment in infrastructure fosters
the adoption of technological change in the agricultural sector. Additionally, the in
creasing gap over time suggests that initial characteristics triggered a self-reinforcing
process of HYV seeds adoption.
Instruments power
The last section provided evidence that the depth in the diffusion of the Green
Revolution can in part be attributed to geographic characteristics, in particular to the
measure of groundwater availability. The empirical strategy here will exploit their
role in the differential adoption and success of HYV seeds in Indian states as a shock
to their decision to expand their electricity grid, exogenous to the needs or the per
formance of their industrial sector. If the instrument is not perfectly uncorrelated
with the error term, the consistency of the IV estimator relative to OLS hinges on the
power of the instrument, i.e. on how important the correlation between the instru
ments (namely, Sa *Tk and ICs59* Ss * Tk), and the instrumented variable, electricity
provision (est), is8. To test the power of the instrument, I exploit the time dimen
sion o f the panel to test whether the timing at which some states have improved their
electricity reach significantly coincides with the start o f the Green Revolution.
A first specification looks only at the time dimension and tests whether there is
a structural change in the provision of electricity with the start of the Green Revolu
tion, using data on the electricity network that starts in 1950. To do this, I run
eJt = Ah + A (i - 1950) + $2(t - 1966) + s , t (2.4)
where the estimated Qi and 62 provide information on whether the evolution
of electricity provision before and after 1966, respectively, increases significantly.
Additionally, I introduce a test of the power of the instruments by interacting them
with the time terms as follows:
eb‘t = ebt + 0i(t - 1950) * S. + S2(t - 1966) * S. (2.5)
Additionally, I run (2.4) and (2.5) using state controls, available only from
1958. Finally, to check whether there is first hand evidence of the instruments having
explanatory power for the evolution of the variable of interest in the second stage-i.e.
industrialization-I run similar reduced form regressions using the log of manufactur
ing output per capita on the left hand side (available only after 1960). Even though
the pre-Green Revolution period is very short, these regressions might provide valu
able information on subsequent evolution, when states are divided along geographical
characteristics linked to HYV adoption.
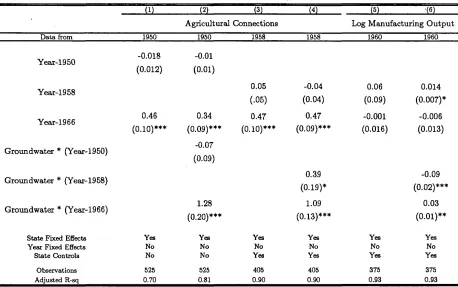
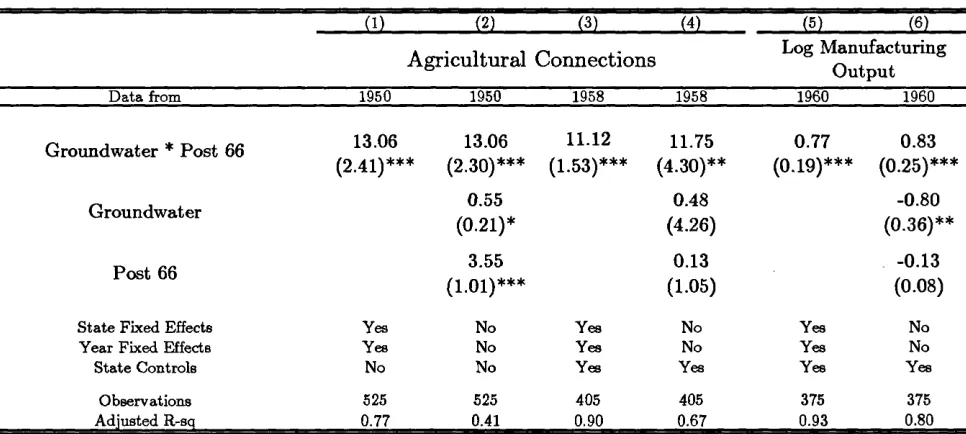
Table 2 shows results for six different specifications. In column (1), there is
no apparent change in electrification between 1950 and 1966. A different pattern
time. Column (2) interacts the measure of groundwater availability with both pre and
post Green Revolution time trends. Before 1966 there was no significant difference
between states with high and low levels of groundwater availability, and neither coef
ficient is statistically different from 0. After the Green Revolution started, however,
both sets of states increased their number of agricultural connections to the electric
ity network, even though the trend was considerably greater in magnitude for states
with higher groundwater availability. Columns (3) and (4) reproduce these results
when controlling for time-varying state characteristics. Column (4) suggests that in
the build up to 1966 states with abundant groundwater were on a slightly positive
trend of electrification, but then accelerated after 1966. Otherwise, coefficient mag
nitudes remain similar to results in columns (1) and (2). When analysing changes in
industrial output, columns (5) and (6) show interesting results. There is no apparent
change before and after the Green Revolution when all states are put together, as in
column (5). However, in column (6) it becomes apparent that the industrial output in
states with thick aquifers was falling behind before 1966, but that this trend turned
around with the Green Revolution. These results suggest that when states are divided
along the dimension of characteristics adequate for HYV adoption, a wedge in both
electrification and industrialization emerges, adding confidence to the suitability and
power o f the chosen instruments.
The second test consists of a difference-in-difference regression to see whether
electricity network after the Green Revolution started in 1966. The regression is of
the form:
e st = f io 3 + /?li + 7( S a * f*66) + £ s t (2.6)
where Pm is a dummy equal to 1 for all years after 1966. This regression pro
vides a simple before-and-after analysis, without looking at time trends. As in the
previous table, time-varying state controls (X at) are included for specifications af
ter 1958 only. A positive and significant coefficient for the interaction term Sa * Pm would mean that states whose characteristics are associated with greater HYV adop
tion have also, on average, observed a greater expansion of their electricity network after 1966.
Additionally, a specification without fixed effects of the form
e st = fis&s+ PpPm + l ( S3 * P36) + est (2.7)
would add some relevant information to the picture of the electricity expansion
across states. The coefficient (3a represents the difference across groups before the
Green Revolution started. A result where the coefficient is not significantly differ
ent from zero would suggest that electricity availability was not statistically different
across states before the introduction of the new seeds. The coefficient (3P captures
Revolution. A positive and significant coefficient would mean that these states sig
nificantly expanded their network on average after 1966.
Results are shown in columns (1) to (4) in Table 3. In line with the idea that
states with more abundant groundwater expanded their electricity reach more with
the start of the Green Revolution, the estimated coefficients for the interaction terms
are all positive and significant. Magnitudes for electrification remain similar, even
in the restricted sample with state controls. Results in columns (2) and (4) refer to
equation (2.7), where state and time fixed effects are dropped and estimates of the
coefficients for Sa and Ps can be obtained. Only the interaction term is positive and significantly different from 0 in both cases. Other results seem to lose significance
once state controls are introduced. The insignificance of (3a suggests that the mean
agricultural reach of the electricity network was not substantially different across
states in the years before the Green Revolution. An insignificant J3P suggests that the mean agricultural connections to the grid for the states with lower values of Ss
did not change after the Green Revolution, once other factors are controlled for. This
result can probably be explained by the great variation across states without abundant
groundwater (which drives up standard errors.)
To see whether this wedge in the evolution of electrification according to states’
geographical characteristics also holds for the second stage outcome, i.e. industrial
ization, columns (5) and (6) in Table 3 show results for a difference in difference re
with thick aquifers observed a differential increase in industrial output. It is also in
teresting to see in column (6) that before the Green Revolution, these states were
on average relatively less industrialized, as the negative coefficient on groundwater
availability shows.
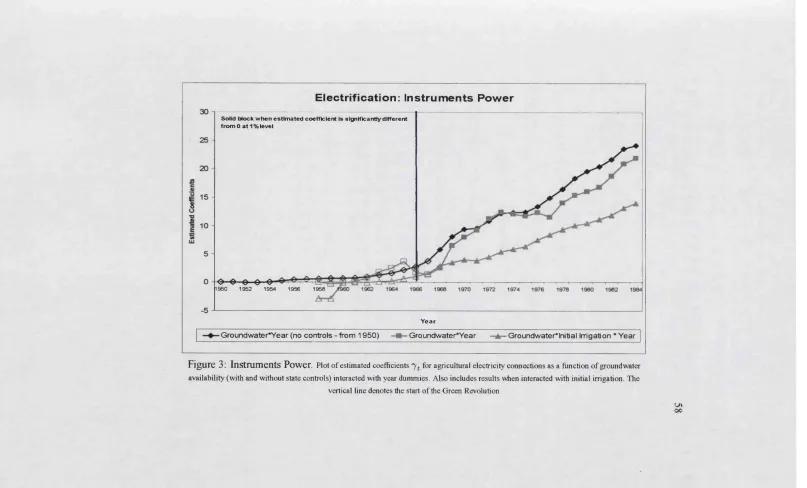
Finally, a third test consists in analysing whether the progress of the electricity
network has shown a similar pattern of divergence as the one observed for the HYV
adoption results in the previous section. To test for this, I follow a similar methodol ogy as in equations (2.2) and (2.3), but instead use the number of agricultural produc
ers’ electricity connections per 1000 people as the explained variable, and the same
measures of geographical characteristics (i.e. access to abundant groundwater) and
initial conditions (i.e. irrigated area in 1958).
Figure 3 shows three different specifications, all using the measure of ground
water availability. In the first one, I use the measure of electrification on the left hand
side, starting in 1950, with state and year fixed effects but no state controls. In the
second regression, the data start in 1958 and I include state controls. In the third, I
interact groundwater availability with initial irrigation, including all lower levels of
interactions. Results show that states with more suitable geographical characteristics
have expanded the electricity reach in rural areas after the Green Revolution. Even
though in two out of the three sets of results the divergence seems to start just before
1966, coefficients are not significantly different from zero and the slope becomes
abundant groundwater. Coefficients are significantly different from 0-at least at the
5% level, but most at the 1% level-only after the start of the Green Revolution. These
findings provide more evidence towards establishing a link between characteristics
that determined the innovation process in the agricultural sector and the subsequent
evolution of the electricity supply network.
This section has shown that the period following the introduction of HYV seeds
in 1966 is contemporaneous with a divergence in the electricity supply across states,
especially when states are divided along a measure of groundwater availability9. Ad
ditionally, a similar pattern emerges for a set of reduced form regressions of the out come o f interest-manufacturing output-on the same characteristics, supporting the
identification strategy. The next section will build on these findings in a two-stage
least square (2SLS) strategy to obtain an estimate of the impact of electrification on
measures of industrial development.
2.3.2 OLS and Two-Stage Least Squares Results
In this section I present OLS estimates of A in equation (2.1) and for the 2SLS spec
ifications where est is replaced by eat = f ( S s * T)(and by eat = f ( S a * IC 5qs * T)
when I include initial conditions). That is, I instrument the electricity indicator us
ing the measure of groundwater availability that, interacted with year dummies, has
shown explanatory power with respect to states’ divergence in both HYV diffusion
and electricity expansion. Additionally, since the adoption of HYV is the channel I
claim is at work, I also instrument eat with eat = f ( H Y V at(Sa *T)), where HYVat is
a generated instrument. Basically, I use the cross state variation in Sa interacted with
year dummies to predict the value of HYVat, and use these state and time-varying
predicted values (HYVst) as an instrument for the electricity indicator.
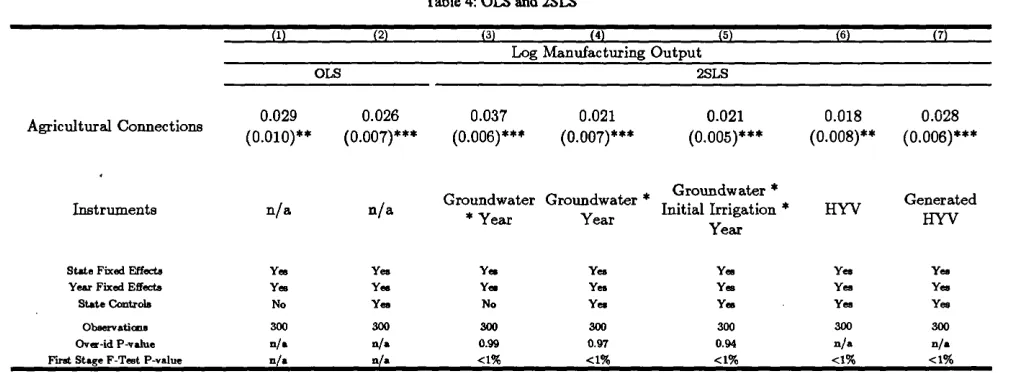
In results presented in Table 4 ,1 first look at the effect of electrification on the
log o f real manufacturing output per capita, by using the number of farms connected
to the electricity network per 1000 people as the explanatory (and instrumented) vari
able. Columns (1) and (2) show the OLS result with and without state controls (re
spectively), and find a positive and significant correlation between electrification and
industrialization. It is reassuring to find a positive and strongly significant correla tion between electrification and industrial output once other time-varying factors and
state fixed effects are controlled for. However, there are reasons to interpret this re
sult with extreme care. As mentioned before, a source of positive bias could be the
presence of reverse causality or unobserved state characteristics, such as the busi
ness environment, that are positively correlated with both industrial outputs and in
frastructure provision. Sources of bias towards zero could be any unobserved process
driving rural electrification positively, but at the expense of industrial producers (such
as skewed electricity pricing policies) or the presence of attenuation bias because o f
measurement error in the electricity indicator (produced by illegal connections, theft
Columns (3) to (7) show the key results in this chapter, where I use the time
varying effects of groundwater availability as an instrument for electrification. In
Columns (3) and (4) the number of agricultural electricity connections is instru
mented by the interactions between year dummies and the measure of abundant
groundwater availability, controlling for state-time-varying characteristics only for
the latter specification. In both cases, the coefficients are positive and strongly sig
nificant. What we learn from the different magnitudes of the estimates in columns
(3) and (4) is that the nature o f the bias changes if we don’t control for state vari
able characteristics. Column (5) uses the triple interaction, adding the proportion
of net irrigated area before the Green Revolution, and again finds a significant posi
tive coefficient, similar in magnitude to Column (4). Additionally, in columns (3) to
(5), I can carry out over-identification tests of the instruments that pass with a great
margin, with p-values above 90% in all cases. This suggests that instruments are
uncorrelated with the error term and correctly excluded from the second stage. In
column (6), the number of agricultural connections is instrumented with the net pro
portion of area cropped with HYV seeds. There is a small drop in the magnitude and
in the significance of the estimated coefficient. But HYV adoption might suffer from
similar endogeneity problems that could bias the results. Column (7) uses the same
instruments as Column (4) to predict the values of HYV adoption that I subsequently
use as a generated instrument. Results are consistent with previous findings both in
and significant at the 1% level when electrification is instrumented. In all cases, first
stage F-tests pass comfortably at the 1% level, in line with results in the previous sec
tion where I found a strong relationship between states’ time-invariant geographical
characteristics, HYV adoption and subsequent expansion of the electricity netwo