Lancaster University Management School
Working Paper
2005/036
Practitioners' perception of the impacts of virtual reality on
discrete-event simulation
Justice Ikpe Akpan and Roger Brooks
The Department of Management Science
Lancaster University Management School
Lancaster LA1 4YX
UK
© Justice Ikpe Akpan and Roger Bro oks All rights reserved. Short sections of text, not to exceed two paragraphs, may be quoted without explicit permission,
provided that full acknowledgement is given.
M. E. Kuhl, N. M. Steiger, F. B. Armstrong, and J. A. Joines, eds.
ABSTRACT
This paper presents the results from surveying simulation practitioners from industry and academics who have used 2D or 3D software applications for Discrete-Event Simula-tion (DES) projects. The survey focused on the impacts of Virtual Reality (VR) on DES activities. The findings indicate the software used, the applications areas, the stages in the simulation modeling process where Visual Display is commonly used, and a comparative evaluation of the benefits and costs associated with modeling in 3D over 2D. Other results indicate possible influence of each of the two displays on simulation results, effects on users’ understanding of the modeled system and any correspond-ing influence on decision-makcorrespond-ing. The findcorrespond-ings also incor-porate the pitfalls to avoid when modeling in 3D, and speculations about the future of VR-based DES practice.
1 INTRODUCTION
The simulation community is currently witnessing a prolif-eration of 3D/VR modelling software and tools. But, despite an increase in VRSIM practice, there is a lack of empirical evidence establishing any clear benefits over conventional 2D modelling.
The current literature seems to dominated by fairly su-perficial assessment of the novelty of 3D/VR software, speculative claims about VRSIM and ‘propaganda of suc-cess stories’ in an attempt to sell simulation solutions. Most users who have adopted the VR technology in DES are left to rely on recommendations and subjective evalua-tions from partners and ‘near-peers’ (Smith, 2000) rather than empirical studies. Consequently, some simulation practitioners remain sceptical about VRSIM due to the lack of empirical evidence of any substantial benefits (Zutphen et al., 1996; Asthmeimer, 1999). It has now become neces-sary to address the important questions about the added value of VRSIM.
The rest of the paper discusses the claims about VRSIM as indicated in the literature, the aims and objec-tives of the survey and the survey design. Finally, the re-sults of the survey are discussed.
2 CLAIMS ABOUT VRSIM
The current literature speculates a number of benefits of VRSIM. This section states the claimed benefits.
2.1 Problem Definition
3D display can result in a better problem definition that is easily agreeable by all stakeholders of the simulation pro-ject than 2D display (Wainer, 1997; Munro, Hook & Benyon, 1999).
2.2 Model Validation
It is easier to identify errors in 3D than 2D, which can re-sult in a more accurate model. This is made possible by the excellent visualization capability of VRSIM. 3D display also enhances easy understanding of model behaviour dur-ing simulation runtime (Kamat & Martinez, 2000; McKay et al. 2002; Mesquita, Cunha, Henriques, Grave, Silva, 2000).
2.3 Generation of Ideas about the Modeled System
VR provides true to scale 3D graphics and animation, mak-ing simulation models easy to understand and invaluable for communicating new ideas and alternatives (Sheridan, 1992; Bennaton and Sivayoganathan, 1995).
2.4 Communicating with Clients and Presentation
3D graphics can be employed to simplify the presentation and interpretation of simulation results to the users, espe-cially where the stakeholders from various disciplines/non-PRACTITIONERS’ PERCEPTION OF THE IMPACTS OF
VIRTUAL REALITY ON DISCRETE-EVENT SIMULATION
Justice Ikpe Akpan Roger Brooks
Department of Management Science Lancaster University Management School
Akpan and Brooks
technical personnel are involved (Barnes, 1997; Smith and Duke, 1999).
2.5 Model Credibility, Acceptance and Usability.
3D models easily convey results and make any recommen-dations arising from the simulation more convincing and credible, and also lead to increased confidence in the model (Jones, 1992; Tanriverdi & Jacob, 2001; Jacob et al., 1999; Kessler, 1999).
2.6 Improving the Quality of Managerial Decisions.
The details gleaned from the 3D models helps the decision-maker to base decisions on accurate and plausible simula-tion feedback instead of resorting to experience and per-sonal judgement and helps the management to make more prudent decisions. Bridging the communication gap be-tween model developer and management/non-technical personnel, VRSIM can become a catalyst for resolving complexities in the simulation models, and improves the quality of decision-making (Shannon, 1975).
3 SURVEY DESIGN
3.1 Objectives of the Survey
The main objectives of the survey were to identify the views of simulation practitioner about the hypothesised benefits of VRSIM, and to establish whether simulation practitioners and users in the industry also echo the enthu-siasm about 3D/VR simulation of the software vendors.
3.2 The Sample
The target respondents for the survey were simulation con-sultants, model builders and users or decision-makers from the industry and academics. The selection of the survey sample was not based on any formal statistical method. Also, the population was not limited to any geographical boundary. Rather, effort was made to reach any respon-dents irrespective of country of residence or country of practice.
3.3 Questionnaire Administration
Two different sets of questionnaires were administered separately namely, questionnaire to model builders and users of 3D/VR Simulation software, and to the 2D modelers and users respectively. The survey was con-ducted between the months of March – May 2004. Three different approaches were employed to reach the respon-dents as explained in the section below.
3.3.1 Personal Contacts
In this approach, respondents were contacted individually during a two-day workshop of the Operational Research (OR) Society Simulation Study Group at Birmingham, UK in March 2004. After a brief discussion with each respon-dent, the appropriate version of the questionnaire was is-sued, which was later completed and returned (before the end of the workshop). A response rate of 100% for the 3D/VR and over 91% for the 2D was achieved using this approach (see Table1).
3.3.2 Online Survey
Here, the subjects completed and submitted the question-naires online, with responses automatically collected into an Access Database. Over 63% of the 3D/VR responses and 71% of 2D were obtained through this approach.
The online respondents were first contacted by email with a link to the online version of the questionnaires. In addi-tion to the subjects that we contacted directly, a major simulation software vendor in the United Kingdom also of-fered some assistance by emailing its customers/clients with the link to the survey web site, asking them to com-plete the questionnaires online. However, it was not possi-ble to determine the response rate. This is because we did not know the number of potential respondents who actually received the covering email from the third party, or those who visited the site without completing the questionnaire.
3.3.3 Postal Survey
The postal survey was a last resort to get some known re-spondents to complete the questionnaire, after an initial contact by email was unsuccessful. The postal survey at-tained a 100% response rate as shown in Table 1.
Table 1: Survey Methods and Response Rate Survey Methods Personal
Contacts
Online Postal Outcome
3D/VR 2D 3D/VR 2D 3D/VR 2D
Contacts 4 11 - - 4 -
Response 4 10 14 25 4 -
Rate (%) 100 91 - - 100 - Received 3D/VR users = [22] 2D users = {35}
4 RESULTS OF THE SURVEY AND DISCUSSION
This section presents and analyzes the results of the survey. For ease of comparison of responses from the two different categories of respondents (users of both 3D/VR and 2D applications, and users of only 2D applications), both results are summarized in the same Tables. In such cases, the results from 2D respondents are shown in the curly
brackets.
[image:4.595.54.286.253.485.2]4.1 Results of the Survey
Table 2: Business Sector of Respondents’ Organizations
3D Respondents 2D Respondents
Organiza-tions Count* % Count* %
Aerospace 9 11 4 9
Automotive - - 3 7
Consulting 15 17 6 13
Defence 16 19 - -
Education 12 14 8 17
Electronics 5 6 1 2 Energy, Oil
and Gas
10 12 4 9
Financial Services
- - 1 2
Manufactur-ing
15 17 14 30
Healthcare - - 2 5
Media 1 1 1 2
Mining - - 1 2
Nuclear 2 2 1 2
Telecommu-nications
1 1 - -
* Respondents selected more than one sector
Table 3: Job Titles of Respondents
Job Title 3D Respondents 2D Respondents
Consultant 2 [9%] 2 [6%] Co-ordinator - 1 [3%] Engineer 5 [23%] 9 [26%] Instructor 1 [4%] 5 [14%] Manager /
Deci-sion-maker
5 [23%] 13 [37%]
Operational Re-searcher
6 [27%] 5 [14%]
System Modeller 3 [14%] -
n = 22 n = 35
Table 4: Number of DES Model Developed or Used Number of
Models
3D Models 2D Models
1 – 5 11 [50%] 3 [13%] {9, 26%} 6 – 10 6 [27%] 4 [18%] {7, 20%} 11 – 15 - 1 [5%] {5, 14%} 16 – 20 - 1 [5%] {4, 11%} 21 - 25 - 3 [13%] {5, 14%} 26 - 30 1 [5%] 1 [5%] { - }
31 - 35 - -
36 - 40 - 1 [5%]
Over 40 - 4 [18%] {3, 9%} No
Re-sponse
4 [18%] 4 [18%] {2, 6%}
{}: Results from 2D Respondents
Table 5: Simulation Packages Used
3D Software 2D Software
% % ANSYS FLUENT 4 ARENA 9 {6}
AUTOMOD 4 AUTOMOD 3 {4} BASESIM 4 ClinSim - {2} COSMO World 7 eM-PLANT 6 {2} eM-PLANT 7 FORESS - {2} FLEXSIM 4 MathCad - {2} INNOVATE 4 Matlab 3 {2} MAYA 7 POWERSIM - {2} QUEST3D 12 ProModel 3 {7} REALIMATION 4 QUEST 3 {2} SIMUL8 4 SIMAN - {4} Superscape VRT 7 Simple++ 6 {2} WINGS3D 4 SIMUL8 6 {11} WITNESSVR 32 VenSim - {2}
WITNESS 61 {52}
{} = Values from 2D respondents
Table 6: Types of Problems Tackled Using 3D Application
Using 2D Application Problems Tackled
Count * % Count * %
Facility Layout 14 29 9 {15} 12 {15} Facility Planning 9 19 17 {18} 23 {19} Long term Planning 2 4 6 {11} 8 {11} Operational Control 5 10 12 {20} 16 {21} Resource Allocation 6 12 10 {7} 14 {7} Capital Investment
Decision
7 14 12 {19} 16 {20}
Business Process Simulation
2 4 3 {3} 4 {3}
Budgeting - - 5 {3} 7 {3} Invalid Choices 4 8 - {1} - {1}
Akpan and Brooks
Table 7: The Use of Visual Display Using 3D
Display
Using 2D Display Modelling
Activities Count* % Count* %
Model Building 14 19 16 {29} 21 {26} Model Testing &
Validation 16 22 18 {31} 23 {28} Model Run 15 21 16 {16} 21 {14} Model
Experimentation 11 15 17 {22} 22 {20} Demo to Clients 17 23 10 {14} 13 {12}
[image:5.595.313.540.133.313.2]{} = Values from 2D respondents. * Respondents selected more than one option
Table 8: Reasons for Using 3D/VR
Reasons Counts* %
Helps in Model Development
• VR modelling is more engaging for students
1 3
Model Testing and Validation
• 3D display makes it easier to spot errors in the model
6 16
Ease of Model Understanding
• Non-technical or non-experts can easily understand 3D model
• 3D Display is intuitive
• Customer can relate to a 3D model better 5 2 3 14 5 8 Visualization and communication
• Excellent Communication with stakeholders
• Excellent quality of visualization and presentation
• Enhances model credibility as model is easily acceptable by clients
[image:5.595.51.280.282.546.2]• 3D Conveys extra spatial informa-tion 4 9 5 2 11 24 14 5 * Some respondents provided more than one reason
Table 9: Evaluation of 3D/VR and 2D Modeling 3D Better No Difference 2D Better Don’t Know Modelling Activities [%] [%] [%] [%] Model Building
2 [13] 2 [13] 11[68] 1 [6]
Testing and Validation
9 [57] 5 [31] 1 [6] 1 [6]
Model Run 4 [27] 5 [33] 5 [33] 1 [7] Model
Ex- perimenta-tion
4 [29] 5 [35] 4 [29] 1 [7]
Demo to Clients
13[93] 0 0 1 [7]
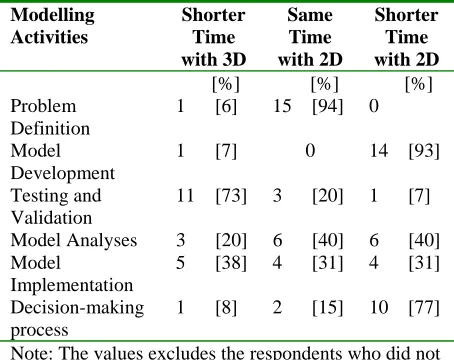
Table 10a: VRSIM Users’ Opinion on Time Taken to Perform Modeling Tasks
Modelling Activities Shorter Time with 3D Same Time with 2D Shorter Time with 2D [%] [%] [%] Problem Definition
1 [6] 15 [94] 0
Model Development
1 [7] 0 14 [93]
Testing and Validation
11 [73] 3 [20] 1 [7]
Model Analyses 3 [20] 6 [40] 6 [40] Model
Implementation
5 [38] 4 [31] 4 [31]
Decision-making process
1 [8] 2 [15] 10 [77]
[image:5.595.308.542.360.547.2]Note: The values excludes the respondents who did not answer the question.
Table 10b: 2D Users’ Opinion on Time Taken to Perform Modeling Tasks Modelling Activities Shorter Time with 3D Same Time with 2D Shorter Time with 2D [%] [%] [%] Problem Definition
11 [58] 7 [37] 1 [5]
Model Development
6 [32] 7 [37] 6 [32]
Testing and Validation
16 [84] 2 [11] 1 [5]
Model Analyses 3 [16] 9 [47] 7 [37] Model
Implementation
6 [33] 8 [44] 4 [22]
Decision-making process
10 [59] 2 [12] 5 [29]
[image:5.595.49.281.573.727.2]Note: The values excludes respondents who did not an-swer the question
Table 11a: VRSIM Users’ Opinion about an Effectiveness of 3D/VR v 2D Display
3D Better No Difference 2D Better Don’t Know Criteria [%] [%] [%] [%]
Communica-tion with Cli-ents
16 [84] 1 [5] 2 [11] 0
Model Under-standing
13 [68] 4 [21] 2 [11] 0
[image:5.595.302.551.589.684.2]Table 11b: VRSIM Users’ Opinion about an Effectiveness of 3D/VR v 2D Display
3D Better
No Difference
2D Better
Don’t Know Criteria
[%] [%] [%] [%]
Communica-tion with Clients
13 [45] 6 [21] 3 [10] 7 [24]
Model Un-derstanding
12 [41] 8 [28] 0 9 [31]
Note: The values excludes 6 respondents who did not answer the question
Table 12a: VRSIM Users’ Opinion on the Impact of 3D/VR and 2D displays on Simulation Results
Better Solution
Same Solution
2D Better
Don’t Know Criteria
[%] [%] [%] [%] Does 3D
en-hance better Solution?
11 [69] 7 [31] 0 0
Note: The values excludes 4 respondents who did not an-swer the question
Table 12b: 2D Users’ Opinion on the Impact of 3D/VR and 2D displays on Simulation Results
Better Solution
Same Solution
2D Better
Don’t Know Criteria
[%] [%] [%] [%] Does 3D
en-hance better Solution?
2 [7] 16 [57] 1 [4] 9 [32]
Note: The values excludes 7 respondents who did not an-swer the question
Table 12c: Summary of Users’ Comments on the Effect of Display Type on Simulation Solutions
Does 3D Enhance Better Solution? Comments from 3D/VR Respondents - Answer is in numbers, not in pictures
- Numbers (stats) are often more useful than display
Comments from 2D Respondents
- Analysis and communication of results play a greater part than visual presentation
5 9
0 0 5
5 9
0 0 5 14 9
14 9
0 41
23
14
9 0 5
9
27 36
14 18
41 41 41
73
0% 20% 40% 60% 80% 100%
Clearer Problem
Definition Better Error
Detection Better
Communication
Strongly Agree
Agree
Neutral
Disagree
Strongly Disagree No Response
[image:6.595.46.286.134.226.2]Akpan and Brooks
31 26
20 23 20 0
3 3
6 0 17 17
11 6
0 49
26
26 20
17 3
14
17 23
26 0
14
23 23
37
0% 10% 20% 30% 40% 50% 60% 70% 80% 90% 100%
Clearer Problem Definition
Better Anumation
Better Error Detection
Increased Client's Confidence
Better Communication
Strongly Agree
Agree
Neutral
Disagree
[image:7.595.55.283.111.476.2]Strongly Disagree No Response
Figure 1b: The Opinion of 35 Users of 2D Application about the Five Major Claims of 3D/VR Modeling
.
0 5 10 15 20 25 30 35
1 year
5 Years
Don't Know
Percent
3D
Respondents 2D
R d t
[image:7.595.302.552.122.563.2]Figure 2: Respondents’ Prediction on When VRSIM is likely to be Widely Used
Table 13: Limitations of VRSIM and Reasons for Non-Use
Comments by Respondents Mentions*
Complexity of 3D modelling
• More difficult and time consuming to define 3D shapes
• Harder to build 3D models
• Wastes modellers’ time, as customers want "disney production" rather than numbers
• 3D models is more complex to develop and takes longer time.
8 3
1
32 3D Hinders the Modelling Process
• Graphics may actively get in the way of see-ing the problem
• Working from a specific 'life like' rather than 'logical' perspective can make it possible to overlook the important aspects of the model
• Too much effort put into display rather than tackling the problem.
• Too much information is a distraction from main issues.
2
1
1
1
Limited Functionalities of current 3D Software Packages
• The future adoption of 3D by users depends on providing better tool support to simplify the 3D model-building process and quick and easy ways of creating elements
• Immature Technology
• Need to integrate 3D software with Virtual Reality Tools (e.g. HMDs, Gloves).
6 1
1 Additional modelling cost
• Large development overhead for no signifi-cant analysis benefit, just aesthetics
• Long learning curve: It requires time to train in new skills.
2 2
Longer run time of 3D model
•Run speed can be slower than 2D. 3 * Some respondents offered more than one
reason.
4.2 Summary of Findings and Discussion
This section presents a brief discussion of the key issues from the survey. The conclusions drawn from the study are based on the views of majority of the respondents.
4.2.1 VRSIM Improves the Accuracy of Simulation
Model
[image:7.595.56.288.514.648.2]compared to other modelling activities as cited by majority of modellers/users (31% and 28% of 3D/VR and 2D re-spondents respectively – see Table 7). For the 2D Dis-play, its use for checking of errors in simulation model has become far more popular than its usefulness in model demo, which was the case in the initial study of VIM ac-tivities (see Bell et al., 1999; Kirkpatrick & Bell, 1989) just over a decade ago.
Regarding the impacts of VRSIM on model accuracy, most people cited 3D/VR display as being more effective than 2D in spotting errors in simulation model. This is wit-nessed in two ways:
i. Majority of respondents who have used both the 3D/VR and 2D applications (57% - see Table 9) indicated that, VRSIM makes it eas-ier to spot errors in simulation model than 2D display.
ii. Significant majority of respondents (73% of 3D/VR users and 84% of 2D - see Tables 10a & 10b) stated that, testing and validation is shorter with 3D/VR than 2D.
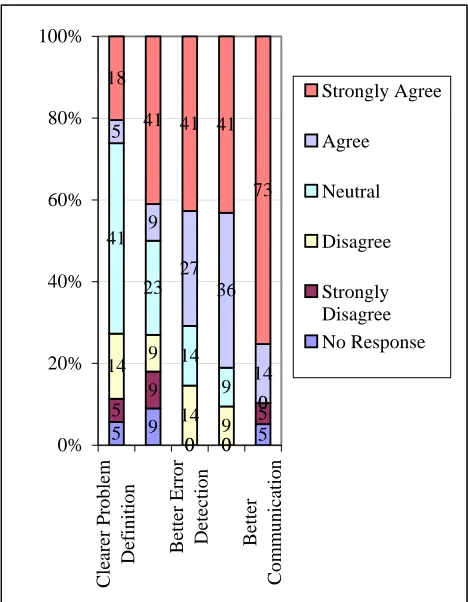
4.2.2 VRSIM Enhances Excellent Communication
with Clients
The study strongly supports the claim that VRSIM en-hances better communication between the model builder and the decision-maker about the problem than 2D display. Seventy-three percent of the 3D/VR respondents and thirty-seven percent of the 2D respondents (majority) viewed that VRSIM greatly improves communication with clients than 2D display during model demo, and made simulation results more convincing to the customers. More than half of VRSIM modelers and users cited excellent communication capability of the 3D display that most greatly influenced their decisions to adopt 3D Modeling. This may indicate a possible danger where the stakeholders extol the novelty of a pretty interface of model over techni-cal (statistitechni-cal) accuracy. However, its impacts on model acceptance cannot be overlooked.
The survey also revealed a high level of discontent with the use of 2D display as communication tool, given that majority of the 2D users indicated their preference for VRSIM for this purpose. Current advances in computer graphics in which the use of 3D images has become very popular and common, making the use of 2D animation in-adequate explains this development.
4.2.3 VRSIM Improves Clients’ Understanding of the
Modelled System
Previous studies on the impacts of visual display in simula-tion modelling established that VIM (then referred to 2D display) enhances user understanding of the various as-pects the simulation problem (Hurrion, 1981; Hurrion, 1985; Kirkpatrick & Bell, 1989). This study however shows a different outcome. A significant majority (59% of the 3D participants and 34% of the 2D respondents) indi-cated that VRSIM makes it easier for managers, decision-makers and non-technical personnel to understand the modelled system, than when using 2D display. It is inter-esting to note that, although fewer respondents considered users’ ability to understand the model to be independent on the type of display, no respondent considered 2D display to enhance a better understanding of the modelled system than VRSIM.
4.2.4 VRSIM Increases Client’s Confidence in the
Simulation Model / Results
This study lends strong support to the claim that VRSIM increases confidence in the simulation results than if the 2D display is used. A vast majority of the 3D modellers or users (77%) indicated that they either ‘strongly agree’ or ‘agree’ to this assertion. A good number of the 2D respon-dents supported this claim though less convincing which can be explained by their lack of practical experience in VRSIM modelling.
The increased confidence in the simulation results therefore greatly facilitates credibility and acceptance. However, over reliance on simulation results based on a pretty interface rather than statistical correctness of the re-sult raises a serious concern and poses the danger of reject-ing a technical sound model with less convincreject-ing interface for a less sound model but with a visually pleasing display.
4.2.5 VR Model is More Difficult to Build and Takes
Longer Time to Develop
Akpan and Brooks
current software packages to make it easier to build 3D models.
4.2.6 Modeling Process Takes Longer to Complete
with VRSIM
The study investigated the time taken to complete the en-tire decision-making process (that is, between the problem definition stage and decision-making). A significant major-ity of 3D respondents (46%) viewed that the process is shorter with 2D than with VRSIM. The results implies that, the longer time taken to build 3D/VR model overshadows the time saved at the model testing/validation and imple-mentation stages, thereby making the overall time taken to complete the model building process to be longer when VRSIM is used than when using 2D.
4.2.7 VRSIM is the Future of Simulation
The views of respondents investigated about the time pe-riod before VRSIM become widely used. Majority of VRSIM and 2D modellers and users (27% and 25% re-spectively) indicated that 3D/VR modelling can become popular within the next five years, although the 3D respon-dents were slightly more optimistic than the 2D partici-pants. Furthermore, the general enthusiasm of respondents, especially the over 70% who indicated their willingness to be contacted for further VRSIM research as well as re-quested the results of this survey indicates that VRSIM has come to stay.
4.2.8 Limitation of the Survey
The selection of the survey sample did not follow any for-mal statistical procedure such as probabilistic sampling, hence the need for careful generalization of its conclusions.
Furthermore, the sample size of VRSIM users was smaller than those of 2D, which could limit the validity of the comparison of responses between the two categories. However, the smaller sample of 3D/VR users was largely due to fewer number of practitioners at present.
Nevertheless, this study has expounded the body of knowledge and provide empirical evidence about the bene-fits of VRSIM, indicate the aspects of simulation model-ling where the benefits can be attainable and state the pit-falls to avoid.
5 CONCLUSION
This study has provided empirical evidence regarding the various claims of VRSIM based on the views of simulation practitioners. Generally, the simulation community seems enthusiastic about the application of VR technology in DES but many remain cautious, guarding against possible exaggeration of the claimed benefits. The survey results
show that majority of 3D/VR modellers/users (and 2D modellers/users) are aware of the significant set-up costs, possible long learning curve for 3D modelling/software and the new modelling methodology of VRSIM. Despite these limitations, most simulation practitioners remain en-thusiastic about VRSIM as an inevitable next step in simu-lation modelling process.
Finally, the curiosity of participants in this survey, es-pecially by non-users (evidenced by the high number of request for the summary of this survey) is an indication that even the current skeptics can adopt the technology if the benefits are clear, realistic and convincing.
ACKNOWLEDGMENTS
The authors wish to acknowledge the assistance received from Lanner PLC by contacting its customers on our be-half and encouraging them to take part in the survey.
REFERENCES
Astheimer, P. 1999. A Business View of Virtual Reality. IEEE Computer Graphics and Applications, vol. 19, pp. 28-29
Barnes, M. 1997. An Introduction to Quest. In: Proceed-ings of the Winter Simulation Conference. Eds. S An-dradottir, K Healy, D Withers & B Nelson.
Bennaton, J and Sivayoganathan, K. 1995. The Usefulness of 3D Discrete Event Simulation. In: Proceedings of the 31st International MATADOR Conference, 20th – 21st April, Manchester, 99 – 103
Hlupic, V. 2000. Simulation Software: An Operational Re-search Society Survey of Academic and Industrial Us-ers. In Proceedings of the 2000 Winter Simulation Conference, J A Joines, R R Barton, K Kang, and P A Fishwick, eds.
Jacob, R. K, Deligiannidis, L and Morrison, S. 1999. A Software Model and Specification Language for Non-WIMP User Interfaces. ACM Transactions on Com-puter-Human Interaction, vol. 6, pp. 1-46, 1999. Jones, N. 1992. Manufacturing Simulation using Virtual
Reality. Master’s Thesis.
Kamat, V R & Martinez, J. C. 2000. 3D Visualization of Simulated Construction Operations, Proceedings of the 2000 Winter Simulation Conference. J A Joines, R R Barton, K Kang & P A Fishwick eds.
Kirkpatrick, P and Bell, P. C. 1989. Visual Interactive Modelling in Industry: Results from a Survey of Vis-ual Interactive Model Builders. In Interfaces, 19:5, Sept – Oct., pp.71-79.
Mesquita, R et al. 2000. Usability Engineering: VR Inter-faces for the next generation of production planning and training systems. Online Access.
Munro, A. J. et al. 1999. Social Navigation of Information Space. Springer, London.
Shannon, R. 1975. Systems Simulation: The Art and Sci-ence, Prentice-Hall, Englewood Cliffs, NJ.
Smith, R. 2000. Simulation: The Engine Behind the Virtual World. Volume 1 in the Simulation 2000 series. Smith, S and Duke, D. J. (1999) "Virtual Environments as
Hybrid Systems," presented at Annual Conference Eu-rographics UK Chapter, Cambridge, 1999.
AUTHOR BIOGRAPHIES
Justice Ikpe Akpan studied Software Development at Leeds Metropolitan University, UK, where he received his MSc in 2001. Currently, he is finishing his PhD Thesis on the impacts of Virtual Reality on Discrete-Event Simula-tion at Lancaster University. He is a member of British Computer Society, UK and has worked as Software Devel-oper, Web Programmer, and Developer of Virtual Learning Environment (VLE) in the USA and UK. Email to:
<[email protected]> Website at:
<www.lancs.ac.uk/postgrad/akpan/>.
Dr Roger J Brooks is a lecturer in the Department of Management Science at Lancaster University. He has re-search interests in the methodology and the applications of
simulation. Email to:
<[email protected]>, website at