Computer aided fatigue design.
YAZDANPANAH, Amir.
Available from Sheffield Hallam University Research Archive (SHURA) at:
http://shura.shu.ac.uk/20587/
This document is the author deposited version. You are advised to consult the
publisher's version if you wish to cite from it.
Published version
YAZDANPANAH, Amir. (1990). Computer aided fatigue design. Doctoral, Sheffield
Hallam University (United Kingdom)..
Copyright and re-use policy
See
http://shura.shu.ac.uk/information.html
TELEPEN 100263112 2
Sheffield City Polytechnic Library
REFERENCE ONLY
f-mes
are
cnargeu m yup’pei nvufi
2 7 JUN 7002 4 ' 3 S
2
6
FEB 2004
&-SO
(^ { % a o - H ' V
tr> r^q
f
-v
2 6 HOV
m
ProQuest Number: 10701234
All rights reserved
INFORMATION TO ALL USERS
The quality of this reproduction is dependent upon the quality of the copy submitted.
In the unlikely event that the author did not send a com plete manuscript and there are missing pages, these will be noted. Also, if material had to be removed,
a note will indicate the deletion.
uest
ProQuest 10701234
Published by ProQuest LLC(2017). Copyright of the Dissertation is held by the Author.
All rights reserved.
This work is protected against unauthorized copying under Title 17, United States C ode Microform Edition © ProQuest LLC.
ProQuest LLC.
789 East Eisenhower Parkway P.O. Box 1346
COMPUTER AIDED FATIGUE DESIGN
by
AMIR YAZDANPANAH B.Sc, M.Tech
A thesis submitted in partial fulfilment of the requirements of the COUNCIL FOR NATIONAL ACADEMIC AWARDS for the degree of
DOCTOR OF PHILOSOPHY
Sponsoring Establishment: Sheffield City Polytechnic, Sheffield, SI 1WB.
Collaborating Establishment: nCode International Limited, 230 Woodbourn Road,
Sheffield, S9 30Q.
(Ao-cbu^1*5') \
> <* ./
J>
TO MY WIFE AND FRIEND,
CHRISTINE,
ACKNOWLEDGEMENTS
The author wishes to express his gratitude to Mr D E Eaton, Mr G Cockerham, Dr K Morton, and Dr L Lack for their helpful supervision during the course of this project. Thanks are also expressed to Dr S R Bradbury and other research assistants for their constructive suggestions and comments.
The technical assistance offered by Mr R Teasdale and his staff was much appreciated and in particular the author wishes to thank Messrs J Stanley, K Wright, D Allen, R Sidebottom and R Wilkinson for their valued contribution at various stages of this work. Finally, my gratitude to members of staff at nCode International Limited for technical assistance offered.
DECLARATION
The author declares that no part of this work has been submitted in support of another degree or qualification to this or any other establisHment- The author further declares that he has not been a registered candidate or enrolled student for another award of CNAA or other academic or professional institution during the course of the research programme
NOMENCLATURE
A = Area
b = Fatigue strength exponent
c = Fatigue ductility exponent
b = Fatigue strength in bending
Ci = t = Fatigue strength in twisting
E = Modulus of elasticity
f = Functional relationship
F = Force
G = Modulus of rigidity
Kt = Theoretical elastic concentration factor
K<j = True Stress Concentration factor
Ke = True Strain Concentration factor
K' = Cyclic Strength coefficient
Nf = Cycles to failure
n' = Cyclic strain hardening
AS = Nominal Stress range
cjyt = Yield strength
Oeq = equivalent stress
A a = Stress at notch root
o f ' = Fatigue strength coeficient
G i , G 2 , G3 = Principal Strains
Ae = Nominal strain
ea = AJE = Axial strain amplitude 2
Ge = Elastic strain
ep = Plastic strain
Gt = Total strain
G f ' = Fatigue ductility coefficient
Tensile strain normal to the plane of maximum shear.
• • • ay
Biaxial strain ratio.-, —7 Ae
Poisson's ratio
Axial stress amplitude
(73 = Principle stresses
Maximum shear strain
Shear stress amplitude on plane of maximum range of shear stress
Normal Stress amplitude on plane of maximum range of shear stress
Density
The elastic strain energy per unit due volume to the nominal remote stress
ABSTRACT
COMPUTER AIDED FATIGUE DESIGN
A Yazdanpanah B.Sc, M.Tech
Today's competitive market requires engineers to produce reliable light weight products at low cost. This can be achieved by more effective use of computer aided engineering tools during early stages of the design process.
A research programme has been undertaken to investigate the data requirements of integrating commercially available software packages (finite element analysis and fatigue life evaluation) to evaluate the integrity and durability of engineering components at the conceptual design stage.
A real engineering component, in the form of a st e e r i n g arm, supplied by a European truck manufacturer was used as a basis for the investigation. This is a typical vehicle component, in which, under service loading conditions, a multiaxial state of stress o c c u r s .
A geometric model of the component was created using the Prime "MEDUSA" s o f t w a r e suite. The m o d e l was u s e d to l o c a t e the boundary co-ordinates necessary for the development of a PAFEC Finite Element model. By imposing the conditions e x p e r i e n c e d during the service, the critical areas of the c o m p o n e n t were identified by analysing the F.E. model and a detailed description of the elastic stress/strain fields were also established. These were incorporated in an energy density approach and Ne u b e r ' s uniaxial analysis to predict total local elastic/plastic strains at these critical- locations. These were compared w i t h strain gauge measurements. The calculated results were used to plot a n u m b e r of l o a d / l o c a l s t r a i n c a l i b r a t i o n c u r v e s f o r t h e development of a load history, suitable for experimental fatigue life assessment.
Fatigue crack initiation tests were performed on the steering arm using a computer controlled DARTEC multiaxial fatigue t e s t i n g machine. Fatigue life assessment based on full service loading was carried out using a software package based on the critical location approach. A comparison of computerised, experimental and actual test circuit fatigue lives has been made.
The w o r k e n a b l e d a s p e c i f i c a t i o n to be p r o d u c e d f o r the i n t e g r a t i o n of the two items of software. This i n t e g r a t e d software was developed by third parties and used to p r o d u c e a computerised life map of the steering arm.
CONTENTS PAGE
ACKNOWLEDGEMENTS ii
DECLARATION iii
NOMENCLATURE iv
ABSTRACT vi
CONTENTS vii
INDEX TO FIGURES xi
CHAPTER 1 - INTRODUCTION
1.1 The Engineering Design Process 1
1.1.1 Background 1
1.1.2 Design Philosophy 2
1.1.3 Marketing Stage 4
1.1.4 Product Specification 4
1.1.5 Conceptual Design 5
1.1.6 Detailed Design 6
1.1.7 Application Of Computers In The Design Process 7
1.2 Computer Aided Engineering 9
1.3 Historical Perspective of Fatigue 11
1.4 Scope Of The Present Work 15
1.5 Principal Objectives Of Research Programmes 17 CHAPTER 2 - FATIGUE LIFE EVALUATION TECHNIQUES
2.1 Introduction 23
2.2\ N e u b e r 1s Rule 24
2.3 ) The Cyclic Stress/Strain Curve 27
.2.4 ) Methods Of determining The Cyclic Stress/Strain Curve 30
2.4.1 Multiple Step Tests 30
2.4.2 Incremental Step Tests 30
^T5\ Analysis Of Strain-Life Curve 31
CONTENTS (contd.)
2.7 Energy Density Approach For Elastic/Plastic Stress/Strain Calculation At the Notch Root 2.8 Multiaxial Fatigue
2.8.1 Principle of Static Yield Criteria to Fatigue 2.9 Critical Location Approach
CHAPTER 3 - STEERING ARM DESCRIPTION 3.1 Introduction
3.2 Steering Arm
3.2.1 Function Of A Steering Arm System 3.3 Chemical And Mechanical Properties 3.4 Micro-Structure Examination
3.5 Manufacturing Processes 3.6 Test Track Trails
3.7 Durability Assessment 3.8 Discussion
CHAPTER 4 - COMPUTER BASED ANALYSIS OF STEERING ARM 4.1 Introduction
4.2.4 FAMbuild
4.3 Two and Three Dimensional Geometric Modelling 4.4 Finite Element Analysis
4.4.1 Component Geometry and Material Properties
4.4.2 Development Of The Finite Element'Model 4.5 Results and Discussion
4.6 Conclusions
PAGE 36 38 41 44 59 60 61 61 62 64 65 66 68 93 94 95 96 .97 98 98 101 101 102 105 110
4.2 \Software Summary 4.2.1 MEDUSA
CHAPTER 5 - STATIC STRAIN MEASUREMENT OF THE STEERING ARM
5.1 Introduction 126
5.2 Test Equipment 126
5.3 Experimental Rigs 129
5.4 Strain Measurements 130
5.4. 1 Strain Gauge Specification 130
5.4. 2 Static Loading Results 130
5.5. Conclusions 134
CHAPTER 6 - COMPUTER BASED FATIGUE LIFE CALCULATIONS
6.1 Aims And Objectives 143
6.2 Software Summary 145
6.3 Measured Strain-Time History 146
6.4 Material
X 146
6.5 yFatigue Reduction Factor 147
v _x
6.6 Fatigue Life Evaluation 147
6.6. 1 FATIMAS Fatigue Life Assessment:
Measured strain-time Service History 147
6.6. 2 Fatigue Life Assessment:
Load calibrated measured strain-time Service History 148
6.7 Conclusion 151
CHAPTER 7 - FATIGUE TESTING OF THE STEERING ARM
7.1 Introduction .167
7.2 Test Equipment 167
7.3 Fatigue Testing 167
7.3. 1 Crack Detection Methods 168
7.3. 2 Fatigue Crack Initiation Tests 171
7.4 Visual Examination Of The Fracture'Surface 172
7.5 Fractrography Investigation 173
7.6 Microstructure 174
CHAPTER 8 - INTEGRATED F.E. AND FATIGUE COMPUTATIONS
8.1 New Software Structure 194
8.2 Steering Arm Fatigue Predictions 195
8.3 Discussion 197
8.4 Conclusions 198
CHAPTER 9 - DISCUSSION
9.1 Introduction 209
9.2 Computer Based Modelling and Analysis 211
9.3 Theoretical and Experimental Life Evaluation 215
CHAPTER 10 - CONCLUSIONS AND SUGGESTIONS FOR FUTURE WORK
10.1 Computer Based Analysis 218
10.2 Practical Applicability of the Technique 220
10.4 Scope for Future Work 222
REFERENCES 224
INDEX TO FIGURES PAGE CHAPTER 1
1.1 French's Model Of The Design Process 20
1.2 Archer's Model Of The Design Process 21
1.3 Pugh And Smith's Model Of The Design Process 22
CHAPTER 2
2.1 Variation Of Stress Concentration Factor And Strain Concentration Factor As Stress
Increases 47
2.2 Solving The Neuber Equation 48
2.3 Monotonic And Cyclic Stress/strain Curve 49
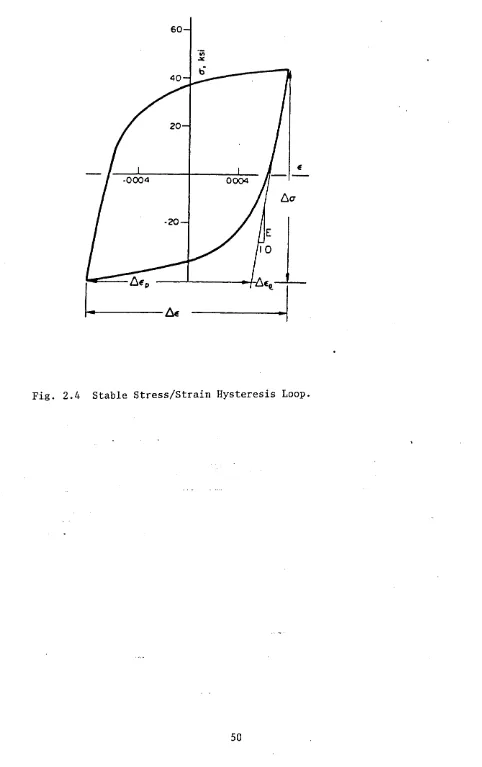
2.4 Stable Stress/Strain Hysteresis Loop 50
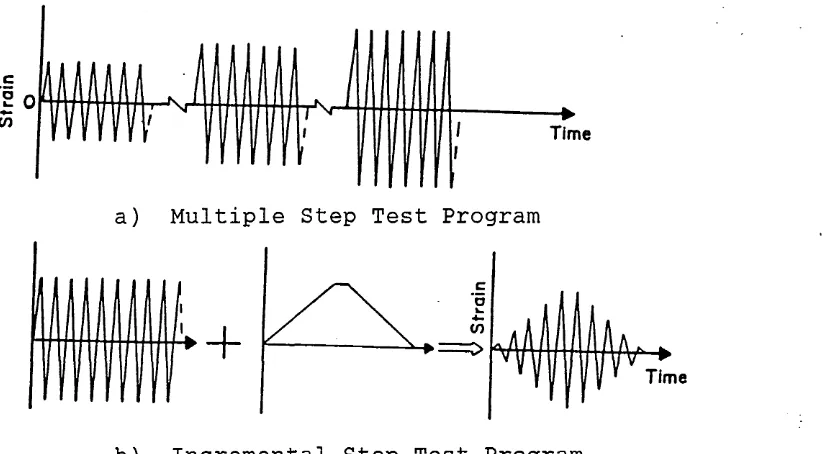
2.5 Strain Control Programmes For Obtaining An Approximate Cyclic Stress/Strain Curve From
One Specimen 51
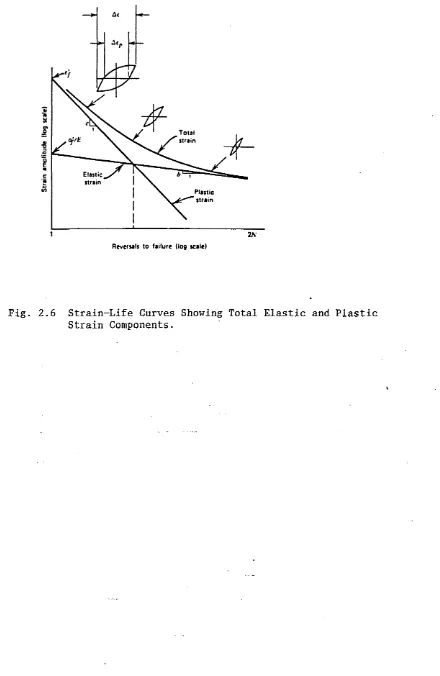
2.6 Strain-Life Curves Showing Total Elastic
And Plastic Strain Components 52
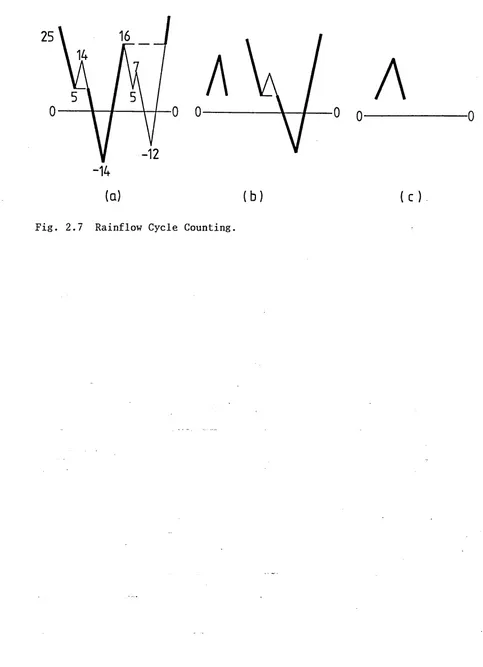
2.7 Rainflow Cycle Counting 53
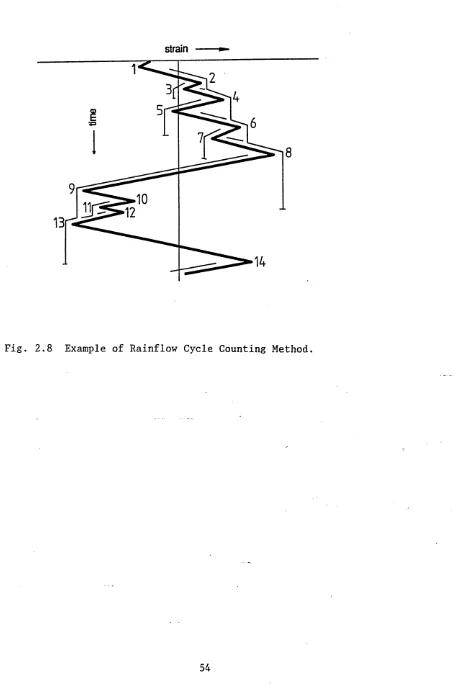
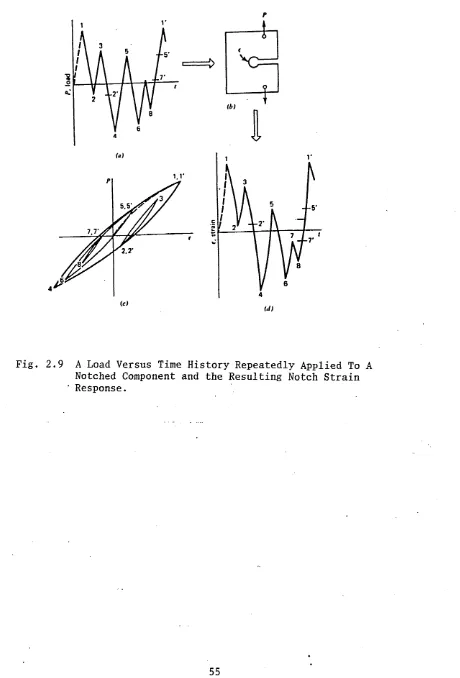
2.8 Example Of Rainflow Cycle Counting Method 54 2.9 A Load Versus Time History Repeatedly
Applied To A Notched Component And The
Resulting Notch Strain Response 55
2.10 Mohr's Circle Of Strain 56
2.11 Case A And Case B System Of Crack Extension 57
2.12 A Typical r Plot 58
CHAPTER 3
3.1 The Steering Arm 70
3.2 Steering Arm Dimensional Details 71
3.3 The exploded View Of The Steering System 72 3.4 Unetched Micro-Structure Showing The Inclusions 76 3.5 Etched Micro-Structure Showing Bainite In A
Matrix Of Martensite 77
3.7 Time Temperature Transformation Curve 7 9
3.8 Manufacturer's Test Track Surfaces 80
3.9 Recorded Stubaxle Strain-Time Service History 81 3.10 Cyclic Stress/Strain Curve (SAE 1046 V) 82
3.11 Strain/Life Curve (SAE 1046 V) 83
3.12 STW/Life Curve (SAE 1046 V) 84
3.13 Cyclic Stress/Strain Curve (41 Cr S4) 85
3.14 Strain/Life Curve (41 Cr S4) 86
3.15 STW/Life Curve (41 Cr S4) 87
3.16 Cyclic Stress/Strain Curve (41 Cr 4V) 88
3.17 Strain/Life Curve (41 Cr 4V) 89
3.18 STW/Life Curve (41 Cr 4V) 90
3.19 Stubaxle Cycle Distribution 91
3.20 Stubaxle Damage Distribution 92
CHAPTER 4
4.1 Three Dimensional Geometric Model Of
The Steering Arm 111
4.2 Shaded Image Of The Steering Arm 112
4.3 Element Types 113
4.4 A Mesh Used For Three Dimensional Finite
Element Analysis Of The Full Component 114
4.5 Stress Contours Of The Full Component 115
4.6 A Mesh Used For Three Dimensional Analysis
Of The Critical Part Of The Component 116 4.7 Streiss Contours Of The Critical Part Of The Component 117
4.8 Example Of Solving Neuber's Equation 123
4.9 Monotonic Estimated Load/Notch
Root Strain Calibration Curves 124
4.10 Cyclic Estimated Load/Notch
Root Strain Calibration Curves 125
CHAPTER 5
5.1 Dartec Fatigue Testing Machine Showing The Swivel
Joints, Rig And Component In Position 135
5.2 Exploded View Of The Rig 136
5.3 Location Of Post-Yield Strain Gauges 137
5.4 Monotonic, Measured And Estimated Load/Notch
Root Strain Calibration Curves 141
5.5 Comparison Of Monotonic, Predicted And
Measured Strain 142
CHAPTER 6
6.1 Washboard Strain-Time Service History 153
6.2 Fatigue Life Assessment 157
6.3 Hysteresis Loops 158
6.4 Cycle Distribution For Washboard History 159 6.5 Damage Distribution For Washboard History 160 6.6 Load Versus Life Comparison Of The FE Predicted
Fatigue Lives 163
6.7 Load Versus Life Comparison Of The FATIMAS Measured
History, and FE Predicted Fatigue Lives 166
CHAPTER 7
7.1 Washboard Strain-Time Service History 178
7.2 Washboard Load-time Service History 179
7.3 Load Versus Life Comparison Of The Experimental
And FATIMAS Predicted Fatigue Lives 182
7.4 Comparison Of Experimental And FATIMAS Predicted
Fatigue Lives 183
7.5 The Fracture Surface Of The Component 184
7.6 The Surface Immediately Surrounding The
Initiation Point 185
7.8 The Transition Area Between Slow Crack Growth
And Ductile Shear Failure 187
7.9 An Area Of Ductile Shear Failure 188
7.10 An Area Of Ductile Fracture, Showing Mixed
Fracture Modes 189
7.11 An Area Of Ductile Fracture, Showing
Non-Metallic Inclusions 190
7.12 Final Brittle Fracture, Showing Two Modes
Of Fracture (a) Intergranular (b) Cleavage 191 7.13 Brittle Fracture, Showing Intergranular
And Cleavage Fracture 192
7.14 Brittle Fracture Region, Final Catastrophic
Failure 193
CHAPTER 8
8.1 An Overview Of The FALCON Structure 200
8.2. Fatigue Life Contours For The Steering Arm (Maximum
Principal Stress Method) 201
8.3 Fatigue Life Contours For The Steering Arm
(Tresca Method) 202
8.4 Fatigue Life Contours For The Steering Arm
(von Mises Method) > 203
8.5 Fatigue Life Contours For The Steering Arm
(oxx Method) 204
8.6 Comparison Of The Experimental FALCON And FATIMAS
Predicted Fatigue Lives 207
8.7 The Flow Chart Showing An Overview Of The Routes
Taken To Assess The FAtigue Life Of The Steering Arm 208
CHAPTER 1 INTRODUCTION
1.1 The Engineering Design Process 1.1.1 Background
Design engineers in many industries today are expected to produce reliable products of light weight and low cost. This can be achieved by more effective use of c o m pu ter aided engineering tools during the design p r o cess.[1, 1]*. However, an understanding of the design proce s s e s is necessary before computers can be used to support them. Understanding these processes is the first and probably one of the most important steps in the development of an integrated computer aided design and durability assessment package. Such insights certainly make the designer more aware of the advantages and pitfalls of a d v a n c e d and sophisticated computer software packages.
The designer must consider a whole variety of events and c i r c u m s t a n c e s b e f o r e a t t e m p t i n g to use c o m p u t e r s to enhance the process. Presently, computer systems assist in the development of geometric modelling and can be linked to f i n i t e e l e m e n t s o f t w a r e for load a n a l y s i s . T h i s p r o d u c e s e l a s t i c s t ress f i e l d s and g u i d e s the designer in his endeavours and quite often fatigue life a s s e s s m e n t is n e c e s s a r y u s i n g s e p a r a t e s o f t w a r e or physical prototype.
This chapter briefly describes the different stages of the d e s i g n p r o c e s s a n d i d e n t i f i e s the a r e a s w h e r e an integrated CAD system might be successfully used. A brief historical development of fatigue life evaluation methods is also presented for completeness.
.1.2 Design Philosophy
It is now widely accepted that a systematic approach to p r o b l e m s o l v i n g is needed, if a h i g h p r o p o r t i o n of problems are to be solved in the best way [8].
In the past most designers' approach to problem solving has been intuitive rather than systematic. When they have exercised their art, native wit has been relied upon to produce a design and they would possibly find it difficult to explain how the design evolved [9].
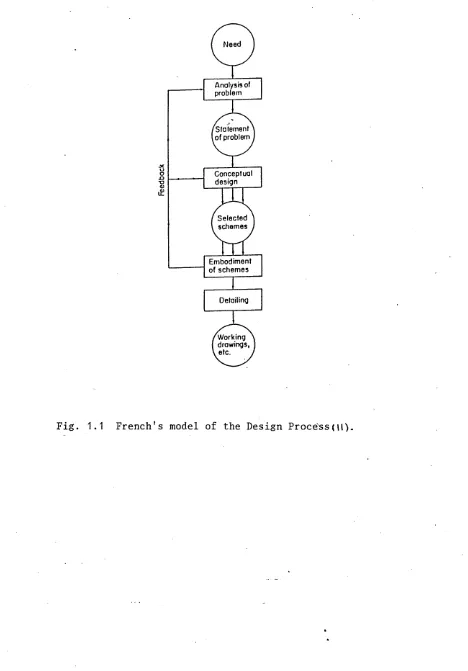
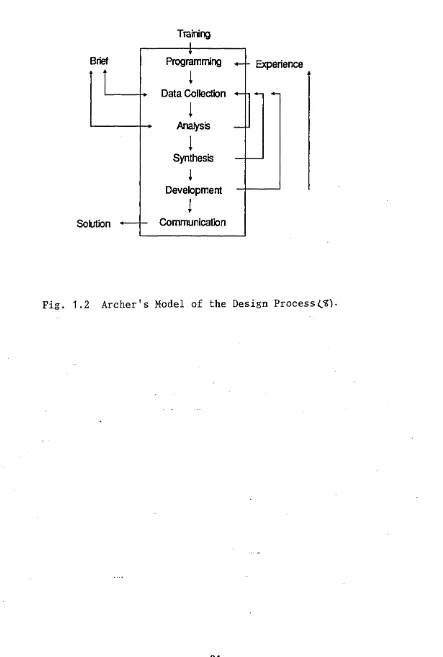
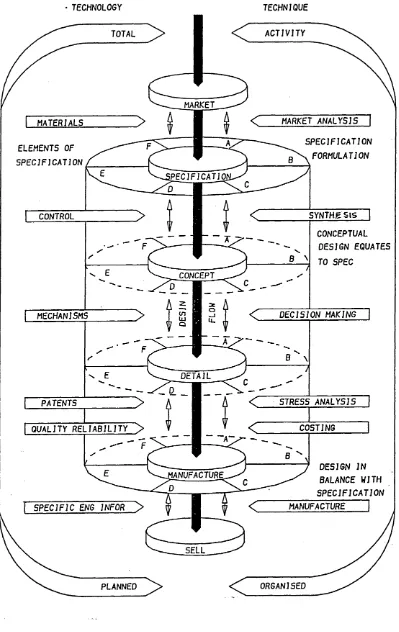
The designer must implement a set of specific objectives for investigating the needs and circumstances of the design activity, and synthesising these design objectives into an optimum solution. The failure to -consider all aspects of the design in a systematic way may p o s s i b l y lead to a workable solution, however, the designer will have little justification of the design solution. There are many structured design strategies available to the designer the following being typical [10-12] (see figures
1.1 to
i) French procedure ii) Archer procedure iii) Pugh and Smith procedure
Any systematic strategy may be selected during the design activity. The decision as to which strategy or tactic to use will depend upon the industry and the circumstances of the problem.
The following factors should be considered irrespective of approach:- market needs, specification, conceptual design, detail design, manufacture, and sales. The above phases
are applicable to any area of design be it construction, industrial product, or consumer product. It must be appreciated that design processes are highly interactive and iterative [10, 13].
Two further inputs are required to enable the desig n processes to work, these being technology and techniques.
Technological and other relevant information are dependent u p o n the i n d u s t r y and the p r o d u c t are a in w h i c h the designer is working. The informational inputs are the 'life b l ood' of d e s i g n . T h i s is an a r e a w h i c h is continuously changing and expanding through new material development and methods of storage and retrieval.
perspectives, models and the like. These techniques are used to manipulate the information inputs to a suitable form which then can be integrated into the design process.
1.1.3 Marketing Stage
Marketing can be defined as directing all the activities of an organisation (men, machine, material, m o n e y and b u i l d i n g ) t o w a r d s s a t i s f y i n g the p o t e n t i a l n e e d of consumer. The u l t i m a t e o b j e c t i v e bei n g to p r o d u c e a competitive, cost effective product that fits a market or creates a market of its own [10]. To achieve this an o r g a n i s a t i o n m u s t c o n s i d e r the f o l l o w i n g f a c t o r s
"population, technology, consumer taste and fashion, politics, income, and competition", although changes in need reflect changes in one or more of these factors. The aim of the market research activity is to c l a r i f y the design objectives and to identify the course of actions that are capable of bringing about a fully d e f i n i t i v e
product specification.
1.1.4 Product Specification
The starting point for any design is, or shou l d be a fully definitive product specification. This is formulated in conjunction and as a result of the information obtained in the marketing phase. This should be a clear document o u t l i n i n g all the d e s i g n o b j e c t i v e s and c o n s t r a i n t s r e l a t e d to the p r o d u c t a t t r i b u t e s and p e r f o r m a n c e .
1.1.5 Conceptual Design
The conceptual stage of any design should be c o ncer ned with synthesis, which Collins Dictionary defines as:
"combination, composition, putting together, building up of s e p a r a t e e l e m e n t s , e s p e c i a l l y of c o n c e p t i o n or propositions or facts into a connected whole, especially a theory or system" [87]
F r o m the a b o v e d e f i n i t i o n it is c l e a r that c r e a t i v e tactics are used in the conceptual (synthesis) stage of the design process and are for the purpose of generating functional solutions to the problem stated. Most designers are involved in the creative process in their search for the optimum solution to a design problem.
Conceptual design is about identifying possible solutions to a d e s i g n p r o b l e m w i t h i n the scope of the d e s i g n s p e c i f i c a t i o n b u t w i t h o u t n e c e s s a r i l y a n y d e t a i l c o m m i t m e n t to i n d i v i d u a l c o m p o n e n t shapes, s i z e s or m a t e r i a l s . M a n y e m i n e n t d e s i g n e r s b e l i e v e t h a t a systematic approach helps to generate many a l t e r n a t i v e c o n c e p t s w h i c h t h e n n e e d to be e v a l u a t e d t h r o u g h comparison with the requirements of the specification.
be explored, then computer aided draughting and design can be useful in the early stages of evaluation for techniques of geometric acceptability. Rapid determination through CAD of volumes, areas or enclosing envelopes are all helpful in eliminating unsuccessful concepts. If technical issues are not resolved it may be n e cessary to carry forward several concepts or at the technical evaluation stage, good concepts fail, therefore we have to start
again [13].
1.1.6 Detailed Design
Upon completion of the concept design, the detail design activity begins. At this stage the commitment to the development is very high, although no hardware has yet
been produced.
The conceptual and detailed design activities are highly interactive processes. The level of intera c t i o n is dependent upon the simplicity or complexity, nature and t y p e of p r o d u c t w h i c h is b e i n g d e s i g n e d . T h e simplicity/complexity are directly related to the number of elements which an artefact contains, the ultimate in simplicity being only one component.
This is the last phase, in which all the essential detail drawings and analytical procedures are decided. In this
p h a s e the u l t i m a t e o b j e c t i v e is or s h o u l d be t h e production of a product which contains the minimum number
of c o m p o n e n t s , h e n c e m i n i m u m c o m p l e x i t y - m a x i m u m simplicity. Addi t i o n a l l y the reliability is built into each component through the understanding of service loads, m a t e r i a l s and stress d i s t r i b u t i o n s . F i n i t e e l e m e n t analysis tends to be used when component ge o m e t r y is established to a large extent and provides opportunities for detail analysis and redesign.
Linking C.A.D, finite element analysis and fatigue life p r e d i c t i o n g i v e s an o p p o r t u n i t y for e v a l u a t i o n of alternative concepts some way into the detail design phase and therefore reduces the time spent in the development
and testing of prototypes.
1.1.7 Application Of Computers In The Design Process
Now that "the design activities have been explored it is necessary to examine the applicability or o t h e r w i s e of computer software packages at e.txcV\ stage of design.
During the market research phase the computers may be used to store the information on the existing product range,
level of competition, etc. This information can then be a n a l y s e d m a n u a l l y or u s i n g a p p r o p r i a t e c o m p u t e r techniques.
The application of computers in the specification phase of the design activity is again limited to the compilation of
d e p e n d s on t h e j u s t i f i c a t i o n of the t i m e a n d c o s t involved.
The application of computers in the conceptual and detail s t a g e s of the d e s i g n a c t i v i t y is d e p e n d e n t u p o n the industry and the type of product being designed.
There exist numerous separate computer software packages (e.g. computer aided draughting, finite element analysis and fatigue life evaluation etc.) which can be employed successfully to define the shape and assess the integrity and durability of components very quickly and accurately. Therefore, computers are used successfully as part of the analytical tools of the designer.
The introduction of computers already has i m p roved the efficiency of the design process. CAD has improved the quality of detailing and reduced the occurrence of errors. F i n i t e E l e m e n t A n a l y s i s t e c h n i q u e s h a v e b e e n u s e d successfully to assess the integrity of the components and hence reduce the static testing time. In the past these computer software packages have been used individually. T h e t r a n s f e r a n d e x c h a n g e of i n f o r m a t i o n f r o m o n e a p p l i c a t i o n to a n o t h e r w a s o f t e n t e d i o u s if n o t ; .feasible. With ever increasing use of c o m p u t e r s olid modellers for design of engineering components the natural p rogression has been to generate finite element m e s h e s automatically so that the solid m o delling and a n a l y s i s processes are integrated. This avoids the t edious and
error-prone manual transfer of data, hence saving both time and money [6,7],
The next logical step is or should be the integration of finite element output data with fatigue life analysis s o f t w a r e . T h i s e n a b l e s the d e s i g n e r to a s s e s s t h e integrity and durability of the components in the design stage before any commitment to prototype manufacture and testing has been made.
1.2 Computer Aided Engineering
In many engineering situations components are subjected to variable amplitude multiaxial stresses under service
aided engineering methods offer possible techniques [1,
2].
The o v e r a l l a i m of this p r o j e c t is to e v a l u a t e the engineering requirements of combining computer based
geometric modelling, finite element analysis and fatigue life prediction software packages. A system of this type c o u l d a l l o w e n g i n e e r s to p r o c e e d f r o m c o n c e p t to manufacture at the CAE workstation reducing the need for expensive and time consuming prototype build and test programmes.
The three areas of computer aided engineering mentioned previously are well established as separate entities. At t h e p r e s e n t t i m e c o m m e r c i a l l y a v a i l a b l e l i n k s a r e
established between the first two processes. However, as yet no e f f e c t i v e link exists b e t w e e n f i n i t e e l e m e n t analysis and c o m p u terised fatigue life assessment. The manual transfer and exchange of information from finite e l e m e n t to f a t i g u e life a s s e s s m e n t s y s t e m s is o f t e n tedious and time consuming, if feasible. Indeed, the precise form that the finite element analysis should take to produce data relevant for fatigue life analysis is not clear. Therefore, computerised fatigue life p r e d i c t i o n
methods are primarily used during the development stage as they rely on a prototype being available to give strain or stress histories. Once these stress and strain histories are known, alternative methods of predicting fatigue life a r e p o s s i b l e i.e. c r i t i c a l l o c a t i o n [ 3 ] , f r a c t u r e
mechanics[4], S-N curves[5]. Each method is complicated by
multiaxial loading and random loading conditions. For this work the critical location approach will be used, because it is extensively used in the ground vehicle industry and also can be incorporated into a computer program.
The next step in this overall process is the integration of finite element analysis and fatigue life a ssessm ent to assess the durability of engineering components at the design stage.
If successful, this approach could significantly reduce the need for prototype testing but at the same time ensure
high component reliability.
1.3 Historical Perspective of Faticrue
1 8 9 0 's Gerber [15] investigated the influence of the mean stress, and Goodman [16] proposed a simplified theory c oncerning mean stress. Another notable con t r i b u t o r of t h i s p e r i o d w a s B a s q u i n [17] w h o i n t r o d u c e d t h e exponential relationship between stress and fatigue.
The next important step . was the work by Bairstow [18, 19] at the N a t i o n a l P h y s i c a l L a b o r a t o r y . His 1909 p a p e r contains the earliest published hysteresis loops. This work indicates the phenomenon of materials u n d e r g o i n g cyclic softening. He also demonstrated that "the maximum w i d t h of any loop m e a s u r e d p a r a l l e l to the a x i s of extension added to the elastic extension of the specimen is the total change of length in each cycle". In the 1920's Gough [20] and associates performed studies of the fatigue limit on bending and torsion and found that the ratio of the fatigue limit in torsion to that of bending v a r i e d w i t h m a t e r i a l . In 1 9 2 9 / 1 9 3 0 H a i g h [21] i n v e s t i g a t e d the d i f f e r e n c e in the r e s p o n s e of h i g h tensile strength steel and mild steel to fatigue wh e n notches are present. He used the concept of notch strain a n a l y s i s and s e l f - s t r e s s e s . D u r i n g the 1 9 3 0 ' s an i m p o r t a n t p r a c t i c a l a d v a n c e w a s a c h i e v e d b y t h e introduction of shot-peening in the automobile industry. A l m e n [22, 23] c o r r e c t l y e x p l a i n e d the s p e c t a c u l a r
improvements by compressive stresses produced in the surface layers of peened parts and promoted the use of peening and other processes that produce beneficial self stresses.
In 1937 Neuber [24] introduced stress gradient effects at notches and the elementary block concept, which consider that the average stress over a small volume at the root of the notch is more important than the peak stress at the notch. N e u b e r 's Rule is now an essential part of most modern computer based methods of fatigue life predictions. In the same period the development of the bonded wire resistance strain gauge by Ruge and De Forest at MIT and S i m m o n s a n d C l a r k at t h e C a l i f o r n i a I n s t i t u t e of Technology revolutionised the technique of service load measurements. In 1945 Miner [25] formulated a linear
cumulative fatigue damage criterion suggested by Palmgren in 1924 [26]. This l i n e a r d a m a g e c r i t e r i o n is n o w r e c o gnised as the Palmgren Miner Law. It has been used extensively in fatigue life calculations involving random load histories.
In the 1950's Gassner [27] recognised the complex nature of service loading. To overcome the pitfalls of constant amplitude testing he suggested the variable-loading test be carried out for both ground vehicles and air craft. He proposed the use of block programming, tuhere the service data are analysed and broken down into blocks of loading to be applied sequentially.
l o a d h i s t o r i e s on s p e c i m e n s , c o m p o n e n t s a n d t o t a l mechanical systems. Electron m i c r oscopy revealed new horizons to a better understanding of fatigue mechanisms. Irwin [28] introduced stress intensity factor, Ki which has been accepted as the basis of linear elastic fracture mechanics (LEFM) and of fatigue crack growth predictions. Low cycle strain- controlled fatigue behaviour became prominent with the M a n s o n - C o f f i n [ 29, 30] r e l a t ionsh ip between plastic strain amplitude and fatigue life. These ideas are the basis for current local strain fatigue analysis.
Many multiaxial fatigue life prediction theories have been proposed by many eminent researchers. However, as yet no universally acceptable method exists. The traditional approach to multiaxial fatigue life evaluation has been based on the extension of the static yield criteria to fatigue [53, 64]. This is used to reduce the multiaxial component of stress or strain to a single equivalen t p a r a m e t e r , w h i c h c a n t h e n be a n a l y s e d u s i n g t h e conventional techniques developed. More recently, it has become clear that single parameter description of fracture is inadequate, but two parameters are required for more accurate fatigue analysis. Among the leaders in this school of thought are Brown and Miller [42]. The theory is based on critical plane approaches, w hich postu l a t e
that cracks initiate and grow on certain planes and that the strain normal to those planes assist in the fatigue crack growth process.
With the development of finite element techniques by the aerospace industry in the 1950's and 6 0 's stress analysis of complex structures was made possible. Prior to this all components had to be analysed by extremely comp l e x and often tedious techniques. Indeed, some methods became so complex that they were impossible to solve. Empirical data
and past experience were often the most useful tools at the e n g i n e e r ' s d i s p o s a l and as a c o n s e q u e n c e , lar g e factors of safety were incorporated resulting in large and over weight components.
The availability of low cost, high performance computers and associated fatigue software packages, together with advancement in load measurement and analysis method can n o w s i g n i f i c a n t l y a i d the e n g i n e e r a n d e n a b l e t h e development of efficient, effective and economic products. Application of these tools to component design can also reduce the need for expensive prototype 'build and test' programmes [31].
1.4 Scope Of The Present Work
analytical procedures used during the design stage are s u p p o r t e d w i t h full scale p r o t o t y p e b u i l d a n d test programmes. There are two weaknesses in this approach. First of all,.once the most suitable concept is selected, the detail design and analysis procedures are followed. In this phase, q u i t e o f t e n the static load a n a l y s i s is carried out and peak stresses are limited to fatigue s t r e n g t h of t h e m a t e r i a l but a r e n o t t o t a l l y representative of the service environment. Secondly, upon completion of the above procedures, prototype build and test begins. This is used to identify d u r a b i l i t y weaknesses in a given prototype. Obviously this process of build and test takes place very late in the design stage. Any limitations in the design analysis lead to repetition of the above procedures. This makes the process of design time consuming and prohibitively expensive [1, 2].
T h e p r e s e n t i n v e s t i g a t i o n i n t o the i n t e g r a t i o n of geometric modelling, finite element analysis and fatigue l i f e p r e d i c t i o n s o f t w a r e is b e i n g c a r r i e d o u t in association with nCode International Limited, suppliers of the FATIMAS [32] software which uses the critical location approach to estimate fatigue lives from a service strain history. Other software packages used are geometric m o d e l l i n g s o f t w a r e (MEDUSA) [33] and f i n i t e e l e m e n t analysis software (PA F E C ) [34, 35]. The above software has all the necessary capabilities to support the project. It
should be pointed out that already a link exists between MEDUSA and PAFEC, ie FEGS software[36] which will be used and evaluated as a minor element of the project.
Although the project concentrates on providing a link between PAFEC and FATIMAS, it is intended that any final conclusions will be applicable to other finite element and fatigue life prediction packages.
In this programme of work, the actual component used for evaluating the procedures developed was a steering arm of a 32 ton track supplied by a European manufacturer. This was e v a l u a t e d for a real s e r v i c e load h i s t o r y supplied by the manufacturer, which had been r e c o r d e d during the prototype testing of the vehicle d r i v e n on mixed test road surfaces at their test track. M a t e r i a l data was also supplied.
.5 Principal Objectives Of Research Programmes
The p r i n c i p a l o b j e c t i v e s of the w o r k p r o g r a m m e are therefore
To use a CAD software package to create a two and three dimensional geometric model of the steering arm, which will be used to select the boundary co ordinates for development of a finite elem e n t niesh.
To use a finite element package to develop a model and to identify the critical stress points in the s t e e r i n g a r m t o g e t h e r w i t h the e l a s t i c s t r e s s / s t r a i n data.
i)
iii) To use the local elastic stresses and strains generated in (ii), together with both the energy d e n s i t y a p p r o a c h [37] and N e u b e r ' s u n i a x i a l equation [38], to give the total elastic/plastic str a i n s at the c r i t i c a l points. O t h e r i n p u t s r e q u i r e d for the a n a l y s i s a r e the m a t e r i a l p r o p e r t i e s , an a p p r o p r i a t e g e o m e t r i c s t r e s s c oncentration factor, Kt, and service loading history. The a n a l y s i s wil l i n c l u d e b i a x i a l loading.
iv) To use strain gauge measurements under static loads to monitor the total elastic/plastic strains at these critical areas in the component in order to examine the validity of the application of the analysis outlined above (iii).
v) To use the total elastic/plastic strains obtained in (iii) to d e v e l o p l o a d / s t r a i n c a l i b r a t i o n curves for the component. These can be use d to create a load history, suitable for experimental fatigue life analysis.
vi) To experimentally monitor fatigue life measurement of the steering arm using a load controlled DARTEC computer controlled servo hydraulic m u l t i a x i a l testing machine.
v i i )
v i i i )
ix)
To use computerised fatigue life software FATIMAS to predict the fatigue life of the steering arm under service loading conditions.
To compare the experimental, comp u t e r i s e d and actual test track fatigue lives to examine the validity of the technique proposed.
To p r o p o s e t h e d a t a r e q u i r e m e n t s f o r t h e i n t e g r a t i o n of the f i n i t e e l e m e n t e l a s t i c s t r e s s / s t r a i n o u t p u t d ata file w i t h t h a t of fatigue life software package to prod u c e a life map of the component.
iE
Need
Selected schemes
Working drawings, etc. Conceptual design Analysis of problem
Detailing Embodiment of schemes
Fig. 1.1 French's model of the Design Process(H).
[image:39.612.53.521.56.727.2]Brief
Training +
Solution
Programming
i
Data CollectionI
Analysis
I
Synthesisi Development
I
CommunicationExperience
[image:40.619.76.519.85.742.2]DESIGN CORE BOUNDED BY PRODUCT SPECIFICATION
TECHNOLOGY TECHNIQUE
ACTIVITY TOTAL
MARKET
< MARKET ANALYSIS MATERIALS
SPECIFICATION
s FORMULATION ELEMENTS OF
SPECIFICATION
i P E C I F I C A T J O I
SYNTHESIS
CONTROL
CONCEPTUAL
DESIGN EQUATES TO SPEC
CONCEPT
o < DECISION MAKING in
UJ
MECHANISMS
DETAIL
< STRESS ANALYSIS PATENTS
QUALITY RELIABILITY > COSTING
DESIGN IN BALANCE WITH
SPECIFICATION MANUFACTURE
SPECIFIC ENG INFOR > MANUFACTURE
SELL
ORGANISED PLANNED
[image:41.620.98.497.42.674.2]CHAPTER 2
FATIGUE LIFE EVALUATION TECHNIQUE 2.1 Introduction
It is generally accepted that fatigue analysis based upon a knowledge of strain in a component is more logical than one based upon stress, since strain is the p h e n o m e n o n deemed more appropriate for modelling the plasticity which the component undergoes at the site of failure [39],
The local stress/strain method places emphasis on the local cyclic stresses and strains at the root of the notch w h e r e f a i l u r e o r i g i n a t e s . N o r m a l l y local v a l u e s are derived from nominal values, by applying N e u b e r 's rule [24] as determined by Topper, Wetzel, and M o r r o w [38, 39], and the cyclic properties of the material are used instead of the monotonic values. Multiaxiality causes complications and one approach is to reduce the complex stresses to a single equivalent parameter [53, 64].
The critical location meth o d has been es t a b l i s h e d as realistic for predicting the durability of engineering components. This approach is finding wide-spread use by many manufacturing companies [40, 41], in particular the automotive industry.
physical interpretation of fatigue damage accumulation. However, this approach is insufficiently developed to deal with non-proportional loading or accumulation of damage under random out-of-phase biaxial histories. Furthermore, the guidelines to deal with stress concentration factors, s t r e s s g r a d i e n t s etc, are not a v a i l a b l e . T h u s it's usefulness in the automotive field is at pre s e n t ve r y limited.
2.2 N e u b e r fs Rule
The f a t i g u e b e h a v i o u r in a n o t c h e d c o m p o n e n t c a n be predicted on the basis of known behaviour of a simple smooth specimen. The basis of the prediction is Neuber's rule [24], which takes into account the p o s s i b i l i t y of non-linear deformations at the root of the notch. Neuber developed a mathematical expression of the stress and strain concentration at a notch root.
£
Kt = (Ko. K e ) - 2.1
W h e r e
:-Kt = Theoretical elastic concentration factor.
JCd = True stress concentration factor.
Ke = True strain concentration factor.
Equation 2.1 is exact when the notch root remains elastic.
In this case, any concentration of stress is accompanied by the s a m e c o n c e n t r a t i o n of s t r a i n , w h i c h c a n be calculated using Hookas law.
Thus K o = Ke and from equation 2.1 Ko = K t as shown in
figure 2.1. The validity of N e u b e r 's expression is not necessarily obvious when yielding takes place at the notch root. H o w ever, it s u g g e s t s that as K o d e c r e a s e s , K e
increases in non-linear deformation, so their product could be constant.
For fatigue application equation 2.1 is usually altered by replacing Kt with Kf and defining K o and Ke as the ratio
of the ranges of stress and strain which result
in:-Aa A s
K f = ( — . — ) - 2.2
A S A e
W h e r e
:-act = Stress range at notch root
AS = Nominal stress range
a g = Strain range at notch root
Ae = Nominal strain range
Kf = Fatigue concentration factor
Equation 2.2 may be transposed giving
% £
All terms on the left side are determinable for each reversal from the load history and cyclic stress-strain curves, and all terms on the right side represent the local stress/strain behaviour of the material at the notch r o o t .
If the nominal conditions away from the notch are elastic
then:-A S
Ae = --- - 2.4
. E
G i v i n g
:-i’
Kf . AS = (Act. A g .E) - 2.5
*
T h e r i g h t h a n d s i d e of the a b o v e e q u a t i o n is a determinable constant for each half-cycle of load. The equation is of the form, X.Y = C, which is a rectangular hyperbola [39, 43].
For simulations of the material at the notch root, the smooth specimen must be strained until the product of the stress and the strain equal the constant C, where C = (Kf.AS)2 /E as shown in figure 2.2.
2.3 The Cyclic Stress-Strain Curve
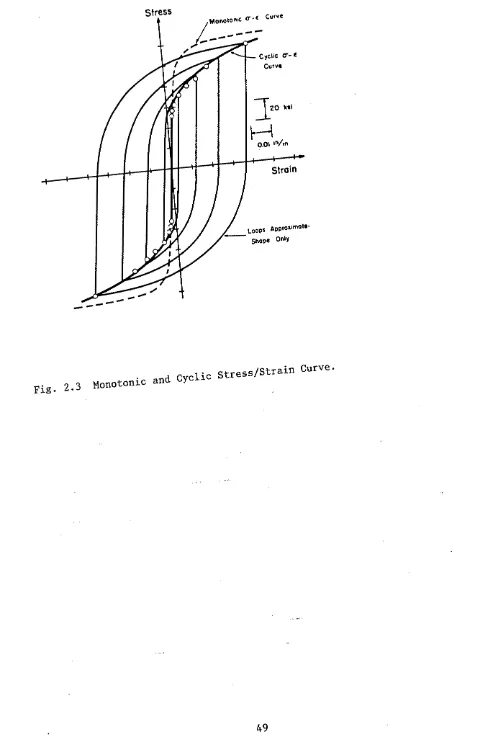
The cyclic stress/strain curve which provides a measure of the s t e a d y - s t a t e c y c l i c d e f o r m a t i o n r e s i s t a n c e of a material can be different from the monotonic stress/strain curve. The cyclic stress/strain curve, is the locus of tips of the stable hysteresis loops from several companion tests at different completely reversed constant strain amplitudes [43]. Such a steady-state stress- a m p l i t u d e strain-amplitude curve can be compared directly with the monotonic stress/strain curve. Cyclically induced changes in d e f o r m a t i o n r e s i s t a n c e t h e n b e c o m e i m m e d i a t e l y apparent. If the cyclic stress/strain curve is above the monotonic curve the material is said to cyclically harden;
if the cyclic curve is below the monotonic curve the material is said to cyclically soften [44].
Cyclic stress/strain properties are determined by testing s m o o t h p o l i s h e d s p e c i m e n s u n d e r ax i a l c y c l i c s t r a i n control. The cyclic stress/strain curve is defined as the locus of tips of stable "true stress/strain h y s t e r e s i s loops" obtained from companion test specimens. A typical stable hysteresis loop with a cyclic stress/strain curve drawn through the loop tips is shown in figure 2.3.
As shown in figure 2.4 the height of the loop from tip-to-tip is defined as the stress range (Act). For completely
subtracting the elastic strain amplitude (Ae4 /2 ) from the total strain amplitude.
A Gp A GT
2 2
For elastic conditions:
a s e Act
= — - 2.7
2 2E
Where;
E = modulus of elasticity
T h e n :
A Gp A 6T A <j
= - - 2.8
2 2 2E
The relation between cyclic stress and plastic strain can be described mathematically by a power function similar to that used for the monotonic curve [44, 45].
Act A Gp n 1
— = k' ( ) - 2 . 9
2 2
A G.
2.6
w h e r e : A a
— = S t a b l e S t r e s s A m p l i t u d e 2
A e P
= S t a b l e p l a s t i c s t r a i n a m p l i t u d e 2
n' = Cyclic strain hardening exponent
k' = Cyclic strength coefficient.
The value of n' is found to be between 0.05 and 0.30 and usually close to 0.15 for most metals regardless of their initial condition [44, 45].
In many field test conditions it is desirable to convert measured strains to the corresponding stresses in order to estimate fatigue life. Equation 2.8 can be rewritten
A g t A a A e p
= — + - 2.10
2 2E 2
Equation 2.9 may be rearranged giving A e P A a 1 / n 1
= ( — ) - 2.11
2k'
Substituting equation 2.11 into equation 2.10 yields an equation relating cyclic stress amplitude in terms of the p r e v i o u s l y d e f i n e d p r o p e r t i e s a n d t h e m o d u l u s of elasticity.
Aet • Act Ao 1 / n 1
-— = -— + (-— ) - 2.12
2.4 Methods of Determining the Cyclic Stress/Strain Curve
2.4.1 Multiple Step Tests
In 1910 Bairstow [46] and the later Dugdale [47] showed that the hysteresis loop rapidly adjusts to a stable steady state following sudden changes in cyclic strain amplitude. This makes it possible to obtain several points on the cyclic stress/strain curve from a single specimen by cycling at different strain amplitudes. Such a program is shown in figure 2.5a. Each strain amplitude ste p and the c o r r e s p o n d i n g s t a b l e stress a m p l i t u d e provides one point on the cyclic stress/strain curve. Cycling to about 20 percent of the life at a given strain amplitude normally gives a reasonable indication of the stable behaviour. The effect of strain sequence can be important. A high-to-low strain sequence is generally preferable. To avoid mean stress effects the strain amplitude should be decreased i n c rementally to zero stress and strain between blocks.
2.4.2 Incremental Step Tests
A s p e c i m e n m a y be s u b j e c t e d to b l o c k s of g r a d u a l l y increasing and then decreasing strain amplitudes as shown in f i g u r e 2.5b, to q u i c k l y d e t e r m i n e t h e c y c l i c stress/strain curve. After a number of these blocks, the metal cyclically stabilises. A continuous plot of the hysteresis loops through a block results in a series of superimposed loops with a clearly defined locus of tips corresponding to the cyclic stress/strain curve [48].
2.5 Analysis of Strain-life Curve
An analysis of the stable stress/strain hysteresis loops show that the strain is made up of elastic and plas tic components, so that at any given fatigue life these two components are present. At large strains or short lives, the plastic strain component is predominant, and at small strains or longer lives the elastic strain component is predominant [39, 48]. This is indicated by the straight lines and the hysteresis loop sizes in figure 2.6. The intercepts of the two straight lines at 2N = 1 are e'f for the plastic component and a ' / E for elastic component. The
slopes are c and b respectively. This provides the following equations for strain-life data of small smooth
specimens:-A Gt A Ge
+ 2.13
2 2 2
A GT
(2Nf )b + g 'f (2Nf )c 2.14
W h e r e
:-A GT 6a
= total strain amplitude
2 2
A G e
= Elastic strain amplitude 2
A Gp
2 P l a s t i c s t r a i n a m p l i t u d e
g 1f = Fatigue ductility coefficient
a'f = Fatigue strength coefficient
c = Fatigue ductility exponent
b = Fatigue strength exponent
2Nf = number of reversals to failure
The above relationship does not take mean stress into account; to overcome this disadvantage two laws have been proposed.
a) M o r r o w ' s law, w h i c h e m p i r i c a l l y r e d u c e s the fatigue strength coefficient by an amount equal to the mean stress [48, 49].
Ag t a'f - am
= (--- )(2Nf )b + G ' f (2Nf )c - 2.15
b) Smith-Watson-Topper parameter [50]
Z c ' f
Q m a x . 6 a — ( 2Nf ) 2 b + O'f ,6'f ( 2Nf )b + c 2.16
E
W h e r e
:-C7m a x maximum stress of the reversal.
The number of cycles Nf before failure at a certain level of strain range can be calculated using the above laws. The damage caused by one reversal is assumed to be equal to l/2Nf. This stems from the Palmgren-Miner theory for linear cumulation damage [39, 51]. The formal statement of the linear damage concept is that the summation of all fractions of life equals one.
Zni/Ni =1 - 2.17
Where n± is the total number of cycles applied during the fatigue life at a strain level corresponding to a fatigue life of Ni cycles.
The damage Di caused by a sequence of cycles or "loading block" can therefore be estimated
from:-Di = m / N i - 2.18
O bviously using equations 2.17 and 2.18 failure occ urs when Di =1
2.6 Extracting Hysteresis Loops (Cycle Counting)
The objective of all cycle counting methods is to reduce an i r r e g u l a r l o a d h i s t o r y to a s e r i e s of c o n s t a n t amplitude cycles and to compare these with the S-N or e-N c u r v e s o b t a i n e d w i t h u n i f o r m l y r e p e a t e d s i m p l e loa d cycles. The application of the linear damage rule D = 1/N requires a knowledge of the condition (mean and amplitude
of stress or strain) to which the damaging event should be compared.
The only meaningful method among those which are currently used to extract hysteresis loops from a strain signal is the "Rainflow Count" method proposed by M. Matsuiski and T. Endo [39, 52]. The operation of the rainflow method is shown in Fig. 2.7 for a history consisting of four peaks and four valleys.
The rules are:
1. Rearrange the history to start with the highest peak.
2. Starting from the highest peak go down to the next reversal, proceed horizontally to the next downward range, if there is no range going down from the level of the valley at which you have stopped, go upward to the next reversal.
3. Repeat the same procedure upward instead of downward and continue these steps to the end.
4. Repeat the procedures for all the ranges and parts of a range that were not used in previous procedure.
Thus assume that the highest peak is more extreme than the lowest valley. If not, start with the lowest value and go up instead of down. In figure 2.7a, the first traverse is shown. R e m a i n i n g r a n g e s are in f i g u r e s 2.7b. The procedure applied to figure 2.7b again leaves a pair of range unused. They are shown in figure 2.7c.
Another technique which gives the same results of cycle counting is that of imaginary rainflow on fictitious multi-farious overlapped pagoda roofs[48] as shown in figure 2.8. The strain-time history is plotted so that the t i m e a x i s is v e r t i c a l l y d o w n w a r d s , a n d t h e l i n e s connecting the strain peaks are imagined to be a series of pagoda roofs so that cycles and half cycles are defined, the rain starts at the top of the history and also at the inside of each peak and trough. The flow is sto p p e d by striking flow descending from above, or passing a point opposite a peak or trough with a greater magnitude than that which the flow started. Flow also stops w h e n it reaches the bottom of the history. Each flow is a half cycle, and there is a complementary half cycle of opposite sign elsewhere in the complete history, except for the beginning or the end of the history.
En ergy Density A p p r o a c h For Elastic/Plastic Stress And Strain Calculation At The Notch Root
An a l t e r n a t i v e m e t h o d to N e u b e r 's e q u a t i o n for the calculation of local stresses and strains is based on the energy density approach developed by Glinka [37, 62, 63].