Machine Learning based Approach for Protein Function
Prediction using Sequence Derived Properties
Amit Bhola
Department of CSE, KIT, Varanasi, U.P., India
Sanjeev Kumar Yadav
Department of CSE, KIT, Varanasi, U.P., India
Arvind Kumar Tiwari
Department of CSE, IIT B.H.U., Varanasi, India
ABSTRACT
Protein function prediction is an important and challenging field in Bioinformatics. There are various machine learning based approaches have been proposed to predict the protein functions using sequence derived properties. In this paper 857 sequence-derived features such as amino acid composition, dipeptide composition, correlation, composition, transition and distribution and pseudo amino acid composition are used with various machine learning based approaches such as Random Forest, Support Vector Machine (SVM), k-Nearest Neighbor (k-NN), and fuzzy k-Nearest Neighbor (k-NN) to predict the protein functions. This paper used various feature selection techniques such as Correlation Feature Selection, Gain Ratio, Information Gain, One R attribute, ReliefF to select the optimal number of features. The performance of various classifiers with optimal number of features obtained by various feature selection techniques. The comparative analysis of result shows that the random forest based method with reliefF provide the overall accuracy of 89.20% and Matthews’s correlation coefficient (MCC) 0.87% that is better to others.
Keywords
Protein function, Classification, Random Forest, SVM, k-NN, fuzzy k-NN
1.
INTRODUCTION
Proteins function predictions by using computational approaches are much cheaper and cost-effective as compared to biological experiments. There have been many methods developed for protein function prediction that are based on sequence similarity such as BLAST [1], FASTA [2]. Proteins are formed from a set of 20 amino acids and the function of a protein is closely related to its structure. The primary structure of a protein is the sequence of amino acids, secondary structure is the formation of alpha helixes, beta loops and sheets, and the tertiary structure is responsible for the spatial arrangement of the protein and the quaternary structure refers to the proteins that have more than one chain of amino acids.
There are three important approaches that have been widely used to predict the protein functions: firstly, using sequence similarity between amino acid sequences secondly protein structure comparison and the third approach using sequence and structure driven features or sequence motifs that do not use similarity.
We have taken the reference related to previous research work of protein function prediction which have compared various classifier models used in this study. In recent past the Bum Ju Lee (2009) has proposed [3] Random Forest and Support
Vector Machine based method to predict the protein functions by using sequence derived properties with an accuracy ranged from 94.23% to 100%. Also Statnikov A, Wang L, Aliferis CF proposed the comprehensive comparison of random forest and support vector machine and they suggested that both on average and in the majority of microarray datasets, random forests are outperformed by SVM[4]. Cai CZ, Wang WL, Sun LZ, Chen YZ also proposed [5] Protein function classification by SVM approach in which accuracy for the classification model of protein classes is found to be in the range of 84-96%. It suggests the importance of SVM in the classification of protein functional classes and its potential application in protein function prediction.
In this paper we have used nine functional classes of protein such as DNA Binding, RNA Binding, Ligase, Lyases, Transmembrane, Nuclear Receptor, Oxidoreductase, Signalling, and Transport. Here 857 sequence-derived features are used to test different classifier. In addition to obtain good predictive result, various machine learning algorithms such as Random Forest [6], SVM [7-9], K-NN [10] and fuzzy K-NN [11] have been used to build prediction and classification model.
The greatest accuracy 76.60% was obtained using Random forest under normal condition without using feature selection. This result has been improved by selecting different set of features (50, 100, 150, 200, 250, 300, 350, and 400) from original set, and the best result was achieved using 350 features by Random Forest with ReliefF.
2.
MATERIALS ANMD METHODS
2.1
Datasets
Prior to any machine learning technique, it is essential to collect the quality datasets. The lack of data quality leads to poor results from highly used algorithms. The data preprocessing task is performed in various steps. CD Hit tool has been used to reduce duplicity up to 50% in protein sequence. CD Hit makes cluster of proteins that meet a similarity threshold which is usually a sequence identity. Here, each cluster has a representative sequence and the input is a protein dataset which is in Fasta format. CD Hit generates a Fasta file of representative sequences and a list of clusters in text file.
18
Table 1. Data description
EC.NO Class Function Total Set
1 Oxidored
uctases
Catalyze the reduction oxidation Reactions.
345
2 Transme
mbrane
Serve as ligand transport proteins that
alter the permeability of
the cell membrane to small molecules
and ions
673
3
DNA-Binding
It interact with the major groove of
B-DNA, as it exposes more
functional groups which identify a base
pair.
384
4 RNA
It is implicated in various sort of biological
roles in regulation,
coding, decoding, and expression of
genes.
136
5 Lyases
Enzymes which catalyze the cleavage of C-C, C-O and C-N
links.
386
6 Ligases
Formation of links by condensation of
substances.
292
7 Nuclear
The double lipid bilayer membrane surrounded by
genetic material.
180
8 Transport
It bind particular small
biomolecules and transport them to other locations in the
body of a multicellular
organism.
592
9 Signalling
These are involved in the
process of cell signaling and
signal transduction.
626
2.2
Methodology
2.2.1
Random Forest
Random forest is a classification algorithm developed by Leo Breiman which uses an ensemble of decision trees. The term random decision forest was first proposed in 1995 by Tin Kam Ho of Bell Labs. Each tree is constructed by a bootstrap sample from the data, and it uses a candidate set of features selected from a random set. It uses both bagging and random variable selection for tree building. Once the forest is formed, test instances are percolated down each tree and trees make their respective class prediction. The error rate of a random forest depends on the strength of each tree and correlation between any two trees. It can be used to rank the importance of variables in a regression or classification problem in a natural way.
2.2.2
Support Vector Machine
Support Vector Machine (SVM) is a robust regression and classification technique that maximizes the expected accuracy of a model without over fitting the training data. It can be characterized as a machine learning algorithm which is capable of resolving linear and nonlinear classification problems. The prime idea of classification by support vector is to separate examples with a linear decision surface and maximize the margin of separation between the classes to be classified. It is more useful for analyzing large number of datasets, those with a large number of predictor fields.
2.2.3
K-Nearest Neighbour
Classification (generalization) using an instance-based classifier can simply locate the nearest neighbor in instance space and labelling the unknown instance with the same class label as that of the located (known) neighbor. This method is often referred to as a nearest neighbor classifier. The high degree of local sensitivity makes nearest neighbor classifiers highly susceptible to noise in the training data. A higher value of k results in a less locally sensitive, smoother, function. Nearest neighbour classifier can be regarded as a special case of the more general k-nearest neighbors classifier, hereafter referred to as a kNN classifier [12].
2.2.4
Fuzzy K-NN
The fuzzy KNN algorithm assigns class membership to a sample vector rather than assigning the vector to a particular class. Here ui(f) is the membership of the class i to the
unknown vector f, is defined as below:
𝑢
𝑖𝑓 =
𝑢
𝑖𝑗(1 ∥ 𝑓 − 𝑣
𝑗∥
2/(𝑚 −1)
)
𝑘𝑗 =1
(1 ∥ 𝑓 − 𝑣
𝑗∥
2/(𝑚−1))
𝑘𝑗 =1
Where uij is the membership of the class i to the j th
neighbor vj
of vector (f). As seen by the equation, the memberships of (f) depend on the inverse of the distance from the nearest neighbors and their class memberships; m is the parameter to determine how important the distance is when evaluating each neighbor’s contribution to the membership value.
2.3
Performance Evaluation of
Classification
classified as positive, TN (True Negative) is the number of Negative instances that are classified as Negative and FN (False Negative) is the number of positive instances that are classified as Negative. Sensitivity (also called the true positive rate, or the recall rate in some fields) measures the proportion of actual positives which are correctly identified, and is complementary to the false negative rate.
𝑆𝑒𝑛𝑠𝑖𝑡𝑖𝑣𝑖𝑡𝑦 =
𝑇𝑃+𝐹𝑁𝑇𝑃Specificity (sometimes called the true negative rate) measures the proportion of negatives which are correctly identified, and is complementary to the false positive rate.
𝑆𝑝𝑒𝑐𝑖𝑓𝑖𝑐𝑖𝑡𝑦 =
𝑇𝑁
𝑇𝑁 + 𝐹𝑃
Accuracy and precision are defined in terms of systematic and random errors. The more common definition associates accuracy with systematic errors and precision with random errors.
𝐴𝑐𝑐𝑢𝑟𝑎𝑐𝑦 =
𝑇𝑃 + 𝑇𝑁
𝑇𝑃 + 𝐹𝑃 + 𝐹𝑁 + 𝑇𝑁
𝑃𝑟𝑒𝑐𝑖𝑠𝑖𝑜𝑛 =
𝑇𝑃
𝑇𝑃 + 𝐹𝑃
The Matthews correlation coefficient (MCC) is used in machine learning as a measure of the quality of binary classifications. It considers true and false positives and negatives and is generally regarded as a balanced measure which can be used even if the classes are of very different sizes. It is a correlation coefficient between the observed and predicted binary classifications and it returns a value between −1 and +1.
𝑀𝐶𝐶 = 𝑇𝑃 ∗ 𝑇𝑁 − 𝐹𝑃 ∗ 𝐹𝑁
(𝑇𝑃 + 𝐹𝑃)(𝑇𝑃 + 𝐹𝑁)(𝑇𝑁 + 𝐹𝑃)(𝑇𝑁 + 𝐹𝑁)
3.
RESULT AND DISCUSSION
In this paper the main objective is to find a more discriminative and smaller feature set for specific function prediction based on sequence derived properties. Various features have been gathered solely from protein sequence, and the features that were irrelevant were removed by using feature selection technique. The accuracy of function classification was greater on smaller set which we have extracted as compared to full feature set.
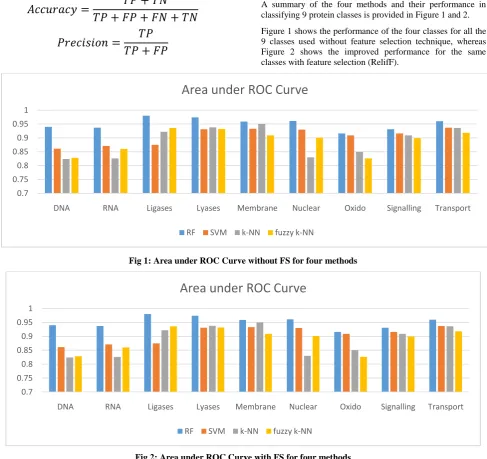
A summary of the four methods and their performance in classifying 9 protein classes is provided in Figure 1 and 2.
Figure 1 shows the performance of the four classes for all the 9 classes used without feature selection technique, whereas Figure 2 shows the improved performance for the same classes with feature selection (RelifF).
[image:3.595.54.542.300.759.2]Fig 1: Area under ROC Curve without FS for four methods
Fig 2: Area under ROC Curve with FS for four methods
0.7 0.75 0.8 0.85 0.9 0.95 1
DNA RNA Ligases Lyases Membrane Nuclear Oxido Signalling Transport
Area under ROC Curve
RF SVM k-NN fuzzy k-NN
0.7 0.75 0.8 0.85 0.9 0.95 1
DNA RNA Ligases Lyases Membrane Nuclear Oxido Signalling Transport
Area under ROC Curve
20 The summary of the performance of four classification
[image:4.595.315.542.69.285.2] [image:4.595.54.277.137.772.2]method in classifying 9 protein classes is provided in given Table 2, whereas Table 3 shows detailed evaluation of all the 9 classes for using different measures. Among all the four methods Random Forest with reliefF feature selection outperformed other classification methods.
Table 2. Overall result for different classifier with feature selection
Random Forest
SVM k-NN Fuzzy k-NN Feature Selec tion T P R at e M C C T P R at e M C C T P R at e M C C TP Rat e M C C CFS 83 .4 0. 81 82 .7 0. 82 8 85 .2 0. 83
81.9 0. 76 Correla tion 88 .5 0. 86 83 .5 0. 83 3 85 .0 0. 83
83.6 0. 78 Gain Ratio 88 .3 0. 86 85 .8 0. 83 9 82 .4 0. 80
82.0 0. 77 Inform ation Gain 88 .2 0. 86 5 85 .3 0. 83 5 81 .9 0. 79
80.8 0. 77 OneR Attribu te 88 .4 0. 88 4 82 .7 0. 82 4 82 .7 0. 80
81.9 0. 74 RelifF 89 .2 0. 87 6 76 .8 0. 77 84 .3 0. 82
82.3 0. 75
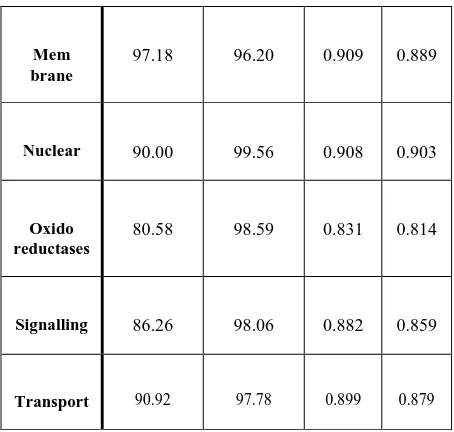
Table 3. Detailed results of different classes
Protein class
Sensitivity Specificity F-mea sure
MCC
DNA 85.68 97.99 0.846 0.827
RNA 80.88 99.97 0.891 0.892
Ligases 93.15 99.55 0.940 0.934
Lyases 88.08 99.63 0.921 0.914
Mem brane
97.18 96.20 0.909 0.889
Nuclear 90.00 99.56 0.908 0.903
Oxido reductases
80.58 98.59 0.831 0.814
Signalling 86.26 98.06 0.882 0.859
Transport 90.92 97.78 0.899 0.879
Here we observed that the overall accuracy of Random Forest is 89.02%. The overall TP Rate and MCC values are 89.02% and 0.876% respectively. Here TP represents true positive rate and MCC represents Matthews’s correlation coefficient.
4.
CONCLUSION
Many comparisons of protein function predictions have not yet been reported which motivates to discover a wide range of similarity and differences between them. This paper described a highly accurate prediction method which is capable of identifying protein function by using feature extracted solely from protein sequences. It presents an alternative approach to represent protein sequences using 857 different features. Various classification techniques were applied among 9 protein classes, but Random Forest achieved high performance, and it outperformed with ReliefF. It correctly achieved an overall accuracy of 89.02% on a widely distributed and reasonably large datasets.
The study presented here suggests that the new classification technique used will be useful in predicting protein function. In future the performance can be increased by integrating more than one classifier together and by integrating multiple data sets together.
5.
REFERENCES
[1] Altschul SF, Gish W, Miller W, Myers EW, Lipman DJ: Basic local alignment search tool. J Mol Biol 1990, 215:403-410.
[2] Pearson WR, Lipman DJ: Improved tools for biological sequencev comparison. Proc Natl Acad Sci USA 1988, 85:2444-2448.
[3] Lee, Bum Ju, et al. "Identification of protein functions using a machine-learning approach based on sequence-derived properties." Proteome science 7.1, 2009: 27.
[4] Statnikov, Alexander, and Constantin F. Aliferis. "Are random forests better than support vector machines for microarray-based cancer classification?" AMIA annual symposium proceedings. Vol. 2007. American Medical Informatics Association, 2007.
[6] Breiman L: Random forests. In Machine Learning Edited by: Schapire RE. Netherlands: Springer; 2001:5-32.
[7] Cai CZ, Wang WL, Sun LZ, Chen YZ: Protein function classification via support vector machine approach. Math Biosci 2003, 185:111-122.
[8] Suykens, Johan AK, and Joos Vandewalle. "Least squares support vector machine classifiers." Neural processing letters 9.3, 1999: 293-300.
[9] Yuan Z, Burrage K, Mattick JS: Prediction of protein solvent accessibility using support vector machines. Proteins 2002, 48:566-570.
[10]Cunningham, Padraig, and Sarah Jane Delany. "k-Nearest neighbour classifiers." Multiple Classifier Systems, 2007: 1-17.
[11]Keller, James M., Michael R. Gray, and James A. Givens. "A fuzzy k-nearest neighbor algorithm." Systems, Man and Cybernetics, IEEE Transactions on 4, 1985: 580-585.